 🔨 Auction
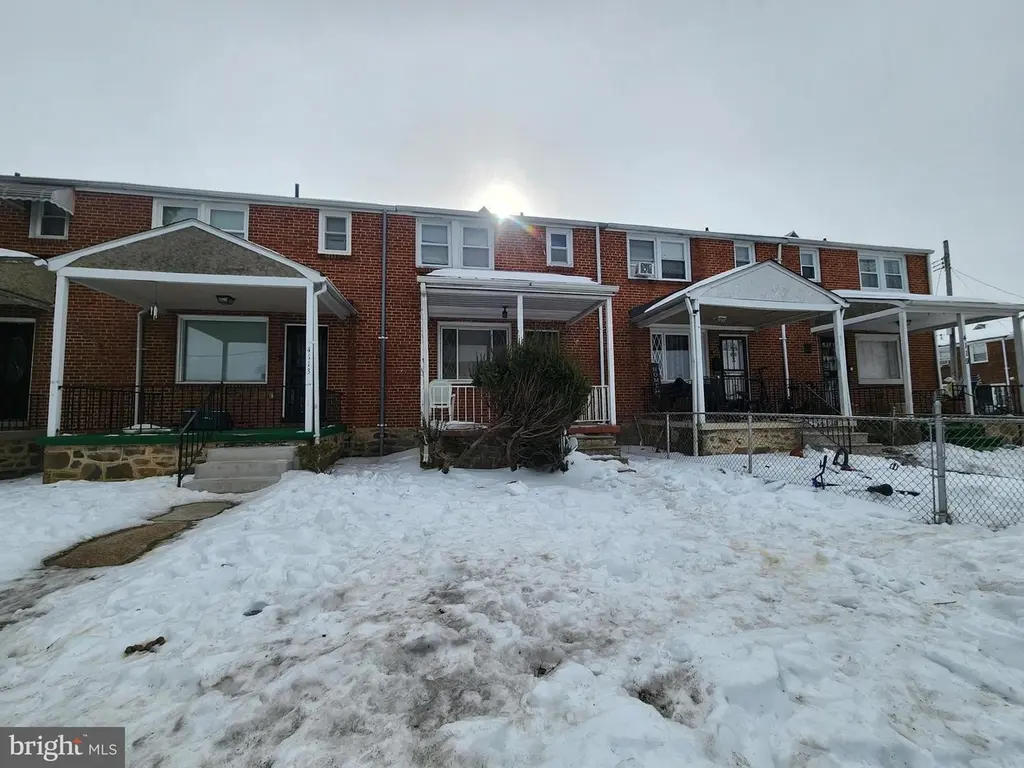
4115 Rockfield Ave · Baltimore, MD
Flood risk 1/10 · Minimal
- FEMA flood zone
- X (unshaded)
- Chance of flooding over 30 yrs
- 0.0%
- Est. flood insurance / yr
- $473 – $860
Fire risk 1/10 · Minimal
- Est. fire insurance / yr
- $755 – $1,403
Heat risk 7/10 · Major
- Hot days now (above 103°F)
- 7 days/yr
- Hot days in 30 yrs
- 15 days/yr
Wind risk 4/10 · Minor
- Chance of severe wind over 30 yrs
- 21.0%
Air-quality risk 3/10 · Minor
- Unhealthy air days now
- 3 days/yr
- Unhealthy air days in 30 yrs
- 4 days/yr
Risk factors via First Street. Map © Google.
Why this score? — see what drove the D- grade
The composite is a weighted blend of 9 inputs, each scored 0–100. Each bar is that input's sub-score; the figure is the points it added to the 100-point composite (weight × sub-score).
- Cash flow +12.0/30.0
- ARV discount +7.5/15.0
- Livability +3.8/5.0
- DSCR +3.6/10.0
- 1% rule +3.5/10.0
- Rent growth +3.1/5.0
- Condition / age +2.5/5.0
- Schools +1.0/10.0
- Appreciation +0.0/10.0
$50,000
🖨 Deal sheet 📄 Offer letter ✓ Due diligence
Listing remarks MLS
ONLINE AUCTION: This auction takes place on the Ashland Auction Group website bidding platform. Bidding begins 6/4/2026 @ 10:00 AM. Bidding ends 6/8/2026 @ 12:30 PM. The list price is the suggested opening bid. Deposit: $5,000. This two-story porch-front townhouse is situated in the Woodmere area of Baltimore City. Residents can enjoy nearby facilities such as the Reisterstown Road Plaza, Pimlico Race Track, Sinai Hospital, Cylburn Arboretum, and the West Cold Spring Metro Station. The property is vacant. The home offers easy access to the major traffic artery, Reisterstown Road.
Key facts
- Close to attractions
- Built 1947
- Listed 206 days
Tags
Neighborhood map
What this means for you Summary
Snapshot
- This is a 3-bed/1.0-bath townhouse listed at $50k.
Deal economics
- At list price, monthly cash flow is $-45 ($-542/yr) — negative.
- The deal already cash-flows at list — no discount required.
- Meets the 1% rule at list price ($2k rent vs $50k).
- Recommended offer: $44k (12.0% below list) — sets the bar for market timing.
Location & tenants
- Location reads 76/100 on livability (#90 in MD, #3,396 nationally) — a middle-class / working-renter tenant base. Strengths: amenities A+, commute A+, housing A+; Watch: schools D, crime F.
- Baltimore City Public Schools (urban): math 7% / reading 16% proficiency, ranked #24 of 24 in MD (top 100%) — low school quality limits family demand, transient renter base, plan for 1-2y turnover; 79% free/reduced lunch — lower-income household profile, screen leases tightly.
- Market conditions: Rents rising (+2.4%/yr); 351 active listings in the ZIP; 40 comparable units currently listed for rent nearby; rentals at typical pace (median 24d on market — plan ~3-4 weeks tenant-placement turnaround); 42% of comp listings sitting > 30 days — soft ceiling on asking rent; 1,273 units permitted in Baltimore city in 2024 (1,104 in 5+ unit buildings).
- This rent runs 38% of the median local income ($52k/yr) — at the standard rent-burdened threshold; future hikes will face affordability resistance.
Forward outlook
- Local home prices are declining (-3.0%/yr); year-one equity from $1k of loan paydown is wiped out by about $6k of value loss. Plan a longer hold.
- Baltimore County population projected to shrink 4% by 2050 — rents likely to lag national; underwrite the cash flow, not the appreciation.
Negotiation context
- It's been on market 206 days — a 12% lower offer ($44k) is reasonable based on typical stale-listing flexibility.
- 4 sale attempts since 2y ago with the ask held roughly flat each time — persistent listings suggest the price (not the market) is what's stuck; bring a comps-based counter.
Risks & watch-outs
- Watch-outs: property tax is 5.8% of price; built in 1947 — expect roof / HVAC / electrical / plumbing capex.
- Climate carrying-cost: extreme-heat days projected 7→15/yr by 2055 (HVAC capex compounding) — expect insurance premiums to compound above CPI over the hold.
Questions for the listing agent
- What do current leases actually rent for vs. the listed asking? Can we see a recent rent roll and the last 12 months of T-12 income?
- It's been on market 206 days. Have you received any prior offers? Is the seller open to a 12% concession, seller financing, or rate buy-down credit?
- Built in 1947 — when were the roof, HVAC, electrical panel, plumbing, and water heater last replaced?
- Property tax is high relative to price — has the assessment been appealed recently, and will the sale trigger a re-assessment?
- Why hasn't it sold? Are there any deal-killer items the seller is aware of (foundation, flood, title, zoning, code violations)?
- Is there a deadline driving the sale (1031 exchange, divorce, estate, relocation)? That informs how much negotiation room exists.
- Schools are D-rated, which usually means shorter tenancies and higher turnover. Who's the typical renter profile here, and what's been the actual vacancy rate?
- Crime grade is F in this area — have there been break-ins, vandalism, or insurance claims at this property in the last 3 years? What carrier currently insures it and at what premium?
- The area grade is low — what's the realistic commute time and amenity access for the typical tenant pool here? Any planned neighborhood developments (good or bad) we should know about?
- What's the average days-on-market for RENTAL listings here right now (not sales)? A rising rental-DOM trend means longer vacancies and softer asking-rent achievability than the comps imply.
- What's the recent tenant-quality profile in this submarket — average credit score on applications, eviction rate, late-payment / NSF rate, and stable-employment percentage? A property-management company in the area should have these aggregated.
- How much new for-sale + rental construction is in the pipeline within 1–3 miles? Heavy new supply typically softens prices + rents 12–24 months out; constrained supply supports both.
Investment metrics
- 1% rule
- 0.85% ✗
- Cap rate
- 6.01%
- Cash-on-cash
- -1.00%
- DSCR
- 0.96
- GRM
- 9.9
CMA / ARV
- ARV (median comp)
- $194,051
- List price
- $50,000
- Delta
- -74.23%
- Verdict
- UNDERPRICED
- Comps
- 20 within 1.0 mi
Show comp detail 12 sales within ~0.75 mi
| Address | Dist | Beds/Ba | Sqft | Sold | Price | $/sf | Match |
|---|---|---|---|---|---|---|---|
| 5444 Fairlawn Ave | 0.09mi | 3/1.5 | 1,178 (+2%) | 7mo | $130,000 | $110 | 84 |
| 5422 Price Ave | 0.17mi | 3/1.5 | 1,080 (-6%) | 2mo | $140,000 | $130 | 78 |
| 5329 Cordelia Ave | 0.34mi | 3/1.0 | 1,080 (-6%) | 1mo | $105,000 | $97 | 73 |
| 5533 Nome Ave | 0.21mi | 2/2.0 (-1) | 1,085 (-6%) | 2mo | $110,500 | $102 | 70 |
| 4105 Newbern Ave | 0.05mi | 3/2.0 | 1,280 (+11%) | 10mo | $234,900 | $184 | 67 |
| 3916 Hayward Ave | 0.27mi | 3/2.5 | 1,248 (+8%) | 3mo | $237,375 | $190 | 65 |
| 3800 Hayward Ave | 0.34mi | 3/2.0 | 1,224 (+6%) | 6mo | $80,000 | $65 | 65 |
| 5423 Jonquil Ave | 0.32mi | 3/1.0 | 1,260 (+9%) | 8mo | $87,000 | $69 | 63 |
| 3918 Dolfield Ave | 0.58mi | 3/1.5 | 1,216 (+6%) | 5mo | $200,000 | $164 | 57 |
| 3914 Ridgewood Ave | 0.70mi | 3/1.5 | 1,110 (-4%) | 6mo | $95,400 | $86 | 54 |
| 3335 Avondale Ave | 0.66mi | 3/2.0 | 1,200 (+4%) | 9mo | $214,000 | $178 | 51 |
| 3958 Oakford Ave | 0.72mi | 4/2.5 (+1) | 1,280 (+11%) | 10mo | $249,000 | $195 | 28 |
Match score weights: distance 35% · size 25% · config 20% · recency 20%. Top-matched comps best support the ARV.
Projected returns pro-forma
-3.0% appreciation · 2.41% rent growth · sell at horizon
- IRR
- -18.6%
- Equity multiple
- 0.35×
- Total profit
- $-35,266
- Equity at exit
- $28,934
- IRR
- -12.2%
- Equity multiple
- 0.30×
- Total profit
- $-38,239
- Equity at exit
- $16,778
Cash invested: $54,334 (down + closing). Projections, not guarantees.
Landlord ↔ Tenant lean methodology
- Overall (CITY)
- 12 Strongly Tenant-Friendly
- State Maryland
- 27 Tenant-Leaning · D+14
- County
- — inherits STATE
- City Baltimore
- 12 Strongly Tenant-Friendly · D+58
ZIP-level market 21215
- Rents YoY
- 2.4%
- Active inventory
- 351
- Price-to-rent
- 2.5×
Monthly cashflow live
- Estimated rent
- $1,640 high interval (Pro) →
- Mortgage (P&I)
- −$1,018
- Tax est. 1.5%
- −$243 /mo · $2,911/yr
- Insurance
- −$81
- HOA
- −$0
- Vacancy / Maint / Mgmt
- −$344
- Net cashflow
- $-45
Break-even live
UW: 25.0% down · 7.5% · 30yr · 1.5% tax · 5.0% vac · 8.0% maint · 8.0% mgmt
Financing live
Cash to close
- Down payment
- $48,513
- Closing costs
- $5,822
- Reserves months
- —
- Total cash needed
- —
Loan-product check · same deal, 3 products live
Conventional
25% down · 7.5% · 30yr
- Down + closing
- —
- Monthly P&I
- —
- Monthly cashflow
- —
- DSCR
- —
- Eligible?
- —
Personal DTI + credit; lowest rate.
DSCR
20% down · 8.5% · 30yr
- Down + closing
- —
- Monthly P&I
- —
- Monthly cashflow
- —
- DSCR
- —
- Eligible?
- —
No personal income docs; deal must DSCR.
Hard money
10% down · 12.0% · 12mo
- Down + closing
- —
- Monthly P&I
- —
- Monthly cashflow
- —
- DSCR
- —
- Eligible?
- —
Short-term bridge; refi at stabilization.
Rent comps 40 comps
| Address | Beds | Baths | Sqft | Rent | $/sqft | DOM | Units | Dist |
|---|---|---|---|---|---|---|---|---|
| 5343 Nelson Ave Baltimore, MD | 2.0 | 1.0 | 1000 | $1,215 | $1.22 | 24d | 1 | 0.26mi |
| 3912 Mortimer Ave Baltimore, MD | 3.0 | 2.0 | 1204 | $2,723 | $2.26 | 44d | 1 | 0.35mi |
| 3908 Groveland Ave Apt F Baltimore, MD | 2.0 | 1.0 | 815 | $1,695 | $2.08 | 44d | 1 | 0.41mi |
| 5000 Litchfield Ave #1 Baltimore, MD | 2.0 | 1.0 | 1100 | $1,100 | $1.00 | 44d | 1 | 0.55mi |
| 4010 Fernhill Ave Unit 2 Baltimore, MD | 2.0 | 1.0 | 1100 | $1,500 | $1.36 | 44d | 1 | 0.58mi |
| 3904 Penhurst Ave Baltimore, MD | 2.0 | 1.0 | 760 | $1,175 | $1.55 | 44d | 1 | 0.61mi |
| 5340 Maple Ave Baltimore, MD | 2.0 | 1.0 | 1200 | $1,950 | $1.62 | 44d | 1 | 0.70mi |
| 5301 Maple Ave Baltimore, MD | 3.0 | 1.0 | 960 | $1,700 | $1.77 | 44d | 1 | 0.73mi |
| 3735 Manchester Ave Baltimore, MD | 2.0 | 1.0 | 1000 | $1,350 | $1.35 | 4d | 1 | 0.73mi |
| 4828 Beaufort Ave Baltimore, MD | 2.0 | 2.5 | 1200 | $1,850 | $1.54 | 24d | 1 | 0.74mi |
| 3784 Columbus Dr Baltimore, MD | 4.0 | 2.0 | 1250 | $2,200 | $1.76 | 24d | 1 | 0.75mi |
| 4016 N Rogers Ave Baltimore, MD | 2.0 | 1.0 | 717 | $1,195 | $1.67 | 44d | 1 | 0.76mi |
| 4008 Fordleigh Rd Baltimore, MD | 1.0–2.0 | 1.0 | 695 | $1,305 | $1.88 | 4d | 6 | 0.86mi |
| 3727 Milford Ave Gwynn Oak, MD | 3.0 | 1.0 | 900 | $1,450 | $1.61 | 44d | 1 | 0.87mi |
| 3807 Bowers Ave Gwynn Oak, MD | 3.0 | 1.5 | 1152 | $2,200 | $1.91 | 44d | 1 | 0.97mi |
| 3617 Mohawk Ave Baltimore, MD | 2.0 | 1.0 | 1000 | $1,595 | $1.59 | 44d | 1 | 0.99mi |
| 3615 Mohawk Ave Gwynn Oak, MD | 2.0 | 1.0 | 1000 | $1,610 | $1.61 | 44d | 1 | 0.99mi |
| 3016 Thorndale Ave Baltimore, MD | 1.0–3.0 | 1.0 | 700 | $1,200 | $1.71 | 4d | 14 | 1.00mi |
| 3601 Howard Park Ave Unit 2 Baltimore, MD | 3.0 | 1.0 | 1000 | $1,650 | $1.65 | 44d | 1 | 1.03mi |
| 3638 Fords Ln Baltimore, MD | 2.0 | 2.0 | 1001 | $1,795 | $1.79 | 44d | 1 | 1.05mi |
| 5115 Pembridge Ave Baltimore, MD | 3.0 | 2.0 | 1088 | $2,150 | $1.98 | 44d | 1 | 1.05mi |
| 3701 Garrison Blvd Unit 3 Baltimore, MD | 2.0 | 1.0 | 820 | $1,399 | $1.71 | 24d | 1 | 1.12mi |
| 3705 Midheights Rd Baltimore, MD | 3.0 | 1.5 | 1024 | $1,900 | $1.86 | 24d | 1 | 1.13mi |
| 3600 Garrison Blvd Unit T2 Baltimore, MD | 2.0 | 1.0 | 750 | $1,149 | $1.53 | 24d | 1 | 1.18mi |
| 3600 Garrison Blvd Apt T1 Baltimore, MD | 2.0 | 1.0 | 800 | $1,125 | $1.41 | 3d | 1 | 1.18mi |
| 6317 Pearce Ave Baltimore, MD | 2.0 | 2.0 | 1140 | $1,600 | $1.40 | 44d | 1 | 1.18mi |
| 3809 Clarks Ln Unit 301 Baltimore, MD | 2.0 | 2.0 | 1057 | $1,600 | $1.51 | 24d | 1 | 1.18mi |
| 5902 Cross Country Blvd Baltimore, MD | 2.0 | 2.0 | 720 | $1,575 | $2.19 | 24d | 1 | 1.18mi |
| 5902 Cross Country Blvd Baltimore, MD | 1.0–2.0 | 1.0–2.0 | 785 | $1,699 | $2.16 | 4d | 6 | 1.18mi |
| 3601 Parkview Ave Gwynn Oak, MD | 2.0 | 1.0 | 849 | $1,412 | $1.66 | 3d | 6 | 1.20mi |
| 2900 Taney Rd Apt 1A Baltimore, MD | 2.0 | 2.0 | 1200 | $1,600 | $1.33 | 24d | 1 | 1.22mi |
| 3915 Liberty Heights Ave Gwynn Oak, MD | 1.0–2.0 | 1.0–2.0 | 680 | $1,345 | $1.98 | 13d | 5 | 1.28mi |
| 5009 Norwood Ave Gwynn Oak, MD | 2.0 | 1.0 | 800 | $1,150 | $1.44 | 44d | 1 | 1.31mi |
| 4230 Towanda Ave Baltimore, MD | 3.0 | 2.0 | 1400 | $1,800 | $1.29 | 18d | 1 | 1.32mi |
| 6609 Eberle Dr Baltimore, MD | 1.0–3.0 | 1.0–2.0 | 1011 | $1,787 | $1.77 | 2d | 25 | 1.33mi |
| 3607 Labyrinth Rd Baltimore, MD | 1.0–3.0 | 1.0–2.0 | 925 | $2,100 | $2.27 | 20d | 5 | 1.35mi |
| 2432 Everton Rd Unit 2435 A Baltimore, MD | 2.0 | 1.5 | 1000 | $1,500 | $1.50 | 24d | 1 | 1.37mi |
| 4910 Poe Ave Unit 2 Baltimore, MD | 2.0 | 1.0 | 750 | $990 | $1.32 | 24d | 1 | 1.40mi |
| 2915 Oakford Ave Baltimore, MD | 3.0 | 2.0 | 1102 | $1,600 | $1.45 | 18d | 1 | 1.41mi |
| 3508 Grantley Rd Baltimore, MD | 2.0 | 1.0 | 1250 | $1,350 | $1.08 | 24d | 1 | 1.41mi |
Listing history 26 events
-
2026-06-18days on market $50,000 Active 206 DOM
-
2026-06-17days on market $50,000 Active 205 DOM
-
2026-06-16days on market $50,000 Active 204 DOM
-
2026-06-15days on market $50,000 Active 203 DOM
-
2026-06-13days on market $50,000 Active 201 DOM
-
2026-06-09days on market $50,000 Active 197 DOM
-
2026-06-08remarks 588-char remark
-
2026-06-08days on market $50,000 Active 196 DOM
-
2026-06-07days on market $50,000 Active 195 DOM
-
2026-06-04days on market $50,000 Active 192 DOM
-
2026-06-03days on market $50,000 Active 191 DOM
-
2026-06-02days on market $50,000 Active 190 DOM
-
2026-06-01days on market $50,000 Active 189 DOM
-
2026-05-31days on market $50,000 Active 188 DOM
-
2025-11-24$50,000 Active 586-char remark
Show marketing remark (586 chars)
ONLINE AUCTION: This auction takes place on the Ashland Auction Group website bidding platform. Bidding begins 6/4/2026 @ 10:00 AM. Bidding ends 6/8/2026 @ 12:30 PM. The list price is the suggested opening bid. Deposit: $5,000. This two-story porch-front townhouse is situated in the Woodmere area of Baltimore City. Residents can enjoy nearby facilities such as the Reisterstown Road Plaza, Pimlico Race Track, Sinai Hospital, Cylburn Arboretum, and the West Cold Spring Metro Station. The property is vacant. The home offers easy access to the major traffic artery, Reisterstown Road.
-
2025-05-07historical
-
2025-03-24$50,000 Active
-
2025-01-27historical
-
2024-10-23price $75,000
-
2024-10-15$100,000 Active
-
2024-10-02soldstatus $110,000
-
2024-08-23soldstatus $110,000 Closed
-
2024-07-10status Pending
-
2024-05-03price $50,000
-
2024-04-04$75,000 Active
-
1983-03-14soldstatus $11,750
ⓘ Source: listings_history table (triggers on properties + properties_extension) + one-shot
backfill from property_details.listing_events for pre-trigger history.
Climate risk First Street
- Flood 1/10 Low FEMA zone X (unshaded) · 0% chance over 30 yrs
- Wildfire 1/10 Low
- Heat 7/10 Severe 7 d/yr ≥103°F today · 15 d/yr by 30 yrs out
- Wind 4/10 Moderate 21% chance of damaging wind over 30 yrs
- Air quality 3/10 Moderate 3 unhealthy d/yr today · 4 by 30 yrs out
Nearby sold comps map
Loading sold comps map…
Walkable amenities ~0.75 mi
Loading nearby amenities…
Taxation est. · year 1
- Rental income
- $19,684
- − Mortgage interest
- −$10,870
- − Property taxes
- −$2,911
- − Insurance
- −$970
- − Repairs & maintenance
- −$1,575
- − Management
- −$1,575
- − Depreciation
- −$5,645
- Taxable loss
- −$3,861
- Est. tax savings @ 24.0%
- +$927
- After-tax cash flow
- $385/yr
For passive investors: Depreciation is non-cash, so a rental often shows a tax loss while cash-flowing — sheltering income. Rental losses are passive: they offset passive income freely, and up to $25,000/yr can offset ordinary (W-2) income if you actively participate and your MAGI is under $100k (phasing out to $0 by $150k); unused losses carry forward. On sale, claimed depreciation is recaptured at up to 25%, and gains may owe capital-gains tax (a 1031 exchange can defer both). Figures are a year-1 estimate at your 24.0% rate — not tax advice; consult a CPA.
Schools (NCES district)
- District
- Baltimore City Public Schools
- NCES district ID
- 2400090
- Math proficiency
- 7% ▼ -9.00%
- Reading proficiency
- 16% ▼ -5.00%
- Median HH income
- $42,108
- Composite
- 10.08/100
- National rank
- #9805
- State rank
- #24 of 24 in MD
Livability — Baltimore
- Score
- 76/100
- State rank
- #90
- US rank
- #3396
Category grades
Schools grade is shown separately in the Schools card above.
Census & demographics
- Census place
- Baltimore, MD
- County
- Baltimore City · 558,601 people
- City population
- 588,727
- Metro
- Baltimore-Columbia-Towson, MD
- Population (ZIP)
- 52,229
- Household income
- $51,587
- Rent vs Own
- Severe rent burden
- 3644.0
Population outlook (Baltimore County) Hauer SSP2
- Today (2025)
- 624,249 people
- By 2030
- 621,541 · -0.4%
- By 2040
- 609,756 · -2.3%
- By 2050
- 597,249 · -4.3%
- By 2075
- 552,236 · -11.5%
- By 2100
- 513,934 · -17.7%
Race, ethnicity, and origin ACS 2023
- Neighborhood character
- Predominantly Black (73%)
- Race & ethnicity
- Black 73% White 17% Hispanic / Latino 5% Two or more races 4% Asian 1%
- Common ancestry
- Scotch-Irish 2% Romanian 2% Italian 1%
- Foreign-born
- 9% · Canada, South Korea
- Languages at home
- 91% English-only · Spanish 4% French/Haitian/Cajun 1% Other Indo-European 1%
Political lean MEDSL · Baltimore
- 2024 margin
- Solid D (+73.0) · D 85.2% · R 12.2% · Other 2.6%
- 2008→2024 swing
- -2.5pp toward R · 2008: 75.5pp · 2024: 73.0pp
- All cycles
- 2024: D+73.0 2020: D+76.6 2016: D+74.6 2012: D+76.4 2008: D+75.5
Not yet ingested
- Civics
- —
Market trends
- HPI YoY
- ▼ -318.58%
- Current HPI
- 291.4926
- Rent YoY
- ▲ 2.41%
- Metro
- Baltimore-Columbia-Towson, MD
- State GDP YoY
- ▲ 2.97%
- F500 in state
- 12
Industry mix (Fortune 500 HQ in MD)
| Industry | F500 HQs | Revenue |
|---|---|---|
| Aerospace / Defense | 1 | $71B |
|
||
| Utilities | 1 | $25B |
|
||
| Hotels | 1 | $24B |
|
||
| Consumer Goods | 1 | $7B |
|
||
| Real Estate | 1 | $6B |
|
||
| Chemicals | 1 | $2B |
|
||
Price history
+325.5% since first listed12 events — show timeline
- 2025-11-24 Listed $50,000 BRIGHT MLS
- 2025-05-07 Listing Removed — BRIGHT MLS
- 2025-03-24 Listed $50,000 BRIGHT MLS
- 2025-01-27 Listing Removed — BRIGHT MLS
- 2024-10-23 Price Changed $75,000 BRIGHT MLS
- 2024-10-15 Listed $100,000 BRIGHT MLS
- 2024-10-02 Sold (Public Records) $110,000 Public Records
- 2024-08-23 Sold (MLS) $110,000 BRIGHT MLS
- 2024-07-10 Pending — BRIGHT MLS
- 2024-05-03 Price Changed $50,000 BRIGHT MLS
- 2024-04-04 Listed $75,000 BRIGHT MLS
- 1983-03-14 Sold (Public Records) $11,750 Public Records
Property tax history
+0.3%/yrLatest (2025): $2,591 · -16.2% YoY. Source: county tax records.
Cash-flow waterfall
monthlySold comps — $/sqft
last 12 mo · ≤1 miLoading sold comps…