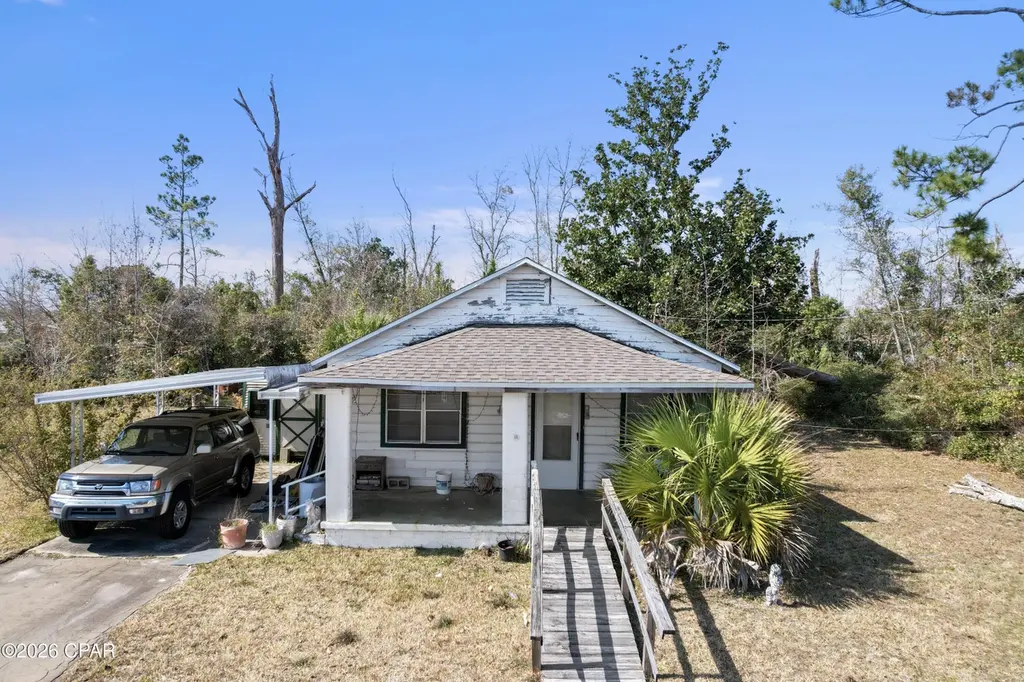
1408 Alabama Ave · Lynn Haven, FL
Flood risk 3/10 · Minor
- FEMA flood zone
- X (unshaded)
- Chance of flooding over 30 yrs
- 0.2%
- Est. flood insurance / yr
- $507 – $1,088
Fire risk 1/10 · Minimal
- Est. fire insurance / yr
- $947 – $1,759
Heat risk 10/10 · Severe
- Hot days now (above 104°F)
- 7 days/yr
- Hot days in 30 yrs
- 21 days/yr
Wind risk 9/10 · Severe
- Chance of severe wind over 30 yrs
- 99.0%
Air-quality risk 1/10 · Minimal
- Unhealthy air days now
- 0 days/yr
- Unhealthy air days in 30 yrs
- 0 days/yr
Risk factors via First Street. Map © Google.
Why this score? — see what drove the C- grade
The composite is a weighted blend of 9 inputs, each scored 0–100. Each bar is that input's sub-score; the figure is the points it added to the 100-point composite (weight × sub-score).
- Cash flow +15.6/30.0
- ARV discount +15.0/15.0
- DSCR +4.8/10.0
- Schools +4.3/10.0
- Livability +4.0/5.0
- 1% rule +3.9/10.0
- Rent growth +3.1/5.0
- Condition / age +2.5/5.0
- Appreciation +0.0/10.0
$195,000
🖨 Deal sheet (PDF) 📄 Offer letter ✓ Due diligence
Listing remarks MLS
Welcome to 1408 Alabama Ave, a treasured home in the heart of sought-after Lynn Haven. Built in 1950 and lovingly maintained by the same family, this solid cinderblock home—full of character and rich with history—awaits a new vision. While it needs some work, it offers incredible potential. Nestled on over half an acre by itself, it can also be sold alongside 1412 Alabama Ave, creating a total of 6 lots—three on each property—spanning over an acre. This is a rare investment opportunity in a prime location—bring your vision and let this home flourish once again!
Key facts
- Over half an acre
- Prime location
- 0.52 acre lot
Tags
Neighborhood map
What this means for you Summary
Snapshot
- This is a 3-bed/1.0-bath single-family listed at $195k.
Deal economics
- At list price, monthly cash flow is $83 ($997/yr) — positive.
- The deal already cash-flows at list — no discount required.
- To meet the 1% rule (rent ≥ 1% of price), the offer needs to be $174k (10.5% below list).
- Recommended offer: $172k (12.0% below list) — sets the bar for market timing.
- Cap rate 6.8% vs local median 3.5% in Lynn Haven — top-decile yield for the area; either an underpriced asset or a hidden risk that comps aren't pricing in. Stress-test before assuming the spread holds.
Location & tenants
- Location reads 81/100 on livability (#96 in FL, #1,472 nationally) — a professional / high-income tenant draw. Strengths: crime A+, housing A+, health & safety A+; Watch: amenities D+, commute F.
- Bay (suburban): math 51% / reading 51% proficiency, ranked #29 of 73 in FL (top 40%) — acceptable for families but not a draw, mixed tenant base, ~2y average lease.
- Market conditions: Rents rising (+2.5%/yr); 196 active listings in the ZIP; 6 comparable units currently listed for rent nearby; rentals at typical pace (median 22d on market — plan ~3-4 weeks tenant-placement turnaround); solid renter incomes; 2,473 units permitted in Bay County in 2024 (559 in 5+ unit buildings).
Forward outlook
- Local home prices are declining (-3.0%/yr); year-one equity from $1k of loan paydown is wiped out by about $6k of value loss. Plan a longer hold.
- Bay County population projected at +24% by 2050 — long-run rental-demand tailwind backs the buy-and-hold thesis.
Negotiation context
- It's been on market 126 days — a 12% lower offer ($172k) is reasonable based on typical stale-listing flexibility.
Risks & watch-outs
- Watch-outs: built in 1950 — expect roof / HVAC / electrical / plumbing capex.
- Climate carrying-cost: severe wind risk, 99% chance of damaging wind over 30y; extreme-heat days projected 7→21/yr by 2055 (HVAC capex compounding) — expect insurance premiums to compound above CPI over the hold.
Questions for the listing agent
- It's been on market 126 days. Have you received any prior offers? Is the seller open to a 12% concession, seller financing, or rate buy-down credit?
- Built in 1950 — when were the roof, HVAC, electrical panel, plumbing, and water heater last replaced?
- Why hasn't it sold? Are there any deal-killer items the seller is aware of (foundation, flood, title, zoning, code violations)?
- Is there a deadline driving the sale (1031 exchange, divorce, estate, relocation)? That informs how much negotiation room exists.
- Schools are B-rated — typically a magnet for longer-tenancy family renters. What's the average tenant stay here, and is there a school-zone premium baked into asking?
- What's the average days-on-market for RENTAL listings here right now (not sales)? A rising rental-DOM trend means longer vacancies and softer asking-rent achievability than the comps imply.
- What's the recent tenant-quality profile in this submarket — average credit score on applications, eviction rate, late-payment / NSF rate, and stable-employment percentage? A property-management company in the area should have these aggregated.
- How much new for-sale + rental construction is in the pipeline within 1–3 miles? Heavy new supply typically softens prices + rents 12–24 months out; constrained supply supports both.
Investment metrics
- 1% rule
- 0.89% ✗
- Cap rate
- 6.80%
- Cash-on-cash
- 1.83%
- DSCR
- 1.08
- GRM
- 9.3
CMA / ARV
- ARV (median comp)
- $237,605
- List price
- $195,000
- Delta
- -17.93%
- Verdict
- UNDERPRICED
- Comps
- 20 within 1.0 mi
Show comp detail 12 sales within ~0.75 mi
| Address | Dist | Beds/Ba | Sqft | Sold | Price | $/sf | Match |
|---|---|---|---|---|---|---|---|
| 606 W 14th St | 0.12mi | 3/2.0 | 1,086 (-4%) | 6mo | $255,000 | $235 | 79 |
| 1419 Virginia Ave | 0.07mi | 3/2.0 | 1,040 (-8%) | 2mo | $225,000 | $216 | 78 |
| 1402 Carolina Ave | 0.28mi | 3/1.0 | 1,020 (-9%) | 11mo | $195,000 | $191 | 62 |
| 1207 Alabama Ave | 0.18mi | 3/2.0 | 1,240 (+10%) | 11mo | $288,000 | $232 | 62 |
| 1112 Indiana Ave | 0.56mi | 3/1.0 | 1,093 (-3%) | 11mo | $192,000 | $176 | 59 |
| 1007 Alabama Ave | 0.43mi | 3/1.5 | 1,253 (+11%) | 0mo | $225,000 | $180 | 59 |
| 810 Alabama Ave | 0.58mi | 4/2.0 (+1) | 1,200 (+7%) | 1mo | $299,925 | $250 | 52 |
| 1109 Minnesota Ave | 0.66mi | 3/2.0 | 1,116 (-1%) | 15mo | $259,000 | $232 | 51 |
| 1201 Pennsylvania Ave | 0.44mi | 3/2.0 | 1,255 (+12%) | 7mo | $285,000 | $227 | 50 |
| 716 New York Ave | 0.70mi | 3/1.0 | 1,080 (-4%) | 16mo | $159,900 | $148 | 47 |
| 808 Tennessee Ave | 0.64mi | 3/2.0 | 1,232 (+9%) | 13mo | $276,500 | $224 | 40 |
| 201 E 8th St | 0.74mi | 3/2.0 | 1,274 (+13%) | 15mo | $280,000 | $220 | 27 |
Match score weights: distance 35% · size 25% · config 20% · recency 20%. Top-matched comps best support the ARV.
Projected returns pro-forma
-3.0% appreciation · 2.52% rent growth · sell at horizon
- IRR
- -13.9%
- Equity multiple
- 0.50×
- Total profit
- $-27,153
- Equity at exit
- $29,075
- IRR
- -5.9%
- Equity multiple
- 0.63×
- Total profit
- $-20,265
- Equity at exit
- $16,860
Cash invested: $54,600 (down + closing). Projections, not guarantees.
Landlord ↔ Tenant lean methodology
- Overall (STATE)
- 87 Strongly Landlord-Friendly
- State Florida
- 87 Strongly Landlord-Friendly · R+3
- County
- — inherits STATE
- City
- — inherits STATE
ZIP-level market 32444
- Home prices YoY
- -29.1%
- Rents YoY
- 2.5%
- Active inventory
- 196
- Price-to-rent
- 9.3×
Monthly cashflow live
- Estimated rent
- $1,745 high interval (Pro) →
- Mortgage (P&I)
- −$1,023
- Tax from tax record
- −$192 /mo · $2,298/yr
- Insurance
- −$81
- HOA
- −$0
- Vacancy / Maint / Mgmt
- −$366
- Net cashflow
- $83
Break-even live
Sensitivity live
| Price | -10% $193 | -5% $138 | +0% $83 | +5% $28 | +10% $-27 |
|---|---|---|---|---|---|
| Rent | -10% $-55 | -5% $14 | +0% $83 | +5% $152 | +10% $221 |
| Rate | -1.0pp $181 | -0.5pp $133 | base $83 | +0.5pp $33 | +1.0pp $-19 |
UW: 25.0% down · 7.5% · 30yr · 1.5% tax · 5.0% vac · 8.0% maint · 8.0% mgmt
Financing live
Cash to close
- Down payment
- $48,750
- Closing costs
- $5,850
- Reserves months
- —
- Total cash needed
- —
Loan-product check · same deal, 3 products live
Conventional
25% down · 7.5% · 30yr
- Down + closing
- —
- Monthly P&I
- —
- Monthly cashflow
- —
- DSCR
- —
- Eligible?
- —
Personal DTI + credit; lowest rate.
DSCR
20% down · 8.5% · 30yr
- Down + closing
- —
- Monthly P&I
- —
- Monthly cashflow
- —
- DSCR
- —
- Eligible?
- —
No personal income docs; deal must DSCR.
Hard money
10% down · 12.0% · 12mo
- Down + closing
- —
- Monthly P&I
- —
- Monthly cashflow
- —
- DSCR
- —
- Eligible?
- —
Short-term bridge; refi at stabilization.
Rent comps 6 comps
| Address | Beds | Baths | Sqft | Rent | $/sqft | DOM | Units | Dist |
|---|---|---|---|---|---|---|---|---|
| 1409 Florida Ave Lynn Haven, FL | 2.0 | 1.0 | 800 | $1,276 | $1.59 | 22d | 1 | 0.27mi |
| 1307 Pennsylvania Ave Unit 1 Lynn Haven, FL | 3.0 | 1.0 | 1256 | $1,500 | $1.19 | 14d | 1 | 0.41mi |
| 1019 Bradford Cir Unit 1019 Lynn Haven, FL | 2.0 | 1.0 | 810 | $1,225 | $1.51 | 22d | 1 | 1.19mi |
| 1125 Bradley Cir Lynn Haven, FL | 3.0 | 2.0 | 1190 | $1,850 | $1.55 | 14d | 1 | 1.27mi |
| 3938 Solano Rd Unit 3938 Panama City, FL | 3.0 | 2.5 | 1450 | $1,800 | $1.24 | 22d | 1 | 1.38mi |
| 3900 Arbor Trace Dr Lynn Haven, FL | 2.0–3.0 | 2.0 | 1520 | $1,854 | $1.22 | 14d | 34 | 1.48mi |
Listing history 21 events
-
2026-06-19days on market $195,000 Active 126 DOM
-
2026-06-18days on market $195,000 Active 125 DOM
-
2026-06-17days on market $195,000 Active 124 DOM
-
2026-06-16days on market $195,000 Active 123 DOM
-
2026-06-15days on market $195,000 Active 122 DOM
-
2026-06-14days on market $195,000 Active 120 DOM
-
2026-06-13days on market $195,000 Active 119 DOM
-
2026-06-10days on market $195,000 Active 117 DOM
-
2026-06-09days on market $195,000 Active 116 DOM
-
2026-06-08days on market $195,000 Active 115 DOM
-
2026-06-07days on market $195,000 Active 114 DOM
-
2026-06-05days on market $195,000 Active 111 DOM
-
2026-06-03days on market $195,000 Active 110 DOM
-
2026-06-02days on market $195,000 Active 109 DOM
-
2026-06-01days on market $195,000 Active 108 DOM
-
2026-05-31days on market $195,000 Active 107 DOM
-
2026-05-30days on market $195,000 Active 106 DOM
-
2026-05-15price $195,000 597-char remark
Show marketing remark (597 chars)
Welcome to 1408 Alabama Ave, a treasured home in the heart of sought-after Lynn Haven. Built in 1950 and lovingly maintained by the same family, this solid cinderblock home—full of character and rich with history—awaits a new vision. While it needs some work, it offers incredible potential. Nestled on over half an acre by itself, it can also be sold alongside 1412 Alabama Ave, creating a total of 6 lots—three on each property—spanning over an acre. This is a rare investment opportunity in a prime location—bring your vision and let this home flourish once again!
-
2026-03-09price $199,000 597-char remark
Show marketing remark (597 chars)
Welcome to 1408 Alabama Ave, a treasured home in the heart of sought-after Lynn Haven. Built in 1950 and lovingly maintained by the same family, this solid cinderblock home—full of character and rich with history—awaits a new vision. While it needs some work, it offers incredible potential. Nestled on over half an acre by itself, it can also be sold alongside 1412 Alabama Ave, creating a total of 6 lots—three on each property—spanning over an acre. This is a rare investment opportunity in a prime location—bring your vision and let this home flourish once again!
-
2026-02-25price $205,000 597-char remark
Show marketing remark (597 chars)
Welcome to 1408 Alabama Ave, a treasured home in the heart of sought-after Lynn Haven. Built in 1950 and lovingly maintained by the same family, this solid cinderblock home—full of character and rich with history—awaits a new vision. While it needs some work, it offers incredible potential. Nestled on over half an acre by itself, it can also be sold alongside 1412 Alabama Ave, creating a total of 6 lots—three on each property—spanning over an acre. This is a rare investment opportunity in a prime location—bring your vision and let this home flourish once again!
-
2026-02-13$215,000 Active 597-char remark
Show marketing remark (597 chars)
Welcome to 1408 Alabama Ave, a treasured home in the heart of sought-after Lynn Haven. Built in 1950 and lovingly maintained by the same family, this solid cinderblock home—full of character and rich with history—awaits a new vision. While it needs some work, it offers incredible potential. Nestled on over half an acre by itself, it can also be sold alongside 1412 Alabama Ave, creating a total of 6 lots—three on each property—spanning over an acre. This is a rare investment opportunity in a prime location—bring your vision and let this home flourish once again!
ⓘ Source: listings_history table (triggers on properties + properties_extension) + one-shot
backfill from property_details.listing_events for pre-trigger history.
Tax reassessment forecast FL · Resets to sale price
- Current annual tax
- $2,298 · $192/mo
- Projected year-2 tax
- $2,298 · $192/mo
- Expected delta
- $0/yr ($0/mo · 0.0%)
ⓘ Screening estimate from a state-policy table — verify with the county assessor before closing.
Climate risk First Street
- Flood 3/10 Moderate FEMA zone X (unshaded) · 20% chance over 30 yrs
- Wildfire 1/10 Low
- Heat 10/10 Extreme 7 d/yr ≥104°F today · 21 d/yr by 30 yrs out
- Wind 9/10 Extreme 99% chance of damaging wind over 30 yrs
- Air quality 1/10 Low 0 unhealthy d/yr today · 0 by 30 yrs out
Nearby sold comps map
Loading sold comps map…
Walkable amenities ~0.75 mi
Loading nearby amenities…
Taxation est. · year 1
- Rental income
- $20,938
- − Mortgage interest
- −$10,923
- − Property taxes
- −$2,298
- − Insurance
- −$975
- − Repairs & maintenance
- −$1,675
- − Management
- −$1,675
- − Depreciation
- −$5,673
- Taxable loss
- −$2,281
- Est. tax savings @ 24.0%
- +$547
- After-tax cash flow
- $1,544/yr
For passive investors: Depreciation is non-cash, so a rental often shows a tax loss while cash-flowing — sheltering income. Rental losses are passive: they offset passive income freely, and up to $25,000/yr can offset ordinary (W-2) income if you actively participate and your MAGI is under $100k (phasing out to $0 by $150k); unused losses carry forward. On sale, claimed depreciation is recaptured at up to 25%, and gains may owe capital-gains tax (a 1031 exchange can defer both). Figures are a year-1 estimate at your 24.0% rate — not tax advice; consult a CPA.
Schools (NCES district)
- District
- Bay
- NCES district ID
- 1200090
- Math proficiency
- 51% ▼ -8.00%
- Reading proficiency
- 51% ▼ -7.00%
- Median HH income
- $47,740
- Composite
- 43.41/100
- National rank
- #3014
- State rank
- #29 of 73 in FL
Livability — Lynn Haven
- Score
- 81/100
- State rank
- #96
- US rank
- #1472
Category grades
Schools grade is shown separately in the Schools card above.
Census & demographics
- Census place
- Lynn Haven, FL
- County
- Bay County · 163,593 people
- City population
- 21,459
- Metro
- Panama City, FL
- Population (ZIP)
- 21,459
- Household income
- $83,160
- Rent vs Own
- Severe rent burden
- 430.0
Population outlook (Bay County) Hauer SSP2
- Today (2025)
- 206,264 people
- By 2030
- 217,740 · +5.6%
- By 2040
- 238,738 · +15.7%
- By 2050
- 255,545 · +23.9%
- By 2075
- 288,295 · +39.8%
- By 2100
- 288,638 · +39.9%
Race, ethnicity, and origin ACS 2023
- Neighborhood character
- Predominantly White (75%)
- Race & ethnicity
- White 75% Two or more races 11% Hispanic / Latino 10% Black 6% Asian 3%
- Hispanic origin (detail)
- Mexican 2% Puerto Rican 2%
- Common ancestry
- Lithuanian 3% Romanian 3% Serbian 2%
- Foreign-born
- 10% · Canada, Vietnam, South Korea
- Languages at home
- 87% English-only · Spanish 8% Russian/Polish/Slavic 1% Other Indo-European 1%
Political lean MEDSL · Bay
- 2024 margin
- Solid R (+47.4) · D 25.8% · R 73.1% · Other 1.1%
- 2008→2024 swing
- -6.6pp toward R · 2008: -40.7pp · 2024: -47.4pp
- All cycles
- 2024: R+47.4 2020: R+43.5 2016: R+46.3 2012: R+43.6 2008: R+40.7
Not yet ingested
- Civics
- —
Market trends
- HPI YoY
- ▼ -108.08%
- Current HPI
- 263.5418
- Rent YoY
- ▲ 2.52%
- Metro
- Panama City, FL
- State GDP YoY
- ▲ 3.28%
- F500 in state
- 36
Industry mix (Fortune 500 HQ in FL)
| Industry | F500 HQs | Revenue |
|---|---|---|
| Industrial Technology | 2 | $29B |
|
||
| Insurance | 2 | $17B |
|
||
| Retail | 1 | $60B |
|
||
| Technology Distribution | 1 | $58B |
|
||
| Homebuilding | 1 | $35B |
|
||
| Technology Manufacturing | 1 | $35B |
|
||
Price history
-9.3% since first listed4 events — show timeline
- 2026-05-15 Price Changed $195,000 CPARMLS
- 2026-03-09 Price Changed $199,000 CPARMLS
- 2026-02-25 Price Changed $205,000 CPARMLS
- 2026-02-13 Listed $215,000 CPARMLS
Property tax history
+28.2%/yrLatest (2025): $2,298 · -4.4% YoY. Source: county tax records.
Cash-flow waterfall
monthlySold comps — $/sqft
last 12 mo · ≤1 miLoading sold comps…