1908 Shady Cove Dr · Holiday, FL
Flood risk 4/10 · Minor
- FEMA flood zone
- X (unshaded)
- Chance of flooding over 30 yrs
- 0.13%
- Est. flood insurance / yr
- $507 – $1,088
Fire risk 2/10 · Minimal
- Est. fire insurance / yr
- $947 – $1,759
Heat risk 10/10 · Severe
- Hot days now (above 109°F)
- 7 days/yr
- Hot days in 30 yrs
- 27 days/yr
Wind risk 10/10 · Severe
- Chance of severe wind over 30 yrs
- 99.0%
Air-quality risk 2/10 · Minimal
- Unhealthy air days now
- 1 days/yr
- Unhealthy air days in 30 yrs
- 1 days/yr
Risk factors via First Street. Map © Google.
Why this score? — see what drove the C+ grade
The composite is a weighted blend of 9 inputs, each scored 0–100. Each bar is that input's sub-score; the figure is the points it added to the 100-point composite (weight × sub-score).
- Cash flow +29.8/30.0
- DSCR +10.0/10.0
- 1% rule +8.0/10.0
- Schools +4.3/10.0
- Livability +3.3/5.0
- Rent growth +3.0/5.0
- Condition / age +2.5/5.0
- ARV discount +0.0/15.0
- Appreciation +0.0/10.0
$97,900
🖨 Deal sheet 📄 Offer letter ✓ Due diligence
Listing remarks
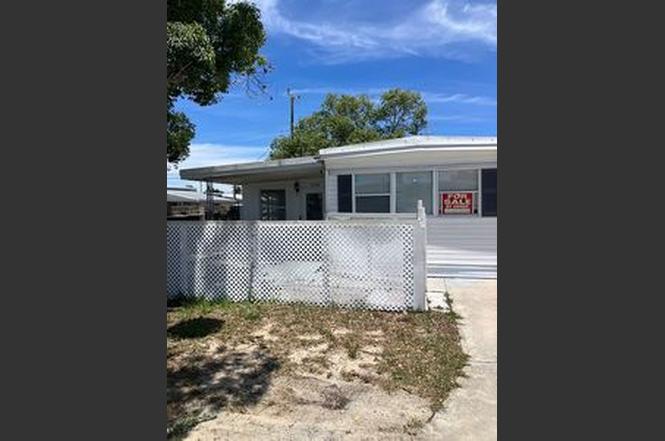
For Sale, 2br/1ba in the heart of Holiday, Fl. Great move in condition, New roof in 2022 This is a single wide mobile home situated on its own land with attached concrete block room, and a concrete block storage/laundry room. Low HOA fee of $36 per month, includes trash pick-up. Within walking distance to the club house. $97,900 Creative financing available Call 727-789-2777
Key facts
- New roof
- Concrete block room
- Built 1969
Tags
Property features AI
Exterior
- Home design: Single-story property built in 1969
- Construction: Built in 1969
- Exterior features: Located in the Buena Vista subdivision
Neighborhood map
What this means for you Summary
Snapshot
- This is a 1-bed/1.0-bath manufactured listed at $98k.
Deal economics
- At list price, monthly cash flow is $360 ($4k/yr) — positive.
- The deal already cash-flows at list — no discount required.
- Meets the 1% rule at list price ($1k rent vs $98k).
- Cap rate 10.7% vs local median 4.7% in Holiday — top-decile yield for the area; either an underpriced asset or a hidden risk that comps aren't pricing in. Stress-test before assuming the spread holds.
Location & tenants
- Location reads 66/100 on livability (#623 in FL) — a middle-class / working-renter tenant base. Strengths: cost of living A+, housing A+, health & safety B; Watch: crime D+, schools D, amenities F.
- Pasco (suburban): math 50% / reading 52% proficiency, ranked #32 of 73 in FL (top 44%) — acceptable for families but not a draw, mixed tenant base, ~2y average lease.
- Market conditions: Rents rising (+2.0%/yr); 324 active listings in the ZIP; 1 comparable units currently listed for rent nearby; 6,765 units permitted in Pasco County in 2024 (1,250 in 5+ unit buildings).
- This rent runs 30% of the median local income ($50k/yr) — at the standard rent-burdened threshold; future hikes will face affordability resistance.
Forward outlook
- Local home prices are declining (-3.0%/yr); year-one equity from $677 of loan paydown is wiped out by about $3k of value loss. Plan a longer hold.
- Pasco County population projected at +29% by 2050 — long-run rental-demand tailwind backs the buy-and-hold thesis.
- At projected returns (-3.0% appreciation + 2.0% rent growth), your $27k cash investment doubles in ~9 years — after that, you're playing with house money.
Negotiation context
- Only 2 days on market — expect competitive offers; lowballing is unlikely to land.
- Current owner paid $19k; list at $98k implies a 415% gain — meaningful room to come down on a strong offer.
Risks & watch-outs
- Climate carrying-cost: severe wind risk, 99% chance of damaging wind over 30y; extreme-heat days projected 7→27/yr by 2055 (HVAC capex compounding) — expect insurance premiums to compound above CPI over the hold.
Questions for the listing agent
- Built in 1969 — when were the roof, HVAC, electrical panel, plumbing, and water heater last replaced?
- Is there a deadline driving the sale (1031 exchange, divorce, estate, relocation)? That informs how much negotiation room exists.
- Schools are D-rated, which usually means shorter tenancies and higher turnover. Who's the typical renter profile here, and what's been the actual vacancy rate?
- Crime grade is D in this area — have there been break-ins, vandalism, or insurance claims at this property in the last 3 years? What carrier currently insures it and at what premium?
- What's the average days-on-market for RENTAL listings here right now (not sales)? A rising rental-DOM trend means longer vacancies and softer asking-rent achievability than the comps imply.
- What's the recent tenant-quality profile in this submarket — average credit score on applications, eviction rate, late-payment / NSF rate, and stable-employment percentage? A property-management company in the area should have these aggregated.
- How much new for-sale + rental construction is in the pipeline within 1–3 miles? Heavy new supply typically softens prices + rents 12–24 months out; constrained supply supports both.
Investment metrics
- 1% rule
- 1.30% ✓
- Cap rate
- 10.71%
- Cash-on-cash
- 15.77%
- DSCR
- 1.70
- GRM
- 6.4
CMA / ARV
- ARV (on-the-fly)
- $70,080
- Comps found
- 3
Show comp detail 3 sales within ~0.75 mi
| Address | Dist | Beds/Ba | Sqft | Sold | Price | $/sf | Match |
|---|---|---|---|---|---|---|---|
| 1909 Lullaby Dr | 0.05mi | 1/1.0 | 470 (-2%) | 3mo | $68,500 | $146 | 91 |
| 2143 Orange Dr | 0.28mi | 2/1.0 (+1) | 480 (0%) | 9mo | $71,500 | $149 | 75 |
| 2110 Orange Dr | 0.23mi | 2/1.5 (+1) | 460 (-4%) | 1mo | $57,000 | $124 | 74 |
Match score weights: distance 35% · size 25% · config 20% · recency 20%. Top-matched comps best support the ARV.
Projected returns pro-forma
-3.0% appreciation · 2.05% rent growth · sell at horizon
- IRR
- 5.6%
- Equity multiple
- 1.21×
- Total profit
- $5,881
- Equity at exit
- $14,597
- IRR
- 14.1%
- Equity multiple
- 2.09×
- Total profit
- $29,822
- Equity at exit
- $8,465
Cash invested: $27,412 (down + closing). Projections, not guarantees.
Landlord ↔ Tenant lean methodology
- Overall (STATE)
- 87 Strongly Landlord-Friendly
- State Florida
- 87 Strongly Landlord-Friendly · R+3
- County
- — inherits STATE
- City
- — inherits STATE
ZIP-level market 34691
- Home prices YoY
- -23.9%
- Rents YoY
- 2.0%
- Active inventory
- 324
- Price-to-rent
- 6.4×
Monthly cashflow live
- Estimated rent
- $1,271 medium interval (Pro) →
- Mortgage (P&I)
- −$513
- Tax from tax record
- −$90 /mo · $1,077/yr
- Insurance
- −$41
- HOA
- −$0
- Vacancy / Maint / Mgmt
- −$267
- Net cashflow
- $360
Break-even live
UW: 25.0% down · 7.5% · 30yr · 1.5% tax · 5.0% vac · 8.0% maint · 8.0% mgmt
Financing live
Cash to close
- Down payment
- $24,475
- Closing costs
- $2,937
- Reserves months
- —
- Total cash needed
- —
Loan-product check · same deal, 3 products live
Conventional
25% down · 7.5% · 30yr
- Down + closing
- —
- Monthly P&I
- —
- Monthly cashflow
- —
- DSCR
- —
- Eligible?
- —
Personal DTI + credit; lowest rate.
DSCR
20% down · 8.5% · 30yr
- Down + closing
- —
- Monthly P&I
- —
- Monthly cashflow
- —
- DSCR
- —
- Eligible?
- —
No personal income docs; deal must DSCR.
Hard money
10% down · 12.0% · 12mo
- Down + closing
- —
- Monthly P&I
- —
- Monthly cashflow
- —
- DSCR
- —
- Eligible?
- —
Short-term bridge; refi at stabilization.
Rent comps 1 comps
| Address | Beds | Baths | Sqft | Rent | $/sqft | DOM | Units | Dist |
|---|---|---|---|---|---|---|---|---|
| 587 Dixie Hwy Unit Studio 1 Tarpon Springs, FL | — | 1.0 | 214 | $1,275 | $5.96 | 4d | 1 | 1.40mi |
Listing history 3 events
-
2026-06-18days on market $97,900 Active 2 DOM
-
2026-06-17remarks 381-char remark
-
2026-06-17$97,900 Active 1 DOM
ⓘ Source: listings_history table (triggers on properties + properties_extension) + one-shot
backfill from property_details.listing_events for pre-trigger history.
Tax reassessment forecast FL · Resets to sale price
- Current annual tax
- $1,077 · $90/mo
- Projected year-2 tax
- $1,077 · $90/mo
- Expected delta
- $0/yr ($0/mo · 0.0%)
ⓘ Screening estimate from a state-policy table — verify with the county assessor before closing.
Climate risk First Street
- Flood 4/10 Moderate FEMA zone X (unshaded) · 13% chance over 30 yrs
- Wildfire 2/10 Low
- Heat 10/10 Extreme 7 d/yr ≥109°F today · 27 d/yr by 30 yrs out
- Wind 10/10 Extreme 99% chance of damaging wind over 30 yrs
- Air quality 2/10 Low 1 unhealthy d/yr today · 1 by 30 yrs out
Nearby sold comps map
Loading sold comps map…
Walkable amenities ~0.75 mi
Loading nearby amenities…
Taxation est. · year 1
- Rental income
- $15,255
- − Mortgage interest
- −$5,484
- − Property taxes
- −$1,077
- − Insurance
- −$490
- − Repairs & maintenance
- −$1,220
- − Management
- −$1,220
- − Depreciation
- −$2,848
- Taxable income
- $2,916
- Est. tax owed @ 24.0%
- −$700
- After-tax cash flow
- $3,624/yr
For passive investors: Depreciation is non-cash, so a rental often shows a tax loss while cash-flowing — sheltering income. Rental losses are passive: they offset passive income freely, and up to $25,000/yr can offset ordinary (W-2) income if you actively participate and your MAGI is under $100k (phasing out to $0 by $150k); unused losses carry forward. On sale, claimed depreciation is recaptured at up to 25%, and gains may owe capital-gains tax (a 1031 exchange can defer both). Figures are a year-1 estimate at your 24.0% rate — not tax advice; consult a CPA.
Schools (NCES district)
- District
- Pasco
- NCES district ID
- 1201530
- Math proficiency
- 50% ▼ -10.00%
- Reading proficiency
- 52% ▼ -5.00%
- Median HH income
- $45,039
- Composite
- 43.14/100
- National rank
- #3074
- State rank
- #32 of 73 in FL
Livability — Holiday
- Score
- 66/100
- State rank
- #623
- US rank
- #12124
Category grades
Schools grade is shown separately in the Schools card above.
Census & demographics
- Census place
- Holiday, FL
- County
- Pasco County · 524,098 people
- City population
- 33,730
- Metro
- Tampa-St. Petersburg-Clearwater, FL
- Population (ZIP)
- 21,232
- Household income
- $50,288
- Rent vs Own
- Severe rent burden
- 1031.0
Population outlook (Pasco County) Hauer SSP2
- Today (2025)
- 570,045 people
- By 2030
- 605,844 · +6.3%
- By 2040
- 674,806 · +18.4%
- By 2050
- 736,022 · +29.1%
- By 2075
- 862,900 · +51.4%
- By 2100
- 906,364 · +59.0%
Race, ethnicity, and origin ACS 2023
- Neighborhood character
- Predominantly White (73%)
- Race & ethnicity
- White 73% Hispanic / Latino 15% Two or more races 11% Black 7% Asian 2%
- Hispanic origin (detail)
- Mexican 2% Puerto Rican 6% Cuban 2% Dominican 2%
- Common ancestry
- Romanian 3% Iranian 2% Lithuanian 2%
- Foreign-born
- 10% · Canada, Vietnam
- Languages at home
- 82% English-only · Spanish 8% Other Indo-European 5% Other Asian/Pacific 1%
Political lean MEDSL · Pasco
- 2024 margin
- Strong R (+25.2) · D 36.9% · R 62.1% · Other 1.0%
- 2008→2024 swing
- -21.6pp toward R · 2008: -3.6pp · 2024: -25.2pp
- All cycles
- 2024: R+25.2 2020: R+20.1 2016: R+21.6 2012: R+6.7 2008: R+3.6
Not yet ingested
- Civics
- —
Market trends
- HPI YoY
- ▼ -102.84%
- Current HPI
- 326.9843
- Rent YoY
- ▲ 2.05%
- Metro
- Tampa-St. Petersburg-Clearwater, FL
- State GDP YoY
- ▲ 3.28%
- F500 in state
- 36
Industry mix (Fortune 500 HQ in FL)
| Industry | F500 HQs | Revenue |
|---|---|---|
| Industrial Technology | 2 | $29B |
|
||
| Insurance | 2 | $17B |
|
||
| Retail | 1 | $60B |
|
||
| Technology Distribution | 1 | $58B |
|
||
| Homebuilding | 1 | $35B |
|
||
| Technology Manufacturing | 1 | $35B |
|
||
Price history
+415.3% since first listed2 events — show timeline
- 2026-06-17 Listed $97,900 FSBO.com
- 1983-02-01 Sold (Public Records) $19,000 Public Records
Property tax history
+8.8%/yrLatest (2025): $1,077 · +8.6% YoY. Source: county tax records.
Cash-flow waterfall
monthlySold comps — $/sqft
last 12 mo · ≤1 miLoading sold comps…