 🏷️ Likely Rental
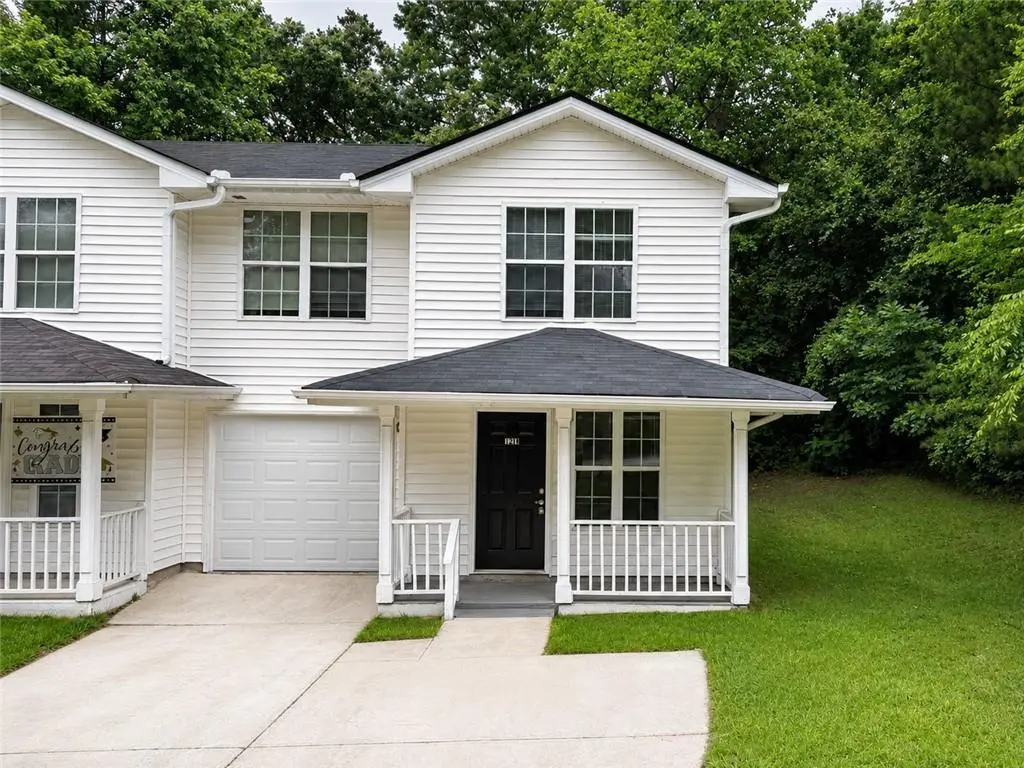
1240 Pinedale Cir NW · Conyers, GA
Flood risk 1/10 · Minimal
- FEMA flood zone
- X (unshaded)
- Chance of flooding over 30 yrs
- 0.0%
- Est. flood insurance / yr
- $507 – $1,088
Fire risk 3/10 · Minor
- Est. fire insurance / yr
- $963 – $1,789
Heat risk 6/10 · Moderate
- Hot days now (above 105°F)
- 7 days/yr
- Hot days in 30 yrs
- 18 days/yr
Wind risk 6/10 · Moderate
- Chance of severe wind over 30 yrs
- 27.0%
Air-quality risk 5/10 · Moderate
- Unhealthy air days now
- 6 days/yr
- Unhealthy air days in 30 yrs
- 8 days/yr
Risk factors via First Street. Map © Google.
Why this score? — see what drove the D grade
The composite is a weighted blend of 9 inputs, each scored 0–100. Each bar is that input's sub-score; the figure is the points it added to the 100-point composite (weight × sub-score).
- Cash flow +15.0/30.0
- ARV discount +7.5/15.0
- 1% rule +5.0/10.0
- DSCR +5.0/10.0
- Livability +3.4/5.0
- Rent growth +2.6/5.0
- Condition / age +2.5/5.0
- Schools +1.9/10.0
- Appreciation +0.0/10.0
$1,795
🖨 Deal sheet 📄 Offer letter ✓ Due diligence
Listing remarks MLS
Spacious 2-story townhouse featuring 3 bedrooms and 2.5 bathrooms with a welcoming front porch and an attached 1-car garage. Enjoy outdoor living on the wood deck, perfect for relaxing or entertaining. A functional layout offers comfortable everyday living with great potential. One or more photos have been virtually staged.
Key facts
- Private deck
- Attached garage
- Peaceful community
Tags
Property features AI
Exterior
- Parking: Attached garage (1 car)
- Utilities: Public water; Public sewer; Electricity available; Sewer available; Water available
- Home design: Two-level home; Fee simple ownership; Resale property; Slab foundation; Facing/direction not specified
- Construction: Vinyl siding exterior; Composition roof
- Exterior features: Front yard fencing; Deck
Interior
- Kitchen: Eat-in kitchen; Dishwasher; Refrigerator
- Bedrooms: Three upstairs bedrooms; No special bedroom features listed
- Flooring: Vinyl flooring
- Bathrooms: Two full bathrooms; One half bathroom (main level)
- Heating & cooling: Central heating; Central air conditioning
- Interior features: Other interior features; 1 common wall
- Laundry & utility: Laundry features: Other
Neighborhood map
What this means for you Summary
Snapshot
- This is a 3-bed/2.5-bath single-family listed at $2k.
Deal economics
- At list price, monthly cash flow is $1k ($15k/yr) — positive.
- The deal already cash-flows at list — no discount required.
- Meets the 1% rule at list price ($2k rent vs $2k).
- Recommended offer: $2k (1.5% below list) — sets the bar for market timing.
- Cap rate 857.1% vs local median 4.4% in Conyers — top-decile yield for the area; either an underpriced asset or a hidden risk that comps aren't pricing in. Stress-test before assuming the spread holds.
Location & tenants
- Location reads 67/100 on livability (#167 in GA) — a middle-class / working-renter tenant base. Strengths: cost of living A+, housing A+; Watch: crime D, amenities D, commute F.
- Rockdale County (suburban): math 14% / reading 29% proficiency, ranked #136 of 174 in GA (top 78%) — low school quality limits family demand, transient renter base, plan for 1-2y turnover.
- Zoned schools: Shoal Creek Elementary School (math 17% / reading 22%, grade F, #878 of 1,228 statewide, top 75%, 674 students, 75% FRL); Conyers Middle School (math 9% / reading 24%, grade F, #388 of 470 statewide, top 83%, 1,031 students, 78% FRL); Rockdale County High School (math 12% / reading 17%, grade F, #315 of 424 statewide, top 76%, 2,369 students, 64% FRL).
- Market conditions: Rents flat; 278 active listings in the ZIP; 23 comparable units currently listed for rent nearby; rentals at typical pace (median 22d on market — plan ~3-4 weeks tenant-placement turnaround); 483 units permitted in Rockdale County in 2024 (0 in 5+ unit buildings).
Forward outlook
- Local home prices are declining (-3.0%/yr); year-one equity from $12 of loan paydown is wiped out by about $54 of value loss. Plan a longer hold.
- Rockdale County population projected at +29% by 2050 — long-run rental-demand tailwind backs the buy-and-hold thesis.
- At projected returns (-3.0% appreciation + 0.4% rent growth), your $503 cash investment doubles in ~1 year — after that, you're playing with house money.
Negotiation context
- It's been on market 16 days — a 2% lower offer ($2k) is reasonable based on typical stale-listing flexibility.
- 9 sale attempts since 10y ago with the ask held roughly flat each time — persistent listings suggest the price (not the market) is what's stuck; bring a comps-based counter.
Risks & watch-outs
- Climate carrying-cost: major wind risk, 27% chance of damaging wind over 30y; extreme-heat days projected 7→18/yr by 2055 (HVAC capex compounding) — expect insurance premiums to compound above CPI over the hold.
Questions for the listing agent
- Is there a deadline driving the sale (1031 exchange, divorce, estate, relocation)? That informs how much negotiation room exists.
- Schools are D-rated, which usually means shorter tenancies and higher turnover. Who's the typical renter profile here, and what's been the actual vacancy rate?
- Crime grade is D in this area — have there been break-ins, vandalism, or insurance claims at this property in the last 3 years? What carrier currently insures it and at what premium?
- The area grade is low — what's the realistic commute time and amenity access for the typical tenant pool here? Any planned neighborhood developments (good or bad) we should know about?
- What's the average days-on-market for RENTAL listings here right now (not sales)? A rising rental-DOM trend means longer vacancies and softer asking-rent achievability than the comps imply.
- What's the recent tenant-quality profile in this submarket — average credit score on applications, eviction rate, late-payment / NSF rate, and stable-employment percentage? A property-management company in the area should have these aggregated.
- How much new for-sale + rental construction is in the pipeline within 1–3 miles? Heavy new supply typically softens prices + rents 12–24 months out; constrained supply supports both.
Investment metrics
- 1% rule
- 90.62% ✓
- Cap rate
- 857.06%
- Cash-on-cash
- 3038.46%
- DSCR
- 136.19
- GRM
- 0.1
CMA / ARV
- ARV (on-the-fly)
- $203,896
- Comps found
- 12
Show comp detail 12 sales within ~0.75 mi
| Address | Dist | Beds/Ba | Sqft | Sold | Price | $/sf | Match |
|---|---|---|---|---|---|---|---|
| 1071 Mountain View Rd NW | 0.25mi | 3/1.0 | 1,335 (+1%) | 2mo | $188,000 | $141 | 80 |
| 1621 Wesley Way NW | 0.35mi | 3/2.0 | 1,336 (+1%) | 3mo | $195,000 | $146 | 78 |
| 1611 Wesley Way | 0.34mi | 3/2.0 | 1,300 (-2%) | 4mo | $196,000 | $151 | 76 |
| 1082 Green Valley Dr NW | 0.36mi | 3/2.0 | 1,352 (+2%) | 11mo | $220,000 | $163 | 69 |
| 1755 Rockbridge Rd NW | 0.53mi | 3/2.0 | 1,308 (-1%) | 9mo | $234,000 | $179 | 64 |
| 1098 Laurel Ln NW | 0.41mi | 4/2.0 (+1) | 1,352 (+2%) | 8mo | $190,000 | $141 | 63 |
| 1792 Wesley Way | 0.65mi | 3/2.0 | 1,239 (-6%) | 0mo | $249,000 | $201 | 57 |
| 897 Sigman Rd NW | 0.66mi | 4/2.0 (+1) | 1,344 (+2%) | 7mo | $224,999 | $167 | 54 |
| 1342 Peggy Ln NW | 0.72mi | 3/2.0 | 1,352 (+2%) | 10mo | $185,000 | $137 | 52 |
| 1851 Irwin Bridge Rd NW | 0.60mi | 3/2.0 | 1,248 (-6%) | 11mo | $165,500 | $133 | 51 |
| 1791 Crestridge Cir NW | 0.71mi | 3/2.0 | 1,443 (+9%) | 3mo | $249,900 | $173 | 48 |
| 1347 Peggy Ln NW | 0.73mi | 4/1.5 (+1) | 1,352 (+2%) | 9mo | $208,500 | $154 | 46 |
Match score weights: distance 35% · size 25% · config 20% · recency 20%. Top-matched comps best support the ARV.
Projected returns pro-forma
-3.0% appreciation · 0.39% rent growth · sell at horizon
- IRR
- —
- Equity multiple
- 153.45×
- Total profit
- $76,624
- Equity at exit
- $268
- IRR
- —
- Equity multiple
- 309.35×
- Total profit
- $154,978
- Equity at exit
- $155
Cash invested: $503 (down + closing). Projections, not guarantees.
Landlord ↔ Tenant lean methodology
- Overall (STATE)
- 90 Strongly Landlord-Friendly
- State Georgia
- 90 Strongly Landlord-Friendly · R+3
- County
- — inherits STATE
- City
- — inherits STATE
ZIP-level market 30012
- Rents YoY
- 0.4%
- Active inventory
- 278
- Price-to-rent
- 0.1×
Monthly cashflow live
- Estimated rent
- $1,627 high interval (Pro) →
- Mortgage (P&I)
- −$9
- Tax est. 1.5%
- −$2 /mo · $27/yr
- Insurance
- −$1
- HOA
- −$0
- Vacancy / Maint / Mgmt
- −$342
- Net cashflow
- $1,273
Break-even live
UW: 25.0% down · 7.5% · 30yr · 1.5% tax · 5.0% vac · 8.0% maint · 8.0% mgmt
Financing live
Cash to close
- Down payment
- $449
- Closing costs
- $54
- Reserves months
- —
- Total cash needed
- —
Loan-product check · same deal, 3 products live
Conventional
25% down · 7.5% · 30yr
- Down + closing
- —
- Monthly P&I
- —
- Monthly cashflow
- —
- DSCR
- —
- Eligible?
- —
Personal DTI + credit; lowest rate.
DSCR
20% down · 8.5% · 30yr
- Down + closing
- —
- Monthly P&I
- —
- Monthly cashflow
- —
- DSCR
- —
- Eligible?
- —
No personal income docs; deal must DSCR.
Hard money
10% down · 12.0% · 12mo
- Down + closing
- —
- Monthly P&I
- —
- Monthly cashflow
- —
- DSCR
- —
- Eligible?
- —
Short-term bridge; refi at stabilization.
Rent comps 23 comps
| Address | Beds | Baths | Sqft | Rent | $/sqft | DOM | Units | Dist |
|---|---|---|---|---|---|---|---|---|
| 1240 Pinedale Cir NW Conyers, GA | 3.0 | 2.5 | 1324 | $1,900 | $1.44 | 24d | 1 | 0.03mi |
| 1653 Pinedale Cir NW Conyers, GA | 2.0 | 1.5 | 1160 | $1,350 | $1.16 | 43d | 1 | 0.07mi |
| 1214 Pinedale Cir NW Conyers, GA | 3.0 | 2.5 | 1324 | $1,475 | $1.11 | 43d | 1 | 0.08mi |
| 1158 Pinedale Cir NW Conyers, GA | 2.0 | 1.0 | 1002 | $1,350 | $1.35 | 3d | 1 | 0.12mi |
| 1459 Forest Villa Dr NW Conyers, GA | 3.0 | 1.5 | 1160 | $1,500 | $1.29 | 1d | 1 | 0.20mi |
| 1443 Forest Villa Dr NW Conyers, GA | 3.0 | 2.0 | 1264 | $1,499 | $1.19 | 43d | 1 | 0.25mi |
| 1427 Villa Pines Ct NW Conyers, GA | 2.0 | 1.5 | 1350 | $1,450 | $1.07 | 18d | 1 | 0.28mi |
| 1190 Millcrest Walk NW Conyers, GA | 2.0 | 1.0–2.0 | 1035 | $1,299 | $1.26 | 3d | 18 | 0.36mi |
| 1289 Knoll Ct NW Conyers, GA | 2.0 | 2.0 | 1200 | $1,245 | $1.04 | 43d | 1 | 0.59mi |
| 1107 Windgate Cir NW Conyers, GA | 2.0 | 2.5 | 1200 | $1,570 | $1.31 | 21d | 1 | 0.69mi |
| 1322 S Hicks Cir NW Conyers, GA | 3.0 | 2.0 | 1250 | $2,000 | $1.60 | 4d | 1 | 0.73mi |
| 1219 Lakeview Dr NW Conyers, GA | 2.0 | 1.0 | 900 | $1,000 | $1.11 | 43d | 1 | 0.75mi |
| 1759 Stag Dr NW Conyers, GA | 3.0 | 2.0 | 1215 | $1,811 | $1.49 | 21d | 1 | 0.98mi |
| 1015 Rosser St NW Unit 4A Conyers, GA | 2.0 | 1.0 | 1000 | $1,199 | $1.20 | 2d | 1 | 1.02mi |
| 1175 Milstead Ave NE Conyers, GA | 3.0 | 2.0 | 1406 | $1,541 | $1.10 | 4d | 1 | 1.02mi |
| 2059 Appaloosa Way Conyers, GA | 3.0 | 3.0 | 1556 | $2,055 | $1.32 | 43d | 1 | 1.14mi |
| 1011 Peek St NW Conyers, GA | 2.0 | 1.0 | 1609 | $1,400 | $0.87 | 18d | 1 | 1.15mi |
| 2032 Appaloosa Way Conyers, GA | 3.0 | 2.5 | 1561 | $1,955 | $1.25 | 4d | 1 | 1.17mi |
| 2050 Appaloosa Way Conyers, GA | 3.0 | 3.0 | 1556 | $2,105 | $1.35 | 43d | 1 | 1.17mi |
| 1075 Eastview Rd NE Unit A Conyers, GA | 2.0 | 1.0 | 1018 | $1,250 | $1.23 | 43d | 1 | 1.19mi |
| 1031 Barn Oak Ct NE Conyers, GA | 2.0 | 1.0 | 961 | $1,295 | $1.35 | 43d | 1 | 1.22mi |
| 811 Sage Ln NW Conyers, GA | 3.0 | 2.0 | 1400 | $1,761 | $1.26 | 4d | 1 | 1.41mi |
| 1055 Pine St NE Conyers, GA | 2.0 | 2.0 | 1184 | $1,300 | $1.10 | 12d | 1 | 1.50mi |
Listing history 11 events
-
2026-06-18days on market $1,795 Active 16 DOM
-
2026-06-17days on market $1,795 Active 15 DOM
-
2026-06-16days on market $1,795 Active 14 DOM
-
2026-06-15days on market $1,795 Active 13 DOM
-
2026-06-13days on market $1,795 Active 11 DOM
-
2026-06-09days on market $1,795 Active 7 DOM
-
2026-06-08days on market $1,795 Active 6 DOM
-
2026-06-07days on market $1,795 Active 5 DOM
-
2026-06-04days on market $1,795 Active 2 DOM
-
2026-06-02remarks 589-char remark
-
2026-06-02$1,795 Active 1 DOM
ⓘ Source: listings_history table (triggers on properties + properties_extension) + one-shot
backfill from property_details.listing_events for pre-trigger history.
Climate risk First Street
- Flood 1/10 Low FEMA zone X (unshaded) · 0% chance over 30 yrs
- Wildfire 3/10 Moderate
- Heat 6/10 Major 7 d/yr ≥105°F today · 18 d/yr by 30 yrs out
- Wind 6/10 Major 27% chance of damaging wind over 30 yrs
- Air quality 5/10 Major 6 unhealthy d/yr today · 8 by 30 yrs out
Nearby sold comps map
Loading sold comps map…
Walkable amenities ~0.75 mi
Loading nearby amenities…
Taxation est. · year 1
- Rental income
- $19,519
- − Mortgage interest
- −$101
- − Property taxes
- −$27
- − Insurance
- −$9
- − Repairs & maintenance
- −$1,562
- − Management
- −$1,562
- − Depreciation
- −$52
- Taxable income
- $16,207
- Est. tax owed @ 24.0%
- −$3,890
- After-tax cash flow
- $11,382/yr
For passive investors: Depreciation is non-cash, so a rental often shows a tax loss while cash-flowing — sheltering income. Rental losses are passive: they offset passive income freely, and up to $25,000/yr can offset ordinary (W-2) income if you actively participate and your MAGI is under $100k (phasing out to $0 by $150k); unused losses carry forward. On sale, claimed depreciation is recaptured at up to 25%, and gains may owe capital-gains tax (a 1031 exchange can defer both). Figures are a year-1 estimate at your 24.0% rate — not tax advice; consult a CPA.
Schools (NCES district)
- District
- Rockdale County
- NCES district ID
- 1304410
- Math proficiency
- 14% ▼ -17.00%
- Reading proficiency
- 29% ▼ -11.00%
- Median HH income
- $53,325
- Composite
- 19.42/100
- National rank
- #8776
- State rank
- #136 of 174 in GA
Livability — Conyers
- Score
- 67/100
- State rank
- #167
- US rank
- #10533
Category grades
Schools grade is shown separately in the Schools card above.
Census & demographics
- Census place
- Conyers, GA
- County
- Rockdale County · 96,534 people
- Metro
- Atlanta-Sandy Springs-Alpharetta, GA
- Population (ZIP)
- 34,506
- Household income
- $66,153
- Rent vs Own
- Severe rent burden
- 986.0
Population outlook (Rockdale County) Hauer SSP2
- Today (2025)
- 99,145 people
- By 2030
- 104,558 · +5.5%
- By 2040
- 116,100 · +17.1%
- By 2050
- 127,827 · +28.9%
- By 2075
- 159,113 · +60.5%
- By 2100
- 181,178 · +82.7%
Race, ethnicity, and origin ACS 2023
- Neighborhood character
- Diverse neighborhood (Simpson 0.65)
- Race & ethnicity
- Black 49% White 27% Hispanic / Latino 18% Two or more races 8% Asian 1%
- Hispanic origin (detail)
- Mexican 15%
- Common ancestry
- Hispanic 1% Lithuanian 1% Italian 1%
- Foreign-born
- 14% · Canada, South Korea
- Languages at home
- 81% English-only · Spanish 16% French/Haitian/Cajun 2% Korean 1%
Political lean MEDSL · Rockdale
- 2024 margin
- Solid D (+47.5) · D 73.4% · R 25.9%
- 2008→2024 swing
- +37.9pp toward D · 2008: 9.6pp · 2024: 47.5pp
- All cycles
- 2024: D+47.5 2020: D+40.8 2016: D+25.9 2012: D+16.4 2008: D+9.6
Not yet ingested
- Civics
- —
Market trends
- HPI YoY
- ▼ -123.61%
- Current HPI
- 226.9588
- Rent YoY
- ▲ 0.39%
- Metro
- Atlanta-Sandy Springs-Alpharetta, GA
- State GDP YoY
- ▲ 2.66%
- F500 in state
- 28
Industry mix (Fortune 500 HQ in GA)
| Industry | F500 HQs | Revenue |
|---|---|---|
| Paper / Packaging | 2 | $29B |
|
||
| Retail | 1 | $160B |
|
||
| Transportation / Logistics | 1 | $91B |
|
||
| Airlines | 1 | $62B |
|
||
| Consumer Goods | 1 | $47B |
|
||
| Utilities | 1 | $25B |
|
||
Price history
-98.6% since first listed24 events — show timeline
- 2026-06-02 Listed $1,795 FMLS
- 2026-05-28 Rental Removed $1,900 GAMLS
- 2026-05-09 Listed for Rent $1,900 GAMLS
- 2026-04-09 Sold (MLS) $169,000 GAMLS
- 2026-04-09 Sold (MLS) $169,000 FMLS
- 2026-04-08 Sold (Public Records) $169,000 Public Records
- 2026-03-20 Pending — GAMLS
- 2026-03-20 Pending — FMLS
- 2026-03-05 Relisted — GAMLS
- 2026-03-03 Relisted — FMLS
- 2026-02-12 Pending — GAMLS
- 2026-02-12 Pending — FMLS
- 2026-02-05 Price Changed $169,900 FMLS
- 2026-02-05 Price Changed $169,900 GAMLS
- 2026-02-03 Relisted — GAMLS
- 2026-02-03 Relisted — FMLS
- 2026-01-28 Pending — GAMLS
- 2026-01-28 Pending — FMLS
- 2026-01-15 Listed $175,000 GAMLS
- 2026-01-15 Listed $175,000 FMLS
- 2021-10-26 Sold (Public Records) $200,000 Public Records
- 2020-12-01 Sold (Public Records) $68,200 Public Records
- 2016-10-01 Listing Removed — GAMLS
- 2016-04-09 Listed $126,500 GAMLS
Property tax history
+6.0%/yrLatest (2025): $4,694 · +2.8% YoY. Source: county tax records.
Cash-flow waterfall
monthlySold comps — $/sqft
last 12 mo · ≤1 miLoading sold comps…