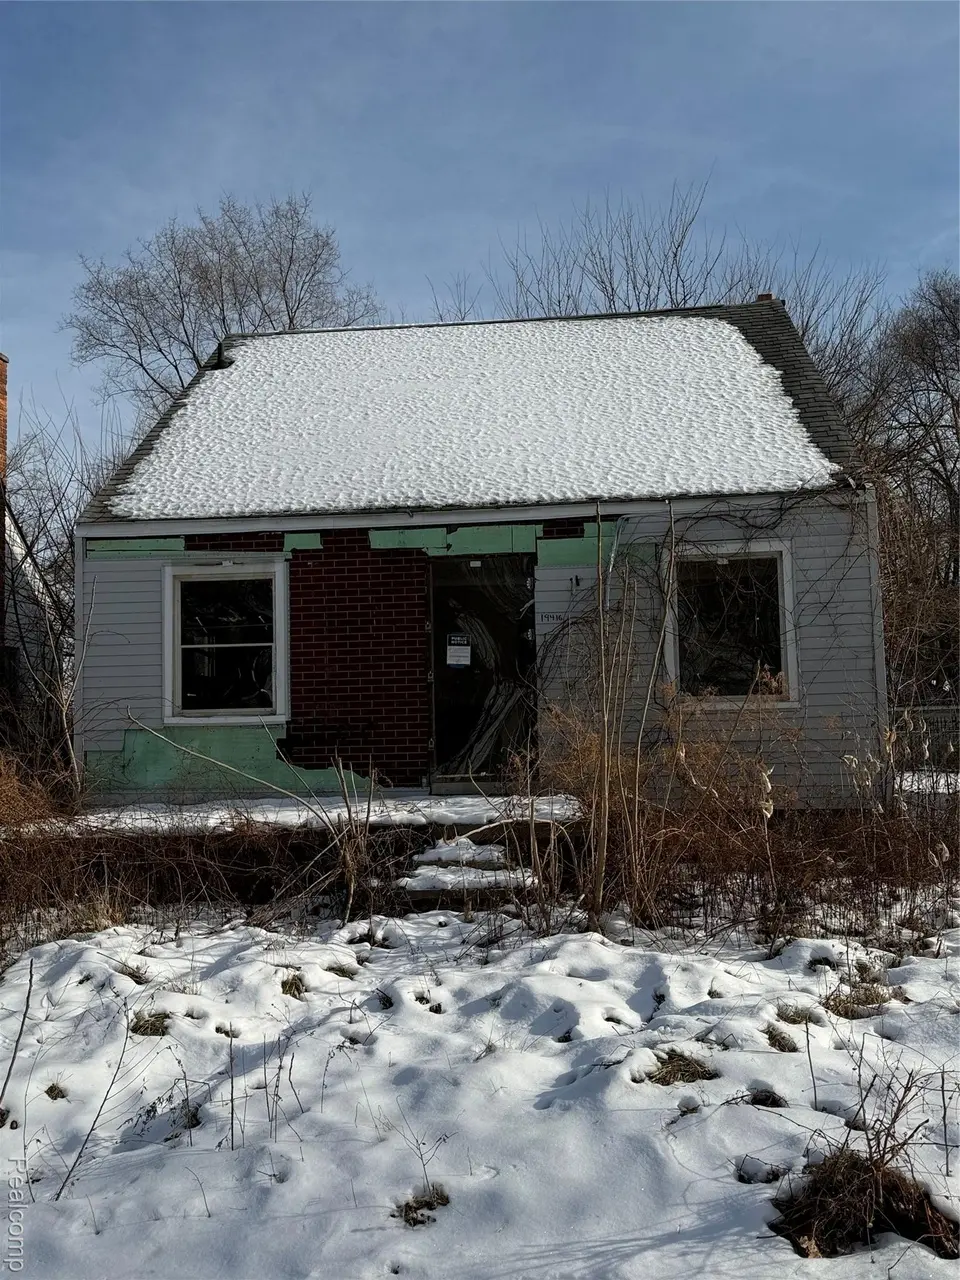
19416 Lamont St · Detroit, MI
Flood risk 1/10 · Minimal
- FEMA flood zone
- X (unshaded)
- Chance of flooding over 30 yrs
- 0.0%
- Est. flood insurance / yr
- $473 – $860
Fire risk 1/10 · Minimal
- Est. fire insurance / yr
- $784 – $1,456
Heat risk 3/10 · Minor
- Hot days now (above 97°F)
- 7 days/yr
- Hot days in 30 yrs
- 14 days/yr
Wind risk 2/10 · Minimal
- Chance of severe wind over 30 yrs
- —
Air-quality risk 4/10 · Minor
- Unhealthy air days now
- 4 days/yr
- Unhealthy air days in 30 yrs
- 6 days/yr
Risk factors via First Street. Map © Google.
Why this score? — see what drove the D grade
The composite is a weighted blend of 9 inputs, each scored 0–100. Each bar is that input's sub-score; the figure is the points it added to the 100-point composite (weight × sub-score).
- Cash flow +15.0/30.0
- ARV discount +7.5/15.0
- 1% rule +5.0/10.0
- DSCR +5.0/10.0
- Rent growth +4.2/5.0
- Livability +3.7/5.0
- Condition / age +2.5/5.0
- Schools +1.3/10.0
- Appreciation +0.0/10.0
$15,500
🖨 Deal sheet 📄 Offer letter ✓ Due diligence
Listing remarks MLS
Perfect for investors. DLBA-owned 3-bedroom, 1.5-bath residential property located in the Farwell neighborhood. Sale is subject to approval by the Detroit Land Bank Authority (DLBA) and execution of a DLBA Renovation/Development Agreement. Purchaser must submit a complete proposal to DLBA, including intended use and renovation timeline, proof of funds, scope of work with cost breakdown, and documentation of prior renovation projects (addresses and photos). The DLBA recommends reviewing all applicable Neighborhood Framework Plans through the City of Detroit Planning and Development Department for additional neighborhood context. DLBA retains the right to tax recapture for five (5) years following transfer of ownership. This may be incompatible with certain tax abatements or lot combinations. Waiver requests will be reviewed on a case-by-case basis and may require payment in lieu of taxes, subject to review of development pro forma and financing.
Key facts
- 3,920 sq ft lot
- Built 1947
- Listed 153 days
Neighborhood map
What this means for you Summary
Snapshot
- This is a 3-bed/1.0-bath single-family listed at $16k.
Deal economics
- At list price, monthly cash flow is $854 ($10k/yr) — positive.
- The deal already cash-flows at list — no discount required.
- Meets the 1% rule at list price ($1k rent vs $16k).
- Recommended offer: $14k (12.0% below list) — sets the bar for market timing.
- Cap rate 72.4% vs local median 10.2% in Detroit — top-decile yield for the area; either an underpriced asset or a hidden risk that comps aren't pricing in. Stress-test before assuming the spread holds.
Location & tenants
- Location reads 73/100 on livability (#218 in MI) — a middle-class / working-renter tenant base. Strengths: amenities A+, commute A+, cost of living A+; Watch: schools F, crime F, employment F.
- Detroit Public Schools Community District (urban): math 10% / reading 24% proficiency, ranked #499 of 540 in MI (top 92%) — low school quality limits family demand, transient renter base, plan for 1-2y turnover; 90% free/reduced lunch — lower-income household profile, screen leases tightly.
- Market conditions: Rents rising fast (+6.7%/yr); 226 active listings in the ZIP; 3 comparable units currently listed for rent nearby; rentals at typical pace (median 24d on market — plan ~3-4 weeks tenant-placement turnaround); lower-income renter base — watch delinquency; 2,639 units permitted in Wayne County in 2024 (1,216 in 5+ unit buildings).
- This rent runs 43% of the median local income ($35k/yr) — at the standard rent-burdened threshold; future hikes will face affordability resistance.
Forward outlook
- Local home prices are declining (-3.0%/yr); year-one equity from $107 of loan paydown is wiped out by about $465 of value loss. Plan a longer hold.
- Wayne County population projected at -17% by 2050 — secular population decline; favor cash flow + early exit over multi-decade hold.
- At projected returns (-3.0% appreciation + 6.7% rent growth), your $4k cash investment doubles in ~1 year — after that, you're playing with house money.
Negotiation context
- It's been on market 153 days — a 12% lower offer ($14k) is reasonable based on typical stale-listing flexibility.
- 4 sale attempts since 15y ago with the ask held roughly flat each time — persistent listings suggest the price (not the market) is what's stuck; bring a comps-based counter.
Risks & watch-outs
- Watch-outs: property tax is 3.8% of price; built in 1947 — expect roof / HVAC / electrical / plumbing capex.
Questions for the listing agent
- It's been on market 153 days. Have you received any prior offers? Is the seller open to a 12% concession, seller financing, or rate buy-down credit?
- Built in 1947 — when were the roof, HVAC, electrical panel, plumbing, and water heater last replaced?
- Property tax is high relative to price — has the assessment been appealed recently, and will the sale trigger a re-assessment?
- Why hasn't it sold? Are there any deal-killer items the seller is aware of (foundation, flood, title, zoning, code violations)?
- Is there a deadline driving the sale (1031 exchange, divorce, estate, relocation)? That informs how much negotiation room exists.
- Schools are F-rated, which usually means shorter tenancies and higher turnover. Who's the typical renter profile here, and what's been the actual vacancy rate?
- Crime grade is F in this area — have there been break-ins, vandalism, or insurance claims at this property in the last 3 years? What carrier currently insures it and at what premium?
- The area grade is low — what's the realistic commute time and amenity access for the typical tenant pool here? Any planned neighborhood developments (good or bad) we should know about?
- What's the average days-on-market for RENTAL listings here right now (not sales)? A rising rental-DOM trend means longer vacancies and softer asking-rent achievability than the comps imply.
- What's the recent tenant-quality profile in this submarket — average credit score on applications, eviction rate, late-payment / NSF rate, and stable-employment percentage? A property-management company in the area should have these aggregated.
- How much new for-sale + rental construction is in the pipeline within 1–3 miles? Heavy new supply typically softens prices + rents 12–24 months out; constrained supply supports both.
Investment metrics
- 1% rule
- 8.09% ✓
- Cap rate
- 72.41%
- Cash-on-cash
- 236.14%
- DSCR
- 11.51
- GRM
- 1.0
CMA / ARV
- ARV (median comp)
- $65,904
- List price
- $15,500
- Delta
- -76.48%
- Verdict
- UNDERPRICED
- Comps
- 20 within 1.0 mi
Show comp detail 12 sales within ~0.75 mi
| Address | Dist | Beds/Ba | Sqft | Sold | Price | $/sf | Match |
|---|---|---|---|---|---|---|---|
| 19676 Conley St | 0.18mi | 2/1.0 (-1) | 720 (-1%) | 9mo | $50,000 | $69 | 78 |
| 19667 Sunset St | 0.36mi | 3/1.5 | 752 (+4%) | 4mo | $28,500 | $38 | 72 |
| 19436 Albany St | 0.51mi | 3/1.0 | 725 (0%) | 6mo | $17,000 | $23 | 71 |
| 19200 Shields St | 0.32mi | 3/1.0 | 742 (+2%) | 15mo | $64,500 | $87 | 69 |
| 20203 Moenart St | 0.51mi | 2/1.0 (-1) | 725 (0%) | 3mo | $48,000 | $66 | 69 |
| 19255 Binder St | 0.52mi | 2/1.0 (-1) | 719 (-1%) | 3mo | $38,500 | $54 | 67 |
| 19942 Binder St | 0.55mi | 3/1.0 | 696 (-4%) | 5mo | $70,000 | $101 | 64 |
| 19612 Dwyer St | 0.69mi | 2/1.0 (-1) | 740 (+2%) | 2mo | $50,000 | $68 | 58 |
| 19600 Syracuse St | 0.46mi | 3/1.0 | 797 (+10%) | 10mo | $18,500 | $23 | 54 |
| 20270 Dean Ave | 0.65mi | 3/1.0 | 792 (+9%) | 7mo | $55,000 | $69 | 48 |
| 19300 Binder St | 0.49mi | 2/1.0 (-1) | 820 (+13%) | 4mo | $10,000 | $12 | 47 |
| 18640 Wexford St | 0.72mi | 2/1.0 (-1) | 798 (+10%) | 19mo | $36,000 | $45 | 29 |
Match score weights: distance 35% · size 25% · config 20% · recency 20%. Top-matched comps best support the ARV.
Projected returns pro-forma
-3.0% appreciation · 6.72% rent growth · sell at horizon
- IRR
- —
- Equity multiple
- 14.08×
- Total profit
- $56,787
- Equity at exit
- $2,311
- IRR
- —
- Equity multiple
- 33.54×
- Total profit
- $141,204
- Equity at exit
- $1,340
Cash invested: $4,340 (down + closing). Projections, not guarantees.
Landlord ↔ Tenant lean methodology
- Overall (STATE)
- 62 Landlord-Friendly
- State Michigan
- 62 Landlord-Friendly · EVEN
- County
- — inherits STATE
- City
- — inherits STATE
ZIP-level market 48234
- Home prices YoY
- -11.9%
- Rents YoY
- 6.7%
- Active inventory
- 226
- Price-to-rent
- 1.0×
Monthly cashflow live
- Estimated rent
- $1,254 medium interval (Pro) →
- Mortgage (P&I)
- −$81
- Tax from tax record
- −$49 /mo · $582/yr
- Insurance
- −$6
- HOA
- −$0
- Vacancy / Maint / Mgmt
- −$263
- Net cashflow
- $854
Break-even live
UW: 25.0% down · 7.5% · 30yr · 1.5% tax · 5.0% vac · 8.0% maint · 8.0% mgmt
Financing live
Cash to close
- Down payment
- $3,875
- Closing costs
- $465
- Reserves months
- —
- Total cash needed
- —
Loan-product check · same deal, 3 products live
Conventional
25% down · 7.5% · 30yr
- Down + closing
- —
- Monthly P&I
- —
- Monthly cashflow
- —
- DSCR
- —
- Eligible?
- —
Personal DTI + credit; lowest rate.
DSCR
20% down · 8.5% · 30yr
- Down + closing
- —
- Monthly P&I
- —
- Monthly cashflow
- —
- DSCR
- —
- Eligible?
- —
No personal income docs; deal must DSCR.
Hard money
10% down · 12.0% · 12mo
- Down + closing
- —
- Monthly P&I
- —
- Monthly cashflow
- —
- DSCR
- —
- Eligible?
- —
Short-term bridge; refi at stabilization.
Rent comps 3 comps
| Address | Beds | Baths | Sqft | Rent | $/sqft | DOM | Units | Dist |
|---|---|---|---|---|---|---|---|---|
| 18662 Sunset St Detroit, MI | 2.0 | 1.0 | 726 | $1,250 | $1.72 | 17d | 1 | 0.59mi |
| 18475 Wexford St Unit 1 Detroit, MI | 2.0 | 1.0 | 500 | $950 | $1.90 | 24d | 1 | 0.85mi |
| 21155 Warner Ave Warren, MI | 2.0 | 1.0 | 756 | $1,029 | $1.36 | 24d | 1 | 1.43mi |
Listing history 6 events
-
2025-12-24$15,500 Active 959-char remark
Show marketing remark (958 chars)
Perfect for investors. DLBA-owned 3-bedroom, 1.5-bath residential property located in the Farwell neighborhood. Sale is subject to approval by the Detroit Land Bank Authority (DLBA) and execution of a DLBA Renovation/Development Agreement. Purchaser must submit a complete proposal to DLBA, including intended use and renovation timeline, proof of funds, scope of work with cost breakdown, and documentation of prior renovation projects (addresses and photos). The DLBA recommends reviewing all applicable Neighborhood Framework Plans through the City of Detroit Planning and Development Department for additional neighborhood context. DLBA retains the right to tax recapture for five (5) years following transfer of ownership. This may be incompatible with certain tax abatements or lot combinations. Waiver requests will be reviewed on a case-by-case basis and may require payment in lieu of taxes, subject to review of development pro forma and financing.
-
2025-12-24$15,500 Active 958-char remark
Show marketing remark (958 chars)
Perfect for investors. DLBA-owned 3-bedroom, 1.5-bath residential property located in the Farwell neighborhood. Sale is subject to approval by the Detroit Land Bank Authority (DLBA) and execution of a DLBA Renovation/Development Agreement. Purchaser must submit a complete proposal to DLBA, including intended use and renovation timeline, proof of funds, scope of work with cost breakdown, and documentation of prior renovation projects (addresses and photos). The DLBA recommends reviewing all applicable Neighborhood Framework Plans through the City of Detroit Planning and Development Department for additional neighborhood context. DLBA retains the right to tax recapture for five (5) years following transfer of ownership. This may be incompatible with certain tax abatements or lot combinations. Waiver requests will be reviewed on a case-by-case basis and may require payment in lieu of taxes, subject to review of development pro forma and financing.
-
2011-09-29historical
-
2011-09-29historical
-
2011-06-29$5,000
-
2011-06-29$5,000
ⓘ Source: listings_history table (triggers on properties + properties_extension) + one-shot
backfill from property_details.listing_events for pre-trigger history.
Tax reassessment forecast MI · Partial reset (capped growth)
- Current annual tax
- $582 · $49/mo
- Projected year-2 tax
- $582 · $49/mo
- Expected delta
- $0/yr ($0/mo · 0.0%)
ⓘ Screening estimate from a state-policy table — verify with the county assessor before closing.
Climate risk First Street
- Flood 1/10 Low FEMA zone X (unshaded) · 0% chance over 30 yrs
- Wildfire 1/10 Low
- Heat 3/10 Moderate 7 d/yr ≥97°F today · 14 d/yr by 30 yrs out
- Wind 2/10 Low
- Air quality 4/10 Moderate 4 unhealthy d/yr today · 6 by 30 yrs out
Nearby sold comps map
Loading sold comps map…
Walkable amenities ~0.75 mi
Loading nearby amenities…
Taxation est. · year 1
- Rental income
- $15,043
- − Mortgage interest
- −$868
- − Property taxes
- −$582
- − Insurance
- −$78
- − Repairs & maintenance
- −$1,203
- − Management
- −$1,203
- − Depreciation
- −$451
- Taxable income
- $10,657
- Est. tax owed @ 24.0%
- −$2,558
- After-tax cash flow
- $7,691/yr
For passive investors: Depreciation is non-cash, so a rental often shows a tax loss while cash-flowing — sheltering income. Rental losses are passive: they offset passive income freely, and up to $25,000/yr can offset ordinary (W-2) income if you actively participate and your MAGI is under $100k (phasing out to $0 by $150k); unused losses carry forward. On sale, claimed depreciation is recaptured at up to 25%, and gains may owe capital-gains tax (a 1031 exchange can defer both). Figures are a year-1 estimate at your 24.0% rate — not tax advice; consult a CPA.
Schools (NCES district)
- District
- Detroit Public Schools Community District
- NCES district ID
- 2601103
- Math proficiency
- 10% ▼ -2.00%
- Reading proficiency
- 24% ▲ 6.00%
- Median HH income
- $25,815
- Composite
- 13.06/100
- National rank
- #9564
- State rank
- #499 of 540 in MI
Livability — Detroit
- Score
- 73/100
- State rank
- #218
- US rank
- #5427
Category grades
Schools grade is shown separately in the Schools card above.
Census & demographics
- Census place
- Detroit, MI
- County
- Wayne County · 1,562,939 people
- City population
- 572,865
- Metro
- Detroit-Warren-Dearborn, MI
- Population (ZIP)
- 32,760
- Household income
- $35,322
- Rent vs Own
- Severe rent burden
- 2372.0
Population outlook (Wayne County) Hauer SSP2
- Today (2025)
- 1,675,273 people
- By 2030
- 1,620,300 · -3.3%
- By 2040
- 1,502,341 · -10.3%
- By 2050
- 1,384,039 · -17.4%
- By 2075
- 1,124,592 · -32.9%
- By 2100
- 881,193 · -47.4%
Race, ethnicity, and origin ACS 2023
- Neighborhood character
- Predominantly Black (94%)
- Race & ethnicity
- Black 94% White 3% Two or more races 1%
- Common ancestry
- Romanian 1%
- Foreign-born
- 2% · Canada, Vietnam, Philippines
- Languages at home
- 97% English-only · French/Haitian/Cajun 1%
Political lean MEDSL · Wayne
- 2024 margin
- Strong D (+29.0) · D 62.7% · R 33.7% · Other 3.6%
- 2008→2024 swing
- -20.5pp toward R · 2008: 49.5pp · 2024: 29.0pp
- All cycles
- 2024: D+29.0 2020: D+38.1 2016: D+37.3 2012: D+46.9 2008: D+49.5
Not yet ingested
- Civics
- —
Market trends
- HPI YoY
- ▼ -44.65%
- Current HPI
- 328.8978
- Rent YoY
- ▲ 6.72%
- Metro
- Detroit-Warren-Dearborn, MI
- State GDP YoY
- ▲ 1.37%
- F500 in state
- 28
Industry mix (Fortune 500 HQ in MI)
| Industry | F500 HQs | Revenue |
|---|---|---|
| Automotive Parts | 3 | $48B |
|
||
| Automotive | 2 | $372B |
|
||
| Chemicals | 1 | $45B |
|
||
| Automotive Retail | 1 | $29B |
|
||
| Healthcare / Medical Devices | 1 | $23B |
|
||
| Automotive Technology | 1 | $20B |
|
||
Price history
+210.0% since first listed6 events — show timeline
- 2025-12-24 Listed $15,500 MiRealSource-MiMLS
- 2025-12-24 Listed $15,500 REALCOMP
- 2011-09-29 Listing Removed — MiRealSource-MiMLS
- 2011-09-29 Listing Removed — REALCOMP
- 2011-06-29 Listed $5,000 MiRealSource-MiMLS
- 2011-06-29 Listed $5,000 REALCOMP
Property tax history
+12.3%/yrLatest (2019): $582 · +0.9% YoY. Source: county tax records.
Cash-flow waterfall
monthlySold comps — $/sqft
last 12 mo · ≤1 miLoading sold comps…