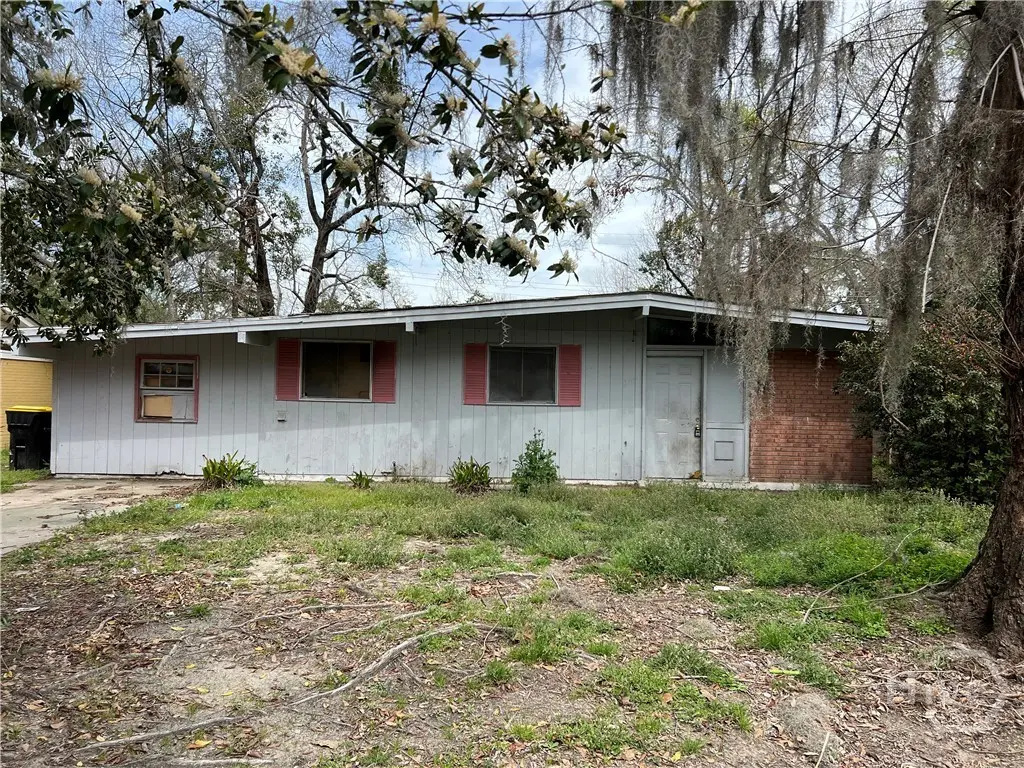
210 Croatan St · Savannah, GA
Flood risk 1/10 · Minimal
- FEMA flood zone
- X (unshaded)
- Chance of flooding over 30 yrs
- 0.0%
- Est. flood insurance / yr
- $507 – $1,088
Fire risk 2/10 · Minimal
- Est. fire insurance / yr
- $963 – $1,789
Heat risk 9/10 · Severe
- Hot days now (above 106°F)
- 7 days/yr
- Hot days in 30 yrs
- 18 days/yr
Wind risk 9/10 · Severe
- Chance of severe wind over 30 yrs
- 99.0%
Air-quality risk 2/10 · Minimal
- Unhealthy air days now
- 2 days/yr
- Unhealthy air days in 30 yrs
- 2 days/yr
Risk factors via First Street. Map © Google.
Why this score? — see what drove the B- grade
The composite is a weighted blend of 9 inputs, each scored 0–100. Each bar is that input's sub-score; the figure is the points it added to the 100-point composite (weight × sub-score).
- Cash flow +25.0/30.0
- ARV discount +15.0/15.0
- DSCR +8.2/10.0
- 1% rule +6.9/10.0
- Livability +4.3/5.0
- Rent growth +2.5/5.0
- Condition / age +2.5/5.0
- Schools +2.0/10.0
- Appreciation +0.0/10.0
$149,900
🖨 Deal sheet (PDF) 📄 Offer letter ✓ Due diligence
Listing remarks MLS
Needs a complete renovation! Investors only!!
Key facts
- 5,998 sq ft lot
- Built 1957
- Listed 33 days
Neighborhood map
What this means for you Summary
Snapshot
- This is a 3-bed/1.0-bath single-family listed at $150k.
Deal economics
- At list price, monthly cash flow is $326 ($4k/yr) — positive.
- The deal already cash-flows at list — no discount required.
- Meets the 1% rule at list price ($2k rent vs $150k).
- Recommended offer: $145k (3.0% below list) — sets the bar for market timing.
- Cap rate 8.9% vs local median 4.0% in Savannah — top-decile yield for the area; either an underpriced asset or a hidden risk that comps aren't pricing in. Stress-test before assuming the spread holds.
Location & tenants
- Location reads 86/100 on livability (#1 in GA, #397 nationally) — a professional / high-income tenant draw. Strengths: crime A+, amenities A+, commute A+; Watch: employment D, schools F.
- Savannah-Chatham County (urban): math 20% / reading 26% proficiency, ranked #134 of 174 in GA (top 77%) — low school quality limits family demand, transient renter base, plan for 1-2y turnover.
- Market conditions: Rents flat; 173 active listings in the ZIP; 40 comparable units currently listed for rent nearby; rentals at typical pace (median 25d on market — plan ~3-4 weeks tenant-placement turnaround); 2,694 units permitted in Chatham County in 2024 (973 in 5+ unit buildings).
- This rent runs 32% of the median local income ($67k/yr) — at the standard rent-burdened threshold; future hikes will face affordability resistance.
Forward outlook
- Local home prices are declining (-3.0%/yr); year-one equity from $1k of loan paydown is wiped out by about $4k of value loss. Plan a longer hold.
- Chatham County population projected at +33% by 2050 — long-run rental-demand tailwind backs the buy-and-hold thesis.
Negotiation context
- It's been on market 33 days — a 3% lower offer ($145k) is reasonable based on typical stale-listing flexibility.
- 3 sale attempts with the ask held roughly flat each time — persistent listings suggest the price (not the market) is what's stuck; bring a comps-based counter.
Risks & watch-outs
- Watch-outs: built in 1957 — expect roof / HVAC / electrical / plumbing capex.
- Climate carrying-cost: severe wind risk, 99% chance of damaging wind over 30y; extreme-heat days projected 7→18/yr by 2055 (HVAC capex compounding) — expect insurance premiums to compound above CPI over the hold.
Questions for the listing agent
- It's been on market 33 days. Have you received any prior offers? Is the seller open to a 3% concession, seller financing, or rate buy-down credit?
- Built in 1957 — when were the roof, HVAC, electrical panel, plumbing, and water heater last replaced?
- Is there a deadline driving the sale (1031 exchange, divorce, estate, relocation)? That informs how much negotiation room exists.
- Schools are F-rated, which usually means shorter tenancies and higher turnover. Who's the typical renter profile here, and what's been the actual vacancy rate?
- What's the average days-on-market for RENTAL listings here right now (not sales)? A rising rental-DOM trend means longer vacancies and softer asking-rent achievability than the comps imply.
- What's the recent tenant-quality profile in this submarket — average credit score on applications, eviction rate, late-payment / NSF rate, and stable-employment percentage? A property-management company in the area should have these aggregated.
- How much new for-sale + rental construction is in the pipeline within 1–3 miles? Heavy new supply typically softens prices + rents 12–24 months out; constrained supply supports both.
Investment metrics
- 1% rule
- 1.19% ✓
- Cap rate
- 8.91%
- Cash-on-cash
- 9.33%
- DSCR
- 1.42
- GRM
- 7.0
CMA / ARV
- ARV (median comp)
- $224,048
- List price
- $149,900
- Delta
- -33.09%
- Verdict
- UNDERPRICED
- Comps
- 20 within 1.0 mi
Show comp detail 12 sales within ~0.75 mi
| Address | Dist | Beds/Ba | Sqft | Sold | Price | $/sf | Match |
|---|---|---|---|---|---|---|---|
| 210 Croatan St | 0.00mi | 3/1.0 | 1,266 (0%) | 1mo | $139,000 | $110 | 99 |
| 106 Lucian Cir | 0.25mi | 3/2.0 | 1,175 (-7%) | 2mo | $276,000 | $235 | 71 |
| 106 Harmon Creek Dr | 0.37mi | 3/2.0 | 1,181 (-7%) | 1mo | $230,000 | $195 | 66 |
| 48 Kandlewood Dr | 0.11mi | 3/1.5 | 1,093 (-14%) | 6mo | $250,000 | $229 | 66 |
| 11 Skyline Dr | 0.61mi | 3/1.5 | 1,248 (-1%) | 6mo | $259,000 | $208 | 62 |
| 723 Dyches Dr | 0.66mi | 3/2.0 | 1,249 (-1%) | 4mo | $265,000 | $212 | 59 |
| 415 Barnhill Dr | 0.28mi | 4/2.0 (+1) | 1,402 (+11%) | 4mo | $254,900 | $182 | 56 |
| 110 Rachels Retreat | 0.33mi | 3/2.0 | 1,452 (+15%) | 2mo | $339,900 | $234 | 55 |
| 10 Kenmore Dr | 0.53mi | 3/2.0 | 1,144 (-10%) | 2mo | $230,000 | $201 | 54 |
| 8708 Clarke Ave | 0.59mi | 4/2.5 (+1) | 1,350 (+7%) | 4mo | $299,999 | $222 | 47 |
| 201 Womble Ave | 0.42mi | 3/2.0 | 1,446 (+14%) | 6mo | $287,000 | $198 | 47 |
| 405 Catherine Cir | 0.64mi | 3/2.0 | 1,429 (+13%) | 2mo | $255,000 | $178 | 44 |
Match score weights: distance 35% · size 25% · config 20% · recency 20%. Top-matched comps best support the ARV.
Projected returns pro-forma
-3.0% appreciation · 0.04% rent growth · sell at horizon
- IRR
- -5.7%
- Equity multiple
- 0.80×
- Total profit
- $-8,600
- Equity at exit
- $22,351
- IRR
- -0.2%
- Equity multiple
- 0.99×
- Total profit
- $-425
- Equity at exit
- $12,961
Cash invested: $41,972 (down + closing). Projections, not guarantees.
Landlord ↔ Tenant lean methodology
- Overall (STATE)
- 90 Strongly Landlord-Friendly
- State Georgia
- 90 Strongly Landlord-Friendly · R+3
- County
- — inherits STATE
- City
- — inherits STATE
ZIP-level market 31406
- Rents YoY
- 0.0%
- Active inventory
- 173
- Price-to-rent
- 7.0×
Monthly cashflow live
- Estimated rent
- $1,781 high interval (Pro) →
- Mortgage (P&I)
- −$786
- Tax from tax record
- −$232 /mo · $2,782/yr
- Insurance
- −$62
- HOA
- −$0
- Vacancy / Maint / Mgmt
- −$374
- Net cashflow
- $326
Break-even live
Sensitivity live
| Price | -10% $411 | -5% $369 | +0% $326 | +5% $284 | +10% $242 |
|---|---|---|---|---|---|
| Rent | -10% $186 | -5% $256 | +0% $326 | +5% $397 | +10% $467 |
| Rate | -1.0pp $402 | -0.5pp $364 | base $326 | +0.5pp $288 | +1.0pp $248 |
UW: 25.0% down · 7.5% · 30yr · 1.5% tax · 5.0% vac · 8.0% maint · 8.0% mgmt
Financing live
Cash to close
- Down payment
- $37,475
- Closing costs
- $4,497
- Reserves months
- —
- Total cash needed
- —
Loan-product check · same deal, 3 products live
Conventional
25% down · 7.5% · 30yr
- Down + closing
- —
- Monthly P&I
- —
- Monthly cashflow
- —
- DSCR
- —
- Eligible?
- —
Personal DTI + credit; lowest rate.
DSCR
20% down · 8.5% · 30yr
- Down + closing
- —
- Monthly P&I
- —
- Monthly cashflow
- —
- DSCR
- —
- Eligible?
- —
No personal income docs; deal must DSCR.
Hard money
10% down · 12.0% · 12mo
- Down + closing
- —
- Monthly P&I
- —
- Monthly cashflow
- —
- DSCR
- —
- Eligible?
- —
Short-term bridge; refi at stabilization.
Rent comps 40 comps
| Address | Beds | Baths | Sqft | Rent | $/sqft | DOM | Units | Dist |
|---|---|---|---|---|---|---|---|---|
| 211 Edgewater Rd #40 Savannah, GA | 2.0 | 2.0 | 1085 | $1,400 | $1.29 | 24d | 1 | 0.07mi |
| 28 Chatham St Unit A Savannah, GA | 2.0 | 2.0 | 964 | $1,325 | $1.37 | 45d | 1 | 0.18mi |
| 26 Chatham St Unit A Savannah, GA | 2.0 | 1.0 | 964 | $1,500 | $1.56 | 24d | 1 | 0.19mi |
| 39 Travis St Savannah, GA | 3.0 | 2.5 | 1600 | $2,150 | $1.34 | 15d | 1 | 0.20mi |
| 111 Edgewater Rd Savannah, GA | 1.0–2.0 | 1.0 | 745 | $1,375 | $1.85 | 45d | 3 | 0.20mi |
| 9406 Dunwoody Dr Savannah, GA | 4.0 | 2.0 | 1688 | $2,200 | $1.30 | 15d | 1 | 0.26mi |
| 12 Dyches Dr Savannah, GA | 3.0 | 2.0 | 1461 | $2,000 | $1.37 | 45d | 1 | 0.33mi |
| 6 Lucian Cir Savannah, GA | 4.0 | 2.0 | 1602 | $2,100 | $1.31 | 22d | 1 | 0.33mi |
| 7 Chippewa Dr Savannah, GA | 4.0 | 2.0 | 1336 | $1,850 | $1.38 | 45d | 1 | 0.36mi |
| 9610 White Bluff Rd Savannah, GA | 2.0 | 2.0 | 1000 | $1,370 | $1.37 | 24d | 5 | 0.36mi |
| 9111 White Bluff Rd Savannah, GA | 1.0–2.0 | 1.0–2.0 | 901 | $1,510 | $1.67 | 15d | 5 | 0.40mi |
| 455 Mall Blvd #60 Savannah, GA | 2.0 | 1.5 | 1188 | $1,450 | $1.22 | 45d | 1 | 0.59mi |
| 455 Mall Blvd #36 Savannah, GA | 2.0 | 1.5 | 1188 | $1,500 | $1.26 | 45d | 1 | 0.67mi |
| 511 Dyches Dr Savannah, GA | 3.0 | 2.0 | 1758 | $2,100 | $1.19 | 24d | 1 | 0.67mi |
| 100 Lewis Dr Unit 3D Savannah, GA | 2.0 | 1.5 | 1000 | $1,450 | $1.45 | 45d | 1 | 0.70mi |
| 455 Mall Blvd Savannah, GA | 3.0 | 2.5 | 1548 | $1,825 | $1.18 | 45d | 1 | 0.75mi |
| 201 W Montgomery Cross Rd Savannah, GA | 1.0–3.0 | 1.0–2.0 | 1013 | $1,699 | $1.68 | 15d | 18 | 0.75mi |
| 205 W Montgomery Xrds Savannah, GA | 1.0–3.0 | 1.0–2.0 | 1075 | $1,850 | $1.72 | 24d | 1 | 0.83mi |
| 210 Tibet Ave Savannah, GA | 2.0–3.0 | 1.5–2.5 | 1150 | $1,899 | $1.65 | 15d | 11 | 0.90mi |
| 309 Station Trl Savannah, GA | 2.0 | 2.5 | 1587 | $1,850 | $1.17 | 45d | 1 | 0.98mi |
| 17 Vineyard Dr Savannah, GA | 3.0 | 2.0 | 1120 | $2,195 | $1.96 | 24d | 1 | 0.99mi |
| 2 La Brea Blvd Savannah, GA | 3.0 | 2.0 | 1361 | $1,900 | $1.40 | 45d | 1 | 1.06mi |
| 11400 White Bluff Rd Savannah, GA | 1.0–3.0 | 1.0–2.0 | 1000 | $1,695 | $1.70 | 15d | 21 | 1.07mi |
| 10612 Abercorn St Savannah, GA | 1.0–3.0 | 1.0–2.0 | 797 | $1,849 | $2.32 | 15d | 35 | 1.09mi |
| 10611 Abercorn St Savannah, GA | 1.0–2.0 | 1.0–1.5 | 917 | $1,696 | $1.85 | 15d | 13 | 1.13mi |
| 8000 Waters Ave Savannah, GA | 1.0–2.0 | 1.0–2.0 | 1015 | $1,588 | $1.56 | 15d | 23 | 1.16mi |
| 29 Colony Park Dr Savannah, GA | 2.0 | 2.0 | 919 | $1,400 | $1.52 | 45d | 1 | 1.16mi |
| 10615 Abercorn St Savannah, GA | 1.0–3.0 | 1.0–1.5 | 837 | $1,649 | $1.97 | 22d | 25 | 1.18mi |
| 528 Wild Turkey Rd Savannah, GA | 3.0 | 2.0 | 1650 | $2,400 | $1.45 | 22d | 1 | 1.21mi |
| 10910 Queen Ann Ct Apt A Savannah, GA | 2.0 | 1.0 | 925 | $1,650 | $1.78 | 45d | 1 | 1.22mi |
| 10913 Queen Ann Ct Apt D Savannah, GA | 2.0 | 1.0 | 925 | $1,750 | $1.89 | 45d | 1 | 1.23mi |
| 11910 White Bluff Rd Savannah, GA | 1.0–2.0 | 1.0 | 750 | $1,365 | $1.82 | 15d | 3 | 1.24mi |
| 16 Ventura Blvd Savannah, GA | 4.0 | 2.0 | 1404 | $2,500 | $1.78 | 24d | 1 | 1.25mi |
| 29 Ventura Blvd Savannah, GA | 3.0 | 2.0 | 1620 | $2,150 | $1.33 | 24d | 1 | 1.33mi |
| 114 Chapel Dr Savannah, GA | 4.0 | 2.0 | 1824 | $2,300 | $1.26 | 24d | 1 | 1.34mi |
| 10725 Abercorn St Savannah, GA | 1.0–2.0 | 1.0–2.0 | 837 | $1,713 | $2.05 | 15d | 10 | 1.34mi |
| 406 Montclair Blvd Savannah, GA | 3.0 | 2.0 | 1422 | $1,995 | $1.40 | 15d | 1 | 1.38mi |
| 10875 Abercorn St Savannah, GA | 2.0 | 2.0 | 1033 | $1,475 | $1.43 | 15d | 13 | 1.39mi |
| 6803 Waters Ave Unit 12 Savannah, GA | 2.0 | 2.0 | 938 | $1,475 | $1.57 | 24d | 1 | 1.44mi |
| 115 Woodhouse Ln Savannah, GA | 2.0 | 1.0 | 975 | $1,200 | $1.23 | 24d | 1 | 1.44mi |
Listing history 8 events
-
2026-04-16$149,900 Active 45-char remark
Show marketing remark (45 chars)
Needs a complete renovation! Investors only!!
-
2025-09-24historical
-
2025-09-24historical
-
2025-03-24$159,900
-
2025-03-24$159,900
-
2024-10-04soldstatus $150,000
-
2024-09-03soldstatus $115,000
-
1986-08-01soldstatus $31,811
ⓘ Source: listings_history table (triggers on properties + properties_extension) + one-shot
backfill from property_details.listing_events for pre-trigger history.
Tax reassessment forecast GA · Resets to sale price
- Current annual tax
- $2,782 · $232/mo
- Projected year-2 tax
- $2,782 · $232/mo
- Expected delta
- $0/yr ($0/mo · 0.0%)
ⓘ Screening estimate from a state-policy table — verify with the county assessor before closing.
Climate risk First Street
- Flood 1/10 Low FEMA zone X (unshaded) · 0% chance over 30 yrs
- Wildfire 2/10 Low
- Heat 9/10 Extreme 7 d/yr ≥106°F today · 18 d/yr by 30 yrs out
- Wind 9/10 Extreme 99% chance of damaging wind over 30 yrs
- Air quality 2/10 Low 2 unhealthy d/yr today · 2 by 30 yrs out
Nearby sold comps map
Loading sold comps map…
Walkable amenities ~0.75 mi
Loading nearby amenities…
Taxation est. · year 1
- Rental income
- $21,369
- − Mortgage interest
- −$8,397
- − Property taxes
- −$2,782
- − Insurance
- −$750
- − Repairs & maintenance
- −$1,709
- − Management
- −$1,709
- − Depreciation
- −$4,361
- Taxable income
- $1,661
- Est. tax owed @ 24.0%
- −$399
- After-tax cash flow
- $3,518/yr
For passive investors: Depreciation is non-cash, so a rental often shows a tax loss while cash-flowing — sheltering income. Rental losses are passive: they offset passive income freely, and up to $25,000/yr can offset ordinary (W-2) income if you actively participate and your MAGI is under $100k (phasing out to $0 by $150k); unused losses carry forward. On sale, claimed depreciation is recaptured at up to 25%, and gains may owe capital-gains tax (a 1031 exchange can defer both). Figures are a year-1 estimate at your 24.0% rate — not tax advice; consult a CPA.
Schools (NCES district)
- District
- Savannah-Chatham County
- NCES district ID
- 1301020
- Math proficiency
- 20% ▼ -11.00%
- Reading proficiency
- 26% ▼ -5.00%
- Median HH income
- $47,443
- Composite
- 20.14/100
- National rank
- #8639
- State rank
- #134 of 174 in GA
Livability — Savannah
- Score
- 86/100
- State rank
- #1
- US rank
- #397
Category grades
Schools grade is shown separately in the Schools card above.
Census & demographics
- Census place
- Savannah, GA
- County
- Chatham County · 271,602 people
- City population
- 216,564
- Metro
- Savannah, GA
- Population (ZIP)
- 34,904
- Household income
- $67,120
- Rent vs Own
- Severe rent burden
- 1453.0
Population outlook (Chatham County) Hauer SSP2
- Today (2025)
- 332,584 people
- By 2030
- 355,508 · +6.9%
- By 2040
- 400,030 · +20.3%
- By 2050
- 443,019 · +33.2%
- By 2075
- 534,579 · +60.7%
- By 2100
- 583,863 · +75.6%
Race, ethnicity, and origin ACS 2023
- Neighborhood character
- Diverse neighborhood (Simpson 0.63)
- Race & ethnicity
- White 47% Black 38% Hispanic / Latino 7% Two or more races 6% Asian 4%
- Hispanic origin (detail)
- Mexican 2% Puerto Rican 2%
- Common ancestry
- Slovak 3% Lithuanian 1% Serbian 1%
- Foreign-born
- 7% · Canada, China, Vietnam
- Languages at home
- 91% English-only · Spanish 4% Chinese 2% Other Asian/Pacific 1%
Political lean MEDSL · Chatham
- 2024 margin
- D (+18.0) · D 58.6% · R 40.6%
- 2008→2024 swing
- +3.6pp toward D · 2008: 14.4pp · 2024: 18.0pp
- All cycles
- 2024: D+18.0 2020: D+18.8 2016: D+14.5 2012: D+12.0 2008: D+14.4
Not yet ingested
- Civics
- —
Market trends
- HPI YoY
- ▼ -240.18%
- Current HPI
- 280.3587
- Rent YoY
- ▬ 0.04%
- Metro
- Savannah, GA
- State GDP YoY
- ▲ 2.66%
- F500 in state
- 28
Industry mix (Fortune 500 HQ in GA)
| Industry | F500 HQs | Revenue |
|---|---|---|
| Paper / Packaging | 2 | $29B |
|
||
| Retail | 1 | $160B |
|
||
| Transportation / Logistics | 1 | $91B |
|
||
| Airlines | 1 | $62B |
|
||
| Consumer Goods | 1 | $47B |
|
||
| Utilities | 1 | $25B |
|
||
Price history
+371.2% since first listed8 events — show timeline
- 2026-04-16 Listed $149,900 Hive MLS
- 2025-09-24 Listing Removed — Hive MLS
- 2025-09-24 Listing Removed — Hive MLS
- 2025-03-24 Listed $159,900 Hive MLS
- 2025-03-24 Listed $159,900 Hive MLS
- 2024-10-04 Sold (Public Records) $150,000 Public Records
- 2024-09-03 Sold (Public Records) $115,000 Public Records
- 1986-08-01 Sold (Public Records) $31,811 Public Records
Property tax history
+11.4%/yrLatest (2025): $2,782 · +167.6% YoY. Source: county tax records.
Cash-flow waterfall
monthlySold comps — $/sqft
last 12 mo · ≤1 miLoading sold comps…