 Fourplex
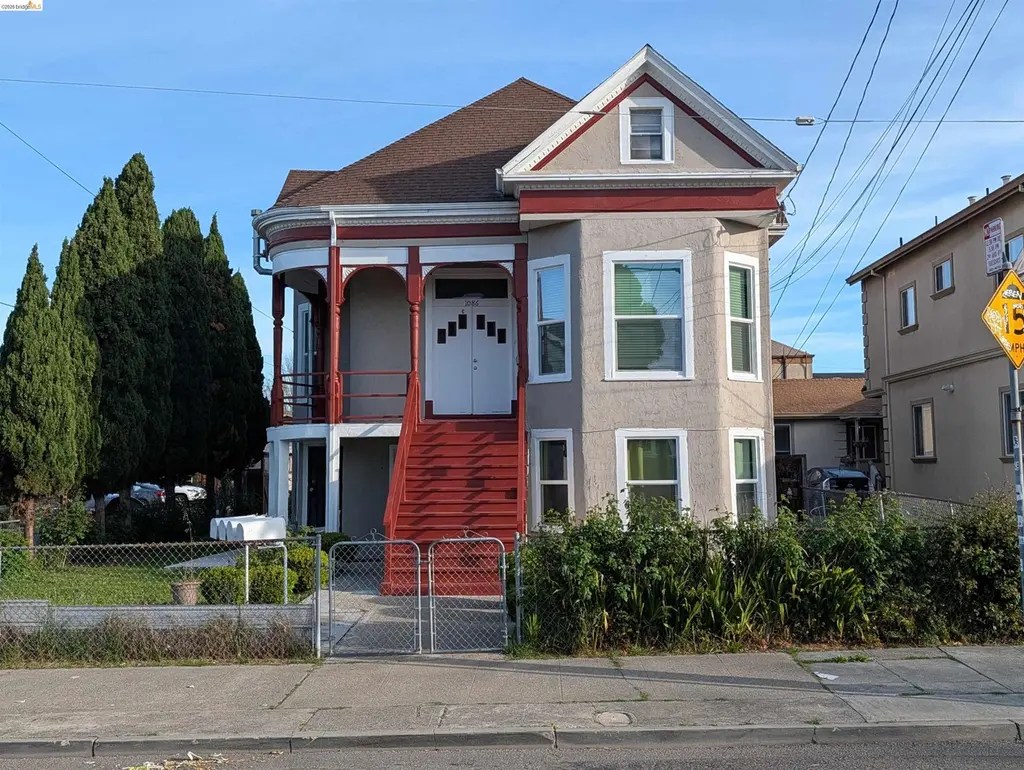
1086 66th St · Oakland, CA
Flood risk 5/10 · Moderate
- FEMA flood zone
- X (unshaded)
- Chance of flooding over 30 yrs
- 0.48%
- Est. flood insurance / yr
- $507 – $1,088
Fire risk 1/10 · Minimal
- Est. fire insurance / yr
- $659 – $1,223
Heat risk 3/10 · Minor
- Hot days now (above 82°F)
- 7 days/yr
- Hot days in 30 yrs
- 15 days/yr
Wind risk 1/10 · Minimal
- Chance of severe wind over 30 yrs
- —
Air-quality risk 9/10 · Severe
- Unhealthy air days now
- 16 days/yr
- Unhealthy air days in 30 yrs
- 16 days/yr
Risk factors via First Street. Map © Google.
Why this score? — see what drove the C grade
The composite is a weighted blend of 9 inputs, each scored 0–100. Each bar is that input's sub-score; the figure is the points it added to the 100-point composite (weight × sub-score).
- Cash flow +20.6/30.0
- ARV discount +11.2/15.0
- DSCR +6.5/10.0
- 1% rule +4.5/10.0
- Livability +3.6/5.0
- Rent growth +3.3/5.0
- Schools +3.0/10.0
- Condition / age +2.5/5.0
- Appreciation +0.0/10.0
$1,295,000
🖨 Deal sheet 📄 Offer letter ✓ Due diligence
Multi-family units
County records classify this as Multi-Family (2-4 Unit). Listing-text estimate: 4 units. confirmed
Listing remarks
Victorian Charm Meets Incredible Income Potential on a Prime Corner Property with Expansive Backyard Lot! Don’t miss this rare opportunity to own a character-filled Victorian 4-unit property offering timeless charm, strong income potential, and exciting future possibilities in a desirable Oakland location. Situated on a prime corner lot with a massive backyard, this light-filled Victorian combines historic character, added privacy, and exceptional development potential. The property features a large vacant 3-bedroom, 2-bath main unit — perfect for an owner-occupant or investor seeking flexibility and immediate upside. The unit mix includes one spacious 3BR/2BA main unit, two 2B
Key facts
- 4,800 sq ft lot
- Built 1900
- Listed 8 days
Property features AI
Exterior
- Parking: 4 total parking spaces; No parking on site
- Utilities: Public water; Public sewer; Master electric meter; Master gas meter
- Home design: Residential income property (quadruplex); Built in 1900; Corner lot; Level lot; Landscaped
- Construction: Stucco and shingle construction
- Exterior features: Front yard; Back yard; Fenced
Interior
- Kitchen: No specific kitchen appliance list provided
- Bedrooms: 4 total units
- Flooring: Laminate; Linoleum; Partial carpeting; Tile
- Bathrooms: Unit 1: 2 bathrooms; Unit 2: 1 bathroom; Unit 3: 1 bathroom; Unit 4: 1 bathroom
- Heating & cooling: Wall furnace heating; No air conditioning
- Interior features: Storage areas; Tub with shower over
- Laundry & utility: Washer and Dryer available; Master electric meter; Master gas meter
Neighborhood map
What this means for you Summary
Snapshot
- This is a 4 × 3.0-bed/2.0-bath units multifamily listed at $1.29M.
Deal economics
- At list price, monthly cash flow is $2k ($21k/yr) — positive. Per door: $430/mo.
- The deal already cash-flows at list — no discount required.
- To meet the 1% rule (rent ≥ 1% of price), the offer needs to be $1.22M (5.4% below list).
- Recommended offer: $1.22M (5.4% below list) — sets the bar for 1% rule.
- Cap rate 7.9% vs local median 2.4% in Oakland — top-decile yield for the area; either an underpriced asset or a hidden risk that comps aren't pricing in. Stress-test before assuming the spread holds.
Location & tenants
- Location reads 71/100 on livability (#224 in CA) — a middle-class / working-renter tenant base. Strengths: amenities A+, commute A+, employment A+; Watch: schools C-, crime F, cost of living F.
- Oakland Unified (urban): math 27% / reading 33% proficiency, ranked #1,007 of 1,400 in CA (top 72%) — families likely to look elsewhere, expect single-tenant / working-renter base with shorter leases; 68% free/reduced lunch — lower-income household profile, screen leases tightly.
- Market conditions: Rents rising (+3.3%/yr); 149 active listings in the ZIP; high-income renter base; 1,742 units permitted in Alameda County in 2024 (856 in 5+ unit buildings).
- At $12,247/mo this rent would consume 122% of the median local household income ($120k/yr) (locally 2495% of renters already pay >50% of income on rent) — very limited rent-growth headroom before tenants either downsize or default.
Forward outlook
- Local home prices are declining (-3.0%/yr); year-one equity from $9k of loan paydown is wiped out by about $39k of value loss. Plan a longer hold.
- Alameda County population projected at +34% by 2050 — long-run rental-demand tailwind backs the buy-and-hold thesis.
Negotiation context
- Only 9 days on market — expect competitive offers; lowballing is unlikely to land.
- Current owner paid $150k; list at $1.29M implies a 763% gain — meaningful room to come down on a strong offer.
Risks & watch-outs
- Watch-outs: built in 1900 — expect roof / HVAC / electrical / plumbing capex.
- Climate carrying-cost: moderate flood risk — expect insurance premiums to compound above CPI over the hold.
Questions for the listing agent
- Can we see the unit-by-unit rent roll, current vacancy, and any below-market leases? What's the average tenancy length?
- What capital expenditures (roof, boiler, parking lot, exteriors) have been made in the last 5 years, and what's planned in the next 2?
- Built in 1900 — when were the roof, HVAC, electrical panel, plumbing, and water heater last replaced?
- Is there a deadline driving the sale (1031 exchange, divorce, estate, relocation)? That informs how much negotiation room exists.
- Crime grade is F in this area — have there been break-ins, vandalism, or insurance claims at this property in the last 3 years? What carrier currently insures it and at what premium?
- What's the average days-on-market for RENTAL listings here right now (not sales)? A rising rental-DOM trend means longer vacancies and softer asking-rent achievability than the comps imply.
- What's the recent tenant-quality profile in this submarket — average credit score on applications, eviction rate, late-payment / NSF rate, and stable-employment percentage? A property-management company in the area should have these aggregated.
- How much new apartment / multifamily construction is in the pipeline within 1–3 miles? Heavy new supply (>2% of stock underway) typically softens rents 12–24 months out; light construction supports rent growth.
Investment metrics
- 1% rule
- 0.95% ✗
- Cap rate
- 7.89%
- Cash-on-cash
- 5.70%
- DSCR
- 1.25
- GRM
- 8.8
CMA / ARV
- ARV (on-the-fly)
- $1,409,876
- Comps found
- 2
Show comp detail 2 sales within ~0.75 mi
| Address | Dist | Beds/Ba | Sqft | Sold | Price | $/sf | Match |
|---|---|---|---|---|---|---|---|
| 6152 Baker St | 0.42mi | 11/4.0 (-1) | 2,714 (-5%) | 24mo | $1,340,000 | $494 | 33 |
| 6152 Baker St | 0.42mi | 11/4.0 (-1) | 2,714 (-5%) | 24mo | $1,340,000 | $494 | 33 |
Match score weights: distance 35% · size 25% · config 20% · recency 20%. Top-matched comps best support the ARV.
Projected returns pro-forma
-3.0% appreciation · 3.29% rent growth · sell at horizon
- IRR
- -7.2%
- Equity multiple
- 0.73×
- Total profit
- $-97,069
- Equity at exit
- $193,089
- IRR
- 2.7%
- Equity multiple
- 1.19×
- Total profit
- $69,685
- Equity at exit
- $111,968
Cash invested: $362,600 (down + closing). Projections, not guarantees.
Landlord ↔ Tenant lean methodology
- Overall (CITY)
- 0 Strongly Tenant-Friendly
- State California
- 18 Strongly Tenant-Friendly · D+13
- County
- — inherits STATE
- City Oakland
- 0 Strongly Tenant-Friendly · D+62
ZIP-level market 94608
- Rents YoY
- 3.3%
- Active inventory
- 149
- Price-to-rent
- 35.2×
Monthly cashflow live
- Estimated rent
- $12,247 high interval (Pro) →
- Mortgage (P&I)
- −$6,791
- Tax from tax record
- −$623 /mo · $7,480/yr
- Insurance
- −$540
- HOA
- −$0
- Vacancy / Maint / Mgmt
- −$2,572
- Net cashflow
- $1,721
Break-even live
4-unit breakdown (identical units grouped — click to expand)
| Units | Beds | Baths | Est. rent |
|---|---|---|---|
| 4× units | 3.0 | 2 | $12,248 |
| #1 | 3.0 | 2 | $3,062 |
| #2 | 3.0 | 2 | $3,062 |
| #3 | 3.0 | 2 | $3,062 |
| #4 | 3.0 | 2 | $3,062 |
| Total (4 units) | $12,247 | ||
UW: 25.0% down · 7.5% · 30yr · 1.5% tax · 5.0% vac · 8.0% maint · 8.0% mgmt
Financing live
Cash to close
- Down payment
- $323,750
- Closing costs
- $38,850
- Reserves months
- —
- Total cash needed
- —
Loan-product check · same deal, 3 products live
Conventional
25% down · 7.5% · 30yr
- Down + closing
- —
- Monthly P&I
- —
- Monthly cashflow
- —
- DSCR
- —
- Eligible?
- —
Personal DTI + credit; lowest rate.
DSCR
20% down · 8.5% · 30yr
- Down + closing
- —
- Monthly P&I
- —
- Monthly cashflow
- —
- DSCR
- —
- Eligible?
- —
No personal income docs; deal must DSCR.
Hard money
10% down · 12.0% · 12mo
- Down + closing
- —
- Monthly P&I
- —
- Monthly cashflow
- —
- DSCR
- —
- Eligible?
- —
Short-term bridge; refi at stabilization.
Listing history 8 events
-
2026-06-18days on market $1,295,000 Active 9 DOM
-
2026-06-17days on market $1,295,000 Active 8 DOM
-
2026-06-16pricedays on market $1,295,000 Active 7 DOM
-
2026-06-15days on market $1,395,000 Active 6 DOM
-
2026-06-13days on market $1,395,000 Active 4 DOM
-
2026-06-13days on market $1,395,000 Active 3 DOM
-
2026-06-10remarks 687-char remark
-
2026-06-10$1,395,000 Active 1 DOM
ⓘ Source: listings_history table (triggers on properties + properties_extension) + one-shot
backfill from property_details.listing_events for pre-trigger history.
Tax reassessment forecast CA · Resets to sale price
- Current annual tax
- $7,480 · $623/mo
- Projected year-2 tax
- $9,842 · $820/mo
- Expected delta
- +$2,362/yr (+$197/mo · 31.6%)
ⓘ Screening estimate from a state-policy table — verify with the county assessor before closing.
Climate risk First Street
- Flood 5/10 Major FEMA zone X (unshaded) · 48% chance over 30 yrs
- Wildfire 1/10 Low
- Heat 3/10 Moderate 7 d/yr ≥82°F today · 15 d/yr by 30 yrs out
- Wind 1/10 Low
- Air quality 9/10 Extreme 16 unhealthy d/yr today · 16 by 30 yrs out
Nearby sold comps map
Loading sold comps map…
Walkable amenities ~0.75 mi
Loading nearby amenities…
Taxation est. · year 1
- Rental income
- $146,964
- − Mortgage interest
- −$72,540
- − Property taxes
- −$7,480
- − Insurance
- −$6,475
- − Repairs & maintenance
- −$11,757
- − Management
- −$11,757
- − Depreciation
- −$37,673
- Taxable loss
- −$718
- Est. tax savings @ 24.0%
- +$172
- After-tax cash flow
- $20,826/yr
For passive investors: Depreciation is non-cash, so a rental often shows a tax loss while cash-flowing — sheltering income. Rental losses are passive: they offset passive income freely, and up to $25,000/yr can offset ordinary (W-2) income if you actively participate and your MAGI is under $100k (phasing out to $0 by $150k); unused losses carry forward. On sale, claimed depreciation is recaptured at up to 25%, and gains may owe capital-gains tax (a 1031 exchange can defer both). Figures are a year-1 estimate at your 24.0% rate — not tax advice; consult a CPA.
Schools (NCES district)
- District
- Oakland Unified
- NCES district ID
- 0628050
- Math proficiency
- 27% ▬ 0.00%
- Reading proficiency
- 33% ▬ 0.00%
- Median HH income
- $55,194
- Composite
- 29.52/100
- National rank
- #11769
- State rank
- #1007 of 1400 in CA
Livability — Oakland
- Score
- 71/100
- State rank
- #224
- US rank
- #7245
Category grades
Schools grade is shown separately in the Schools card above.
Census & demographics
- Census place
- Oakland, CA
- County
- Alameda County · 1,614,355 people
- City population
- 385,993
- Metro
- San Francisco-Oakland-Berkeley, CA
- Population (ZIP)
- 34,395
- Household income
- $120,239
- Rent vs Own
- Severe rent burden
- 2495.0
Population outlook (Alameda County) Hauer SSP2
- Today (2025)
- 1,928,884 people
- By 2030
- 2,069,146 · +7.3%
- By 2040
- 2,338,405 · +21.2%
- By 2050
- 2,586,608 · +34.1%
- By 2075
- 3,061,911 · +58.7%
- By 2100
- 3,234,133 · +67.7%
Race, ethnicity, and origin ACS 2023
- Neighborhood character
- Highly diverse neighborhood (Simpson 0.75)
- Race & ethnicity
- White 39% Black 23% Asian 16% Hispanic / Latino 13% Two or more races 11% Native American 1%
- Hispanic origin (detail)
- Mexican 7% Puerto Rican 1%
- Common ancestry
- Lithuanian 2% Romanian 2% Italian 2%
- Foreign-born
- 21% · Canada, China, South Korea
- Languages at home
- 72% English-only · Spanish 8% Chinese 6% Other Indo-European 4%
Political lean MEDSL · Alameda
- 2024 margin
- Solid D (+53.6) · D 74.6% · R 21.0% · Other 4.4%
- 2008→2024 swing
- -5.9pp toward R · 2008: 59.5pp · 2024: 53.6pp
- All cycles
- 2024: D+53.6 2020: D+62.5 2016: D+64.4 2012: D+59.8 2008: D+59.5
Not yet ingested
- Civics
- —
Market trends
- HPI YoY
- ▼ -861.08%
- Current HPI
- 314.3464
- Rent YoY
- ▲ 3.29%
- Metro
- San Francisco-Oakland-Berkeley, CA
- State GDP YoY
- ▲ 3.21%
- F500 in state
- 116
Industry mix (Fortune 500 HQ in CA)
| Industry | F500 HQs | Revenue |
|---|---|---|
| Technology | 27 | $1,492B |
|
||
| Financial Services | 3 | $174B |
|
||
| Retail | 3 | $44B |
|
||
| Insurance | 3 | $26B |
|
||
| Media / Entertainment | 2 | $115B |
|
||
| Pharmaceuticals / Biotech | 2 | $62B |
|
||
Price history
+830.0% since first listed3 events — show timeline
- 2026-06-10 Listed $1,395,000 bridgeMLS, Bay East AOR, or Contra Costa AOR
- 2026-06-09 Coming Soon $1,395,000 bridgeMLS, Bay East AOR, or Contra Costa AOR
- 1990-11-28 Sold (Public Records) $150,000 Public Records
Property tax history
+3.6%/yrLatest (2025): $7,480 · +5.2% YoY. Source: county tax records.
Cash-flow waterfall
monthlySold comps — $/sqft
last 12 mo · ≤1 miLoading sold comps…