 10-Plex
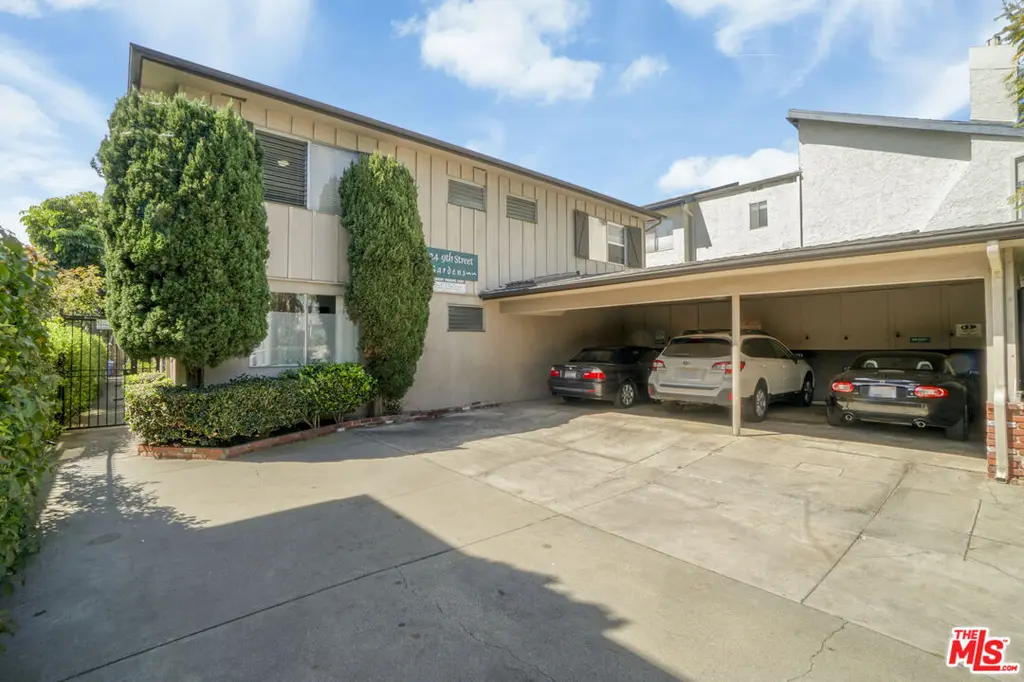
1224 9th St · Santa Monica, CA
Flood risk 1/10 · Minimal
- FEMA flood zone
- X (unshaded)
- Chance of flooding over 30 yrs
- 0.0%
- Est. flood insurance / yr
- $507 – $1,088
Fire risk 1/10 · Minimal
- Est. fire insurance / yr
- $659 – $1,223
Heat risk 7/10 · Major
- Hot days now (above 80°F)
- 7 days/yr
- Hot days in 30 yrs
- 20 days/yr
Wind risk 1/10 · Minimal
- Chance of severe wind over 30 yrs
- —
Air-quality risk 4/10 · Minor
- Unhealthy air days now
- 5 days/yr
- Unhealthy air days in 30 yrs
- 6 days/yr
Risk factors via First Street. Map © Google.
Why this score? — see what drove the B+ grade
The composite is a weighted blend of 9 inputs, each scored 0–100. Each bar is that input's sub-score; the figure is the points it added to the 100-point composite (weight × sub-score).
- Cash flow +25.7/30.0
- ARV discount +15.0/15.0
- DSCR +8.6/10.0
- 1% rule +6.8/10.0
- Schools +6.2/10.0
- Appreciation +5.7/10.0
- Condition / age +3.8/5.0
- Livability +3.6/5.0
- Rent growth +1.5/5.0
$2,600,000
🖨 Deal sheet (PDF) 📄 Offer letter ✓ Due diligence
Multi-family units
County records classify this as Multi-Family (2-4 Unit). Listing-text estimate: 10 units. estimate disagrees with records
Listing remarks MLS
1224 9th St is a newly listed 10 unit multifamily opportunity in the heart of Santa Monica, positioned between Wilshire Blvd and Arizona Ave in one of the city's most walkable and supply-constrained residential corridors. The property consists of (10) 1 Bed/1 Bath units spread across approximately 6,380 square feet, situated on a 7,493 square foot lot zoned SMR3. Current rents average well below market, reflecting approximately 38% upside as units turn. The property is 90% occupied and features nine on-site parking spaces, four covered carport spaces in front and five in the rear accessed from the alley, a highly valuable amenity in a neighborhood where off-street parking is limited and consistently in demand. The property boasts a Walk Score and Rider's Score of 100 out of 100, placing residents within steps of Wilshire Blvd's dining, retail, and everyday conveniences, and just minutes from Downtown Santa Monica and the Pacific Ocean. Beyond rental upside, SB 1211 provides a pathway to organically grow income through ADU development without expanding the existing building footprint, creating a compelling additional value-add component. Together, these attributes position 1224 9th St as a rare opportunity to acquire a stable, income-producing asset in one of the Westside's most enduring coastal markets.
Key facts
- Zoned smr3
- Rider's score of 100
- Walk score of 100
Tags
Neighborhood map
What this means for you Summary
Snapshot
- This is a 10 × 1-bed/1-bath units multifamily listed at $2.60M. Condition is rated good.
Deal economics
- At list price, monthly cash flow is $6k ($75k/yr) — positive. Per door: $622/mo.
- The deal already cash-flows at list — no discount required.
- Meets the 1% rule at list price ($31k rent vs $2.60M).
- Recommended offer: $2.52M (3.0% below list) — sets the bar for market timing.
- Cap rate 9.2% vs local median 1.2% in Santa Monica — top-decile yield for the area; either an underpriced asset or a hidden risk that comps aren't pricing in. Stress-test before assuming the spread holds.
Location & tenants
- Location reads 72/100 on livability (#178 in CA) — a middle-class / working-renter tenant base. Strengths: amenities A+, commute A+, employment A+; Watch: health & safety C-, crime F, cost of living F.
- Santa Monica-Malibu Unified (urban): math 61% / reading 74% proficiency, ranked #123 of 1,400 in CA (top 9%) — acceptable for families but not a draw, mixed tenant base, ~2y average lease.
- Zoned schools: Roosevelt Elementary (594 students, 18% FRL); Lincoln Middle (math 24% / reading 24%, grade F, #277 of 498 statewide, top 73%, 854 students, 22% FRL); Santa Monica High (2,678 students, 30% FRL) — zoned schools at 23% FRL track the district average.
- Zoned-school proficiency averages 24% at this address vs 68% district-wide (-43 pts) — the specific schools serving this property underperform the Santa Monica-Malibu Unified average; the district grade overstates school quality for this exact location.
- Market conditions: Rents falling (-4.1%/yr); 28 active listings in the ZIP; high-income renter base; 19,697 units permitted in Los Angeles County in 2024 (9,426 in 5+ unit buildings).
Forward outlook
- In year one you build about $56k of equity ($18k loan paydown + $38k appreciation (1.5% local appreciation)).
- Los Angeles County population projected at +9% by 2050 — modest demand growth; plan on rents tracking national, not racing it.
- At projected returns (1.5% appreciation + 0.0% rent growth), your $728k cash investment doubles in ~6 years — after that, you're playing with house money.
- By year 4, paydown + projected appreciation supports a ~$197k cash-out refi (75% LTV) — recoverable capital for the next deal without selling this one.
Negotiation context
- It's been on market 35 days — a 3% lower offer ($2.52M) is reasonable based on typical stale-listing flexibility.
Risks & watch-outs
- Watch-outs: built in 1957 — expect roof / HVAC / electrical / plumbing capex.
- Climate carrying-cost: extreme-heat days projected 7→20/yr by 2055 (HVAC capex compounding) — expect insurance premiums to compound above CPI over the hold.
Questions for the listing agent
- It's been on market 35 days. Have you received any prior offers? Is the seller open to a 3% concession, seller financing, or rate buy-down credit?
- Can we see the unit-by-unit rent roll, current vacancy, and any below-market leases? What's the average tenancy length?
- What capital expenditures (roof, boiler, parking lot, exteriors) have been made in the last 5 years, and what's planned in the next 2?
- Built in 1957 — when were the roof, HVAC, electrical panel, plumbing, and water heater last replaced?
- Is there a deadline driving the sale (1031 exchange, divorce, estate, relocation)? That informs how much negotiation room exists.
- Schools are A-rated — typically a magnet for longer-tenancy family renters. What's the average tenant stay here, and is there a school-zone premium baked into asking?
- Crime grade is F in this area — have there been break-ins, vandalism, or insurance claims at this property in the last 3 years? What carrier currently insures it and at what premium?
- What's the average days-on-market for RENTAL listings here right now (not sales)? A rising rental-DOM trend means longer vacancies and softer asking-rent achievability than the comps imply.
- What's the recent tenant-quality profile in this submarket — average credit score on applications, eviction rate, late-payment / NSF rate, and stable-employment percentage? A property-management company in the area should have these aggregated.
- How much new apartment / multifamily construction is in the pipeline within 1–3 miles? Heavy new supply (>2% of stock underway) typically softens rents 12–24 months out; light construction supports rent growth.
Investment metrics
- 1% rule
- 1.18% ✓
- Cap rate
- 9.17%
- Cash-on-cash
- 10.26%
- DSCR
- 1.46
- GRM
- 7.1
CMA / ARV
- ARV (median comp)
- $3,301,525
- List price
- $2,600,000
- Delta
- -21.25%
- Verdict
- UNDERPRICED
- Comps
- 20 within 1.0 mi
Projected returns pro-forma
1.46% appreciation · 0.0% rent growth · sell at horizon
- IRR
- 11.1%
- Equity multiple
- 1.57×
- Total profit
- $414,835
- Equity at exit
- $950,494
- IRR
- 12.7%
- Equity multiple
- 2.50×
- Total profit
- $1,089,152
- Equity at exit
- $1,313,271
Cash invested: $728,000 (down + closing). Projections, not guarantees.
Landlord ↔ Tenant lean methodology
- Overall (STATE)
- 18 Strongly Tenant-Friendly
- State California
- 18 Strongly Tenant-Friendly · D+13
- County
- — inherits STATE
- City
- — inherits STATE
ZIP-level market 90401
- Home prices YoY
- 0.5%
- Rents YoY
- -4.1%
- Active inventory
- 28
- Price-to-rent
- 70.8×
Monthly cashflow live
- Estimated rent
- $30,622 high interval (Pro) →
- Mortgage (P&I)
- −$13,635
- Tax est. 1.5%
- −$3,250 /mo · $39,000/yr
- Insurance
- −$1,083
- HOA
- −$0
- Vacancy / Maint / Mgmt
- −$6,431
- Net cashflow
- $6,223
Break-even live
Sensitivity live
| Price | -10% $8,020 | -5% $7,122 | +0% $6,223 | +5% $5,325 | +10% $4,427 |
|---|---|---|---|---|---|
| Rent | -10% $3,804 | -5% $5,014 | +0% $6,223 | +5% $7,433 | +10% $8,643 |
| Rate | -1.0pp $7,533 | -0.5pp $6,885 | base $6,223 | +0.5pp $5,550 | +1.0pp $4,864 |
10-unit breakdown (identical units grouped — click to expand)
| Units | Beds | Baths | Est. rent |
|---|---|---|---|
| 10× units | 1 | 1 | $30,620 |
| #1 | 1 | 1 | $3,062 |
| #2 | 1 | 1 | $3,062 |
| #3 | 1 | 1 | $3,062 |
| #4 | 1 | 1 | $3,062 |
| #5 | 1 | 1 | $3,062 |
| #6 | 1 | 1 | $3,062 |
| #7 | 1 | 1 | $3,062 |
| #8 | 1 | 1 | $3,062 |
| #9 | 1 | 1 | $3,062 |
| #10 | 1 | 1 | $3,062 |
| Total (10 units) | $30,622 | ||
UW: 25.0% down · 7.5% · 30yr · 1.5% tax · 5.0% vac · 8.0% maint · 8.0% mgmt
Financing live
Cash to close
- Down payment
- $650,000
- Closing costs
- $78,000
- Reserves months
- —
- Total cash needed
- —
Loan-product check · same deal, 3 products live
Conventional
25% down · 7.5% · 30yr
- Down + closing
- —
- Monthly P&I
- —
- Monthly cashflow
- —
- DSCR
- —
- Eligible?
- —
Personal DTI + credit; lowest rate.
DSCR
20% down · 8.5% · 30yr
- Down + closing
- —
- Monthly P&I
- —
- Monthly cashflow
- —
- DSCR
- —
- Eligible?
- —
No personal income docs; deal must DSCR.
Hard money
10% down · 12.0% · 12mo
- Down + closing
- —
- Monthly P&I
- —
- Monthly cashflow
- —
- DSCR
- —
- Eligible?
- —
Short-term bridge; refi at stabilization.
Listing history 2 events
-
2026-05-12status Pending 1324-char remark
Show marketing remark (1324 chars)
1224 9th St is a newly listed 10 unit multifamily opportunity in the heart of Santa Monica, positioned between Wilshire Blvd and Arizona Ave in one of the city's most walkable and supply-constrained residential corridors. The property consists of (10) 1 Bed/1 Bath units spread across approximately 6,380 square feet, situated on a 7,493 square foot lot zoned SMR3. Current rents average well below market, reflecting approximately 38% upside as units turn. The property is 90% occupied and features nine on-site parking spaces, four covered carport spaces in front and five in the rear accessed from the alley, a highly valuable amenity in a neighborhood where off-street parking is limited and consistently in demand. The property boasts a Walk Score and Rider's Score of 100 out of 100, placing residents within steps of Wilshire Blvd's dining, retail, and everyday conveniences, and just minutes from Downtown Santa Monica and the Pacific Ocean. Beyond rental upside, SB 1211 provides a pathway to organically grow income through ADU development without expanding the existing building footprint, creating a compelling additional value-add component. Together, these attributes position 1224 9th St as a rare opportunity to acquire a stable, income-producing asset in one of the Westside's most enduring coastal markets.
-
2026-04-07$2,600,000 Active 1324-char remark
Show marketing remark (1324 chars)
1224 9th St is a newly listed 10 unit multifamily opportunity in the heart of Santa Monica, positioned between Wilshire Blvd and Arizona Ave in one of the city's most walkable and supply-constrained residential corridors. The property consists of (10) 1 Bed/1 Bath units spread across approximately 6,380 square feet, situated on a 7,493 square foot lot zoned SMR3. Current rents average well below market, reflecting approximately 38% upside as units turn. The property is 90% occupied and features nine on-site parking spaces, four covered carport spaces in front and five in the rear accessed from the alley, a highly valuable amenity in a neighborhood where off-street parking is limited and consistently in demand. The property boasts a Walk Score and Rider's Score of 100 out of 100, placing residents within steps of Wilshire Blvd's dining, retail, and everyday conveniences, and just minutes from Downtown Santa Monica and the Pacific Ocean. Beyond rental upside, SB 1211 provides a pathway to organically grow income through ADU development without expanding the existing building footprint, creating a compelling additional value-add component. Together, these attributes position 1224 9th St as a rare opportunity to acquire a stable, income-producing asset in one of the Westside's most enduring coastal markets.
ⓘ Source: listings_history table (triggers on properties + properties_extension) + one-shot
backfill from property_details.listing_events for pre-trigger history.
Climate risk First Street
- Flood 1/10 Low FEMA zone X (unshaded) · 0% chance over 30 yrs
- Wildfire 1/10 Low
- Heat 7/10 Severe 7 d/yr ≥80°F today · 20 d/yr by 30 yrs out
- Wind 1/10 Low
- Air quality 4/10 Moderate 5 unhealthy d/yr today · 6 by 30 yrs out
Nearby sold comps map
Loading sold comps map…
Walkable amenities ~0.75 mi
Loading nearby amenities…
Taxation est. · year 1
- Rental income
- $367,464
- − Mortgage interest
- −$145,640
- − Property taxes
- −$39,000
- − Insurance
- −$13,000
- − Repairs & maintenance
- −$29,397
- − Management
- −$29,397
- − Depreciation
- −$75,636
- Taxable income
- $35,393
- Est. tax owed @ 24.0%
- −$8,494
- After-tax cash flow
- $66,186/yr
For passive investors: Depreciation is non-cash, so a rental often shows a tax loss while cash-flowing — sheltering income. Rental losses are passive: they offset passive income freely, and up to $25,000/yr can offset ordinary (W-2) income if you actively participate and your MAGI is under $100k (phasing out to $0 by $150k); unused losses carry forward. On sale, claimed depreciation is recaptured at up to 25%, and gains may owe capital-gains tax (a 1031 exchange can defer both). Figures are a year-1 estimate at your 24.0% rate — not tax advice; consult a CPA.
Condition & rehab AI · 12 photos
This 10-unit multifamily property in Santa Monica is in good condition with minimal repairs needed. Painting the exterior and cleaning gutters would significantly enhance its curb appeal and value.
Value-add opportunities
- Both Paint exterior — Enhances curb appeal and value
- Both Clean gutters — Improves drainage and property value
Renovation cost estimate screening
Value-add ROI direction
- Both Paint exterior — Enhances curb appeal and value ↑
- Both Clean gutters — Improves drainage and property value ↑
ⓘ Cost ranges are severity-bucket heuristics (US national rule-of-thumb). Get contractor quotes + a written scope before underwriting a rehab budget.
Schools (NCES district)
- District
- Santa Monica-Malibu Unified
- NCES district ID
- 0635700
- Math proficiency
- 61% ▬ 0.00%
- Reading proficiency
- 74% ▬ 0.00%
- Median HH income
- $81,489
- Composite
- 61.58/100
- National rank
- #1535
- State rank
- #123 of 1400 in CA
Livability — Santa Monica
- Score
- 72/100
- State rank
- #178
- US rank
- #5878
Category grades
Schools grade is shown separately in the Schools card above.
Census & demographics
- Census place
- Santa Monica, CA
- County
- Los Angeles County · 9,444,647 people
- City population
- 93,581
- Metro
- Los Angeles-Long Beach-Anaheim, CA
- Population (ZIP)
- 8,101
- Household income
- $110,385
- Rent vs Own
- Severe rent burden
- 1039.0
Population outlook (Los Angeles County) Hauer SSP2
- Today (2025)
- 10,940,515 people
- By 2030
- 11,256,481 · +2.9%
- By 2040
- 11,729,929 · +7.2%
- By 2050
- 11,948,407 · +9.2%
- By 2075
- 11,818,114 · +8.0%
- By 2100
- 10,842,928 · -0.9%
Race, ethnicity, and origin ACS 2023
- Neighborhood character
- Predominantly White (71%)
- Race & ethnicity
- White 71% Two or more races 14% Hispanic / Latino 10% Asian 6% Black 4%
- Hispanic origin (detail)
- Mexican 5% Salvadoran 1%
- Common ancestry
- Scotch-Irish 6% Romanian 4% Italian 4%
- Foreign-born
- 28% · Canada, China, Dominican Republic
- Languages at home
- 75% English-only · Spanish 7% Other Indo-European 6% Russian/Polish/Slavic 2%
Political lean MEDSL · Los Angeles
- 2024 margin
- Solid D (+32.9) · D 64.8% · R 31.9% · Other 3.3%
- 2008→2024 swing
- -7.4pp toward R · 2008: 40.4pp · 2024: 32.9pp
- All cycles
- 2024: D+32.9 2020: D+44.2 2016: D+48.0 2012: D+40.0 2008: D+40.4
Not yet ingested
- Civics
- —
Market trends
- HPI YoY
- ▲ 1.46%
- Current HPI
- 273.1797
- Rent YoY
- ▼ -4.14%
- Metro
- Los Angeles-Long Beach-Anaheim, CA
- State GDP YoY
- ▲ 3.21%
- F500 in state
- 116
Industry mix (Fortune 500 HQ in CA)
| Industry | F500 HQs | Revenue |
|---|---|---|
| Technology | 27 | $1,492B |
|
||
| Financial Services | 3 | $174B |
|
||
| Retail | 3 | $44B |
|
||
| Insurance | 3 | $26B |
|
||
| Media / Entertainment | 2 | $115B |
|
||
| Pharmaceuticals / Biotech | 2 | $62B |
|
||
Price history
2 events — show timeline
- 2026-05-12 Pending — TheMLS
- 2026-04-07 Listed $2,600,000 TheMLS
Cash-flow waterfall
monthlySold comps — $/sqft
last 12 mo · ≤1 miLoading sold comps…