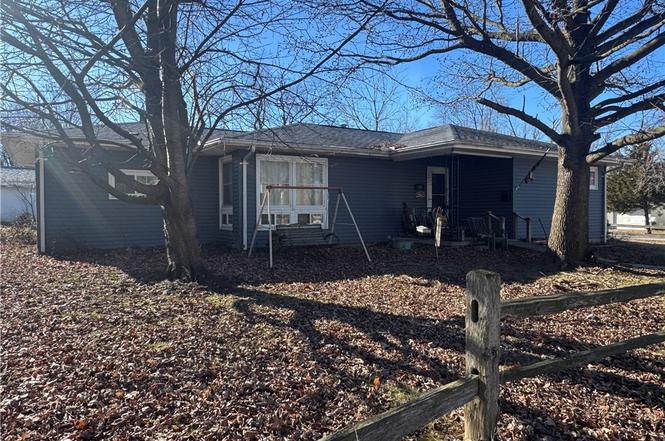
520 W Grant St · Paris, IL
Flood risk 1/10 · Minimal
- FEMA flood zone
- X (unshaded)
- Chance of flooding over 30 yrs
- 0.0%
- Est. flood insurance / yr
- $473 – $860
Fire risk 1/10 · Minimal
- Est. fire insurance / yr
- $804 – $1,492
Heat risk 4/10 · Minor
- Hot days now (above 104°F)
- 7 days/yr
- Hot days in 30 yrs
- 19 days/yr
Wind risk 2/10 · Minimal
- Chance of severe wind over 30 yrs
- 1.0%
Air-quality risk 4/10 · Minor
- Unhealthy air days now
- 3 days/yr
- Unhealthy air days in 30 yrs
- 5 days/yr
Risk factors via First Street. Map © Google.
Why this score? — see what drove the B grade
The composite is a weighted blend of 9 inputs, each scored 0–100. Each bar is that input's sub-score; the figure is the points it added to the 100-point composite (weight × sub-score).
- Cash flow +30.0/30.0
- ARV discount +13.4/15.0
- DSCR +10.0/10.0
- 1% rule +9.6/10.0
- Livability +3.6/5.0
- Schools +2.8/10.0
- Rent growth +2.5/5.0
- Condition / age +2.5/5.0
- Appreciation +0.0/10.0
$69,900
🖨 Deal sheet (PDF) 📄 Offer letter ✓ Due diligence
Listing remarks
Home is being sold "As Is. " Sits nicely on a large corner lot. Inside the area is spacious and lots of room to make it your own. Large kitchen with adjoining utility room which houses the washer and dryer. Flooring in the living area and halls is in good shape. Nice sized yard with a detached garage in the back. Come and take a look and see all the potential this gem possesses. Roof is newer and there is a pretty front door to greet friends.
Key facts
- Utility room
- Large corner lot
- Newer roof
Tags
Property features AI
Exterior
- Parking: Detached garage
- Utilities: Public water; Public sewer
- Home design: Single-family residence; One story
- Construction: Vinyl siding; Composition roof
- Exterior features: Front porch; Dirt road access; Zoned residential
Interior
- Kitchen: Range; Refrigerator; Gas water heater
- Bedrooms: Total of 6 rooms (bedroom count not specified)
- Bathrooms: 1 full bathroom
- Heating & cooling: Forced air heating; Central air conditioning
- Interior features: Water softener; Crawl space basement
- Laundry & utility: Washer; Dryer; Main level laundry
Neighborhood map
What this means for you Summary
Snapshot
- This is a 3-bed/1.0-bath single-family listed at $70k.
Deal economics
- At list price, monthly cash flow is $324 ($4k/yr) — positive.
- The deal already cash-flows at list — no discount required.
- Meets the 1% rule at list price ($1k rent vs $70k).
- Cap rate 11.9% vs local median 8.3% in Paris — top-decile yield for the area; either an underpriced asset or a hidden risk that comps aren't pricing in. Stress-test before assuming the spread holds.
Location & tenants
- Location reads 71/100 on livability (#342 in IL) — a middle-class / working-renter tenant base. Strengths: cost of living A+, housing A+, health & safety A+; Watch: employment D, crime F, amenities F.
- Paris-Union SD 95 (town): math 25% / reading 42% proficiency, ranked #227 of 620 in IL (top 37%) — families likely to look elsewhere, expect single-tenant / working-renter base with shorter leases.
- Market conditions: 83 active listings in the ZIP; 6 units permitted in Edgar County in 2024 (0 in 5+ unit buildings).
Forward outlook
- Local home prices are declining (-3.0%/yr); year-one equity from $483 of loan paydown is wiped out by about $2k of value loss. Plan a longer hold.
- Edgar County population projected at -30% by 2050 — secular population decline; favor cash flow + early exit over multi-decade hold.
- At projected returns (-3.0% appreciation + 3.0% rent growth), your $20k cash investment doubles in ~7 years — after that, you're playing with house money.
Negotiation context
- Only 11 days on market — expect competitive offers; lowballing is unlikely to land.
- 2 sale attempts with the ask held roughly flat each time — persistent listings suggest the price (not the market) is what's stuck; bring a comps-based counter.
- Current owner paid $48k; 44% above their basis — modest negotiation headroom, anchor on the comps not their cost.
Questions for the listing agent
- Built in 1968 — when were the roof, HVAC, electrical panel, plumbing, and water heater last replaced?
- Is there a deadline driving the sale (1031 exchange, divorce, estate, relocation)? That informs how much negotiation room exists.
- Crime grade is F in this area — have there been break-ins, vandalism, or insurance claims at this property in the last 3 years? What carrier currently insures it and at what premium?
- What's the average days-on-market for RENTAL listings here right now (not sales)? A rising rental-DOM trend means longer vacancies and softer asking-rent achievability than the comps imply.
- What's the recent tenant-quality profile in this submarket — average credit score on applications, eviction rate, late-payment / NSF rate, and stable-employment percentage? A property-management company in the area should have these aggregated.
- How much new for-sale + rental construction is in the pipeline within 1–3 miles? Heavy new supply typically softens prices + rents 12–24 months out; constrained supply supports both.
Investment metrics
- 1% rule
- 1.46% ✓
- Cap rate
- 11.86%
- Cash-on-cash
- 19.87%
- DSCR
- 1.88
- GRM
- 5.7
CMA / ARV
- ARV (on-the-fly)
- $80,512
- Comps found
- 12
Show comp detail 12 sales within ~0.75 mi
| Address | Dist | Beds/Ba | Sqft | Sold | Price | $/sf | Match |
|---|---|---|---|---|---|---|---|
| 1612 S Jefferson St | 0.10mi | 3/1.0 | 1,116 (+3%) | 2mo | $75,000 | $67 | 89 |
| 1312 S Central Ave | 0.33mi | 2/1.0 (-1) | 1,040 (-4%) | 8mo | $83,000 | $80 | 66 |
| 302 E Van Buren St | 0.53mi | 2/1.5 (-1) | 1,088 (0%) | 4mo | $80,000 | $74 | 65 |
| 320 E Jasper St | 0.71mi | 3/1.0 | 1,102 (+1%) | 2mo | $82,000 | $74 | 64 |
| 302 E Van Buren St | 0.55mi | 2/1.5 (-1) | 1,088 (0%) | 10mo | $85,500 | $79 | 59 |
| 701 Alexander St | 0.59mi | 2/1.0 (-1) | 1,064 (-2%) | 6mo | $54,000 | $51 | 59 |
| 706 Douglas St | 0.59mi | 2/1.0 (-1) | 1,052 (-3%) | 8mo | $62,160 | $59 | 55 |
| 409 E Adams St | 0.70mi | 3/1.5 | 1,144 (+5%) | 11mo | $109,900 | $96 | 48 |
| 423 W Carroll St | 0.68mi | 3/1.0 | 1,230 (+13%) | 1mo | $54,000 | $44 | 46 |
| 902 Wabash Ave | 0.73mi | 2/1.0 (-1) | 1,200 (+10%) | 0mo | $65,000 | $54 | 43 |
| 411 E Monroe St | 0.67mi | 2/1.0 (-1) | 944 (-13%) | 2mo | $97,000 | $103 | 40 |
| 916 Shaw Ave | 0.65mi | 2/1.0 (-1) | 1,208 (+11%) | 8mo | $125,000 | $103 | 40 |
Match score weights: distance 35% · size 25% · config 20% · recency 20%. Top-matched comps best support the ARV.
Projected returns pro-forma
-3.0% appreciation · 3.0% rent growth · sell at horizon
- IRR
- 12.0%
- Equity multiple
- 1.48×
- Total profit
- $9,334
- Equity at exit
- $10,422
- IRR
- 21.0%
- Equity multiple
- 2.78×
- Total profit
- $34,775
- Equity at exit
- $6,044
Cash invested: $19,572 (down + closing). Projections, not guarantees.
Landlord ↔ Tenant lean methodology
- Overall (STATE)
- 43 Moderately Tenant-Leaning
- State Illinois
- 43 Moderately Tenant-Leaning · D+7
- County
- — inherits STATE
- City
- — inherits STATE
ZIP-level market 61944
- Active inventory
- 83
- Price-to-rent
- 5.7×
Monthly cashflow live
- Estimated rent
- $1,022 medium interval (Pro) →
- Mortgage (P&I)
- −$367
- Tax est. 1.5%
- −$87 /mo · $1,048/yr
- Insurance
- −$29
- HOA
- −$0
- Vacancy / Maint / Mgmt
- −$215
- Net cashflow
- $324
Break-even live
Sensitivity live
| Price | -10% $372 | -5% $348 | +0% $324 | +5% $300 | +10% $276 |
|---|---|---|---|---|---|
| Rent | -10% $243 | -5% $284 | +0% $324 | +5% $365 | +10% $405 |
| Rate | -1.0pp $359 | -0.5pp $342 | base $324 | +0.5pp $306 | +1.0pp $288 |
UW: 25.0% down · 7.5% · 30yr · 1.5% tax · 5.0% vac · 8.0% maint · 8.0% mgmt
Financing live
Cash to close
- Down payment
- $17,475
- Closing costs
- $2,097
- Reserves months
- —
- Total cash needed
- —
Loan-product check · same deal, 3 products live
Conventional
25% down · 7.5% · 30yr
- Down + closing
- —
- Monthly P&I
- —
- Monthly cashflow
- —
- DSCR
- —
- Eligible?
- —
Personal DTI + credit; lowest rate.
DSCR
20% down · 8.5% · 30yr
- Down + closing
- —
- Monthly P&I
- —
- Monthly cashflow
- —
- DSCR
- —
- Eligible?
- —
No personal income docs; deal must DSCR.
Hard money
10% down · 12.0% · 12mo
- Down + closing
- —
- Monthly P&I
- —
- Monthly cashflow
- —
- DSCR
- —
- Eligible?
- —
Short-term bridge; refi at stabilization.
Listing history 8 events
-
2026-06-01status $69,900 Pending 11 DOM
-
2026-06-01days on market $69,900 Active 11 DOM
-
2026-05-31days on market $69,900 Active 10 DOM
-
2026-05-31days on market $69,900 Active 9 DOM
-
2026-05-25status Active
-
2026-01-18status Pending
-
2026-01-13$69,900 Active
-
2002-06-28soldstatus $48,500
ⓘ Source: listings_history table (triggers on properties + properties_extension) + one-shot
backfill from property_details.listing_events for pre-trigger history.
Climate risk First Street
- Flood 1/10 Low FEMA zone X (unshaded) · 0% chance over 30 yrs
- Wildfire 1/10 Low
- Heat 4/10 Moderate 7 d/yr ≥104°F today · 19 d/yr by 30 yrs out
- Wind 2/10 Low 100% chance of damaging wind over 30 yrs
- Air quality 4/10 Moderate 3 unhealthy d/yr today · 5 by 30 yrs out
Nearby sold comps map
Loading sold comps map…
Walkable amenities ~0.75 mi
Loading nearby amenities…
Taxation est. · year 1
- Rental income
- $12,261
- − Mortgage interest
- −$3,915
- − Property taxes
- −$1,048
- − Insurance
- −$350
- − Repairs & maintenance
- −$981
- − Management
- −$981
- − Depreciation
- −$2,033
- Taxable income
- $2,953
- Est. tax owed @ 24.0%
- −$709
- After-tax cash flow
- $3,181/yr
For passive investors: Depreciation is non-cash, so a rental often shows a tax loss while cash-flowing — sheltering income. Rental losses are passive: they offset passive income freely, and up to $25,000/yr can offset ordinary (W-2) income if you actively participate and your MAGI is under $100k (phasing out to $0 by $150k); unused losses carry forward. On sale, claimed depreciation is recaptured at up to 25%, and gains may owe capital-gains tax (a 1031 exchange can defer both). Figures are a year-1 estimate at your 24.0% rate — not tax advice; consult a CPA.
Schools (NCES district)
- District
- Paris-Union SD 95
- NCES district ID
- 1730750
- Math proficiency
- 25% ▼ -4.00%
- Reading proficiency
- 42% ▼ -7.00%
- Median HH income
- $36,294
- Composite
- 27.73/100
- National rank
- #6901
- State rank
- #227 of 620 in IL
Livability — Paris
- Score
- 71/100
- State rank
- #342
- US rank
- #6933
Category grades
Schools grade is shown separately in the Schools card above.
Census & demographics
- Census place
- Paris, IL
- City population
- 11,426
- Population (ZIP)
- 11,426
Population outlook (Edgar County) Hauer SSP2
- Today (2025)
- 15,960 people
- By 2030
- 14,978 · -6.2%
- By 2040
- 12,990 · -18.6%
- By 2050
- 11,087 · -30.5%
- By 2075
- 7,338 · -54.0%
- By 2100
- 4,526 · -71.6%
Race, ethnicity, and origin ACS 2023
- Neighborhood character
- Predominantly White (96%)
- Race & ethnicity
- White 96% Two or more races 3% Hispanic / Latino 1%
- Common ancestry
- Slovak 2% Serbian 2% Italian 1%
- Foreign-born
- 1%
- Languages at home
- 98% English-only · Spanish 1% Other Indo-European 1%
Political lean MEDSL · Edgar
- 2024 margin
- Solid R (+52.4) · D 23.0% · R 75.3% · Other 1.7%
- 2008→2024 swing
- -44.4pp toward R · 2008: -7.9pp · 2024: -52.4pp
- All cycles
- 2024: R+52.4 2020: R+52.5 2016: R+49.5 2012: R+32.8 2008: R+7.9
Not yet ingested
- Civics
- —
Market trends
- HPI YoY
- ▼ -66.48%
- Current HPI
- 108.1718
- Rent YoY
- —
- Metro
- —
- State GDP YoY
- ▲ 1.59%
- F500 in state
- 60
Industry mix (Fortune 500 HQ in IL)
| Industry | F500 HQs | Revenue |
|---|---|---|
| Insurance | 4 | $201B |
|
||
| Consumer Goods | 4 | $87B |
|
||
| Industrial Machinery | 3 | $64B |
|
||
| Healthcare | 2 | $55B |
|
||
| Retail / Pharmacy | 1 | $148B |
|
||
| Agriculture / Food | 1 | $86B |
|
||
Price history
+44.1% since first listed4 events — show timeline
- 2026-05-25 Relisted — CIBR
- 2026-01-18 Pending — CIBR
- 2026-01-13 Listed $69,900 CIBR
- 2002-06-28 Sold (Public Records) $48,500 Public Records
Cash-flow waterfall
monthlySold comps — $/sqft
last 12 mo · ≤1 miLoading sold comps…