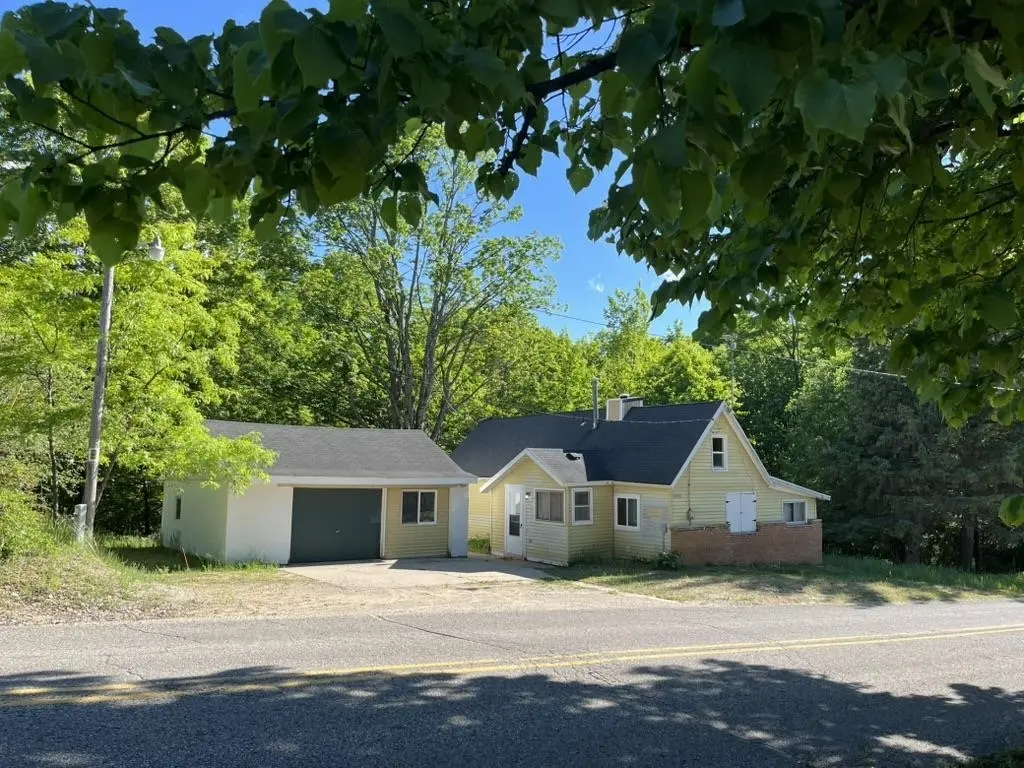
2570 Kettle Lake Rd · Kalkaska, MI
Flood risk 1/10 · Minimal
- FEMA flood zone
- —
- Chance of flooding over 30 yrs
- 0.0%
- Est. flood insurance / yr
- —
Fire risk 4/10 · Minor
- Est. fire insurance / yr
- $784 – $1,456
Heat risk 1/10 · Minimal
- Hot days now (above 93°F)
- 7 days/yr
- Hot days in 30 yrs
- 13 days/yr
Wind risk 1/10 · Minimal
- Chance of severe wind over 30 yrs
- —
Air-quality risk 2/10 · Minimal
- Unhealthy air days now
- 0 days/yr
- Unhealthy air days in 30 yrs
- 1 days/yr
Risk factors via First Street. Map © Google.
Why this score? — see what drove the D- grade
The composite is a weighted blend of 9 inputs, each scored 0–100. Each bar is that input's sub-score; the figure is the points it added to the 100-point composite (weight × sub-score).
- Cash flow +15.4/30.0
- ARV discount +4.8/15.0
- DSCR +4.7/10.0
- Livability +3.7/5.0
- 1% rule +3.2/10.0
- Schools +2.6/10.0
- Rent growth +2.5/5.0
- Condition / age +2.5/5.0
- Appreciation +0.0/10.0
$154,000
🖨 Deal sheet (PDF) 📄 Offer letter ✓ Due diligence
Listing remarks MLS
Check out this great little house on a fabulous one acre wooded parcel! Add 10' on Palmer Creek and you have a super spot to land for a primary home or vacation. Plant a garden, park your RV, pitch a tent, have a bonfire, or play in the creek! Great drive thru garage for the mechanics in the house! Seller has replaced the electrical, furnace, insulation, roof, bathroom, flooring and paint. Upstairs attic is drywalled and painted for extra living/sleeping area. House has been a great rental. Still needs some work for the handy person but the lovely wooded lot makes it all worth while! Just outside Kalkaska village limits. Seller will provide $2000 at close for future repairs. Seller is a licensed Michigan Realtor. i
Key facts
- Replaced insulation
- Replaced furnace
- Replaced roof
Tags
Property features AI
Exterior
- Parking: Detached 2-car garage
- Utilities: Private well water; Septic tank sewer
- Home design: Single-family residence; One and one-half story
- Construction: Aluminum and wood siding; Block foundation; Block basement
- Exterior features: Waterfront property on Palmer Creek; Creek frontage; Sloped lot; Lot dimensions approximately 208 x 208; Approximately 1 acre
Interior
- Kitchen: Electric range/oven; Refrigerator
- Bedrooms: Total of 6 rooms (bedrooms and living spaces combined)
- Bathrooms: One full bathroom
- Heating & cooling: Forced air heating; Propane heating; No central cooling
- Interior features: Electric water heater; Oven; Refrigerator; Range; Full basement with block construction
- Laundry & utility: Electric water heater
Neighborhood map
What this means for you Summary
Snapshot
- This is a 3-bed/1.0-bath single-family listed at $154k.
Deal economics
- At list price, monthly cash flow is $59 ($709/yr) — positive.
- The deal already cash-flows at list — no discount required.
- To meet the 1% rule (rent ≥ 1% of price), the offer needs to be $127k (17.7% below list).
- Recommended offer: $127k (17.7% below list) — sets the bar for 1% rule.
- Cap rate 6.8% vs local median 2.5% in Kalkaska — top-decile yield for the area; either an underpriced asset or a hidden risk that comps aren't pricing in. Stress-test before assuming the spread holds.
Location & tenants
- Location reads 73/100 on livability (#203 in MI) — a middle-class / working-renter tenant base. Strengths: crime A+, cost of living A+, housing A+; Watch: amenities F, commute F, employment F.
- Kalkaska Public Schools (town): math 24% / reading 38% proficiency, ranked #356 of 540 in MI (top 66%) — families likely to look elsewhere, expect single-tenant / working-renter base with shorter leases.
- Zoned schools: Birch Street Elementary School (math 37% / reading 32%, grade F, #744 of 1,397 statewide, top 57%, 354 students, 72% FRL); Kalkaska Middle School (math 19% / reading 37%, grade F, #359 of 493 statewide, top 73%, 304 students, 66% FRL); Kalkaska High School (math 32% / reading 52%, grade F, #264 of 713 statewide, top 41%, 449 students, 62% FRL).
- Market conditions: 168 active listings in the ZIP; 38 units permitted in Kalkaska County in 2024 (0 in 5+ unit buildings).
Forward outlook
- Local home prices are declining (-3.0%/yr); year-one equity from $1k of loan paydown is wiped out by about $5k of value loss. Plan a longer hold.
- Kalkaska County population projected to shrink 9% by 2050 — rents likely to lag national; underwrite the cash flow, not the appreciation.
Negotiation context
- Only 5 days on market — expect competitive offers; lowballing is unlikely to land.
- 6 sale attempts since 15y ago with the ask held roughly flat each time — persistent listings suggest the price (not the market) is what's stuck; bring a comps-based counter.
- Current owner paid $25k; list at $154k implies a 516% gain — meaningful room to come down on a strong offer.
Questions for the listing agent
- Built in 1960 — when were the roof, HVAC, electrical panel, plumbing, and water heater last replaced?
- Is there a deadline driving the sale (1031 exchange, divorce, estate, relocation)? That informs how much negotiation room exists.
- Schools are D-rated, which usually means shorter tenancies and higher turnover. Who's the typical renter profile here, and what's been the actual vacancy rate?
- The area grade is low — what's the realistic commute time and amenity access for the typical tenant pool here? Any planned neighborhood developments (good or bad) we should know about?
- What's the average days-on-market for RENTAL listings here right now (not sales)? A rising rental-DOM trend means longer vacancies and softer asking-rent achievability than the comps imply.
- What's the recent tenant-quality profile in this submarket — average credit score on applications, eviction rate, late-payment / NSF rate, and stable-employment percentage? A property-management company in the area should have these aggregated.
- How much new for-sale + rental construction is in the pipeline within 1–3 miles? Heavy new supply typically softens prices + rents 12–24 months out; constrained supply supports both.
Investment metrics
- 1% rule
- 0.82% ✗
- Cap rate
- 6.75%
- Cash-on-cash
- 1.64%
- DSCR
- 1.07
- GRM
- 10.1
CMA / ARV
- ARV (on-the-fly)
- $145,176
- Comps found
- 3
Show comp detail 3 sales within ~0.75 mi
| Address | Dist | Beds/Ba | Sqft | Sold | Price | $/sf | Match |
|---|---|---|---|---|---|---|---|
| 2692 Kettle Lake Rd | 0.12mi | 3/2.0 | 1,200 (+14%) | 1mo | $310,000 | $258 | 66 |
| 1295 NE Wa-ba-tesse Dr | 0.40mi | 2/1.0 (-1) | 1,200 (+14%) | 11mo | $166,000 | $138 | 44 |
| 1295 NE Wa-Ba-Tesse Dr Lot : 1-2 | 0.40mi | 2/1.0 (-1) | 1,200 (+14%) | 11mo | $166,000 | $138 | 44 |
Match score weights: distance 35% · size 25% · config 20% · recency 20%. Top-matched comps best support the ARV.
Projected returns pro-forma
-3.0% appreciation · 3.0% rent growth · sell at horizon
- IRR
- -13.7%
- Equity multiple
- 0.51×
- Total profit
- $-21,246
- Equity at exit
- $22,962
- IRR
- -4.9%
- Equity multiple
- 0.68×
- Total profit
- $-13,881
- Equity at exit
- $13,315
Cash invested: $43,120 (down + closing). Projections, not guarantees.
Landlord ↔ Tenant lean methodology
- Overall (STATE)
- 62 Landlord-Friendly
- State Michigan
- 62 Landlord-Friendly · EVEN
- County
- — inherits STATE
- City
- — inherits STATE
ZIP-level market 49646
- Active inventory
- 168
- Price-to-rent
- 10.1×
Monthly cashflow live
- Estimated rent
- $1,267 medium interval (Pro) →
- Mortgage (P&I)
- −$808
- Tax from tax record
- −$70 /mo · $841/yr
- Insurance
- −$64
- HOA
- −$0
- Vacancy / Maint / Mgmt
- −$266
- Net cashflow
- $59
Break-even live
Sensitivity live
| Price | -10% $146 | -5% $103 | +0% $59 | +5% $16 | +10% $-28 |
|---|---|---|---|---|---|
| Rent | -10% $-41 | -5% $9 | +0% $59 | +5% $109 | +10% $159 |
| Rate | -1.0pp $137 | -0.5pp $98 | base $59 | +0.5pp $19 | +1.0pp $-21 |
UW: 25.0% down · 7.5% · 30yr · 1.5% tax · 5.0% vac · 8.0% maint · 8.0% mgmt
Financing live
Cash to close
- Down payment
- $38,500
- Closing costs
- $4,620
- Reserves months
- —
- Total cash needed
- —
Loan-product check · same deal, 3 products live
Conventional
25% down · 7.5% · 30yr
- Down + closing
- —
- Monthly P&I
- —
- Monthly cashflow
- —
- DSCR
- —
- Eligible?
- —
Personal DTI + credit; lowest rate.
DSCR
20% down · 8.5% · 30yr
- Down + closing
- —
- Monthly P&I
- —
- Monthly cashflow
- —
- DSCR
- —
- Eligible?
- —
No personal income docs; deal must DSCR.
Hard money
10% down · 12.0% · 12mo
- Down + closing
- —
- Monthly P&I
- —
- Monthly cashflow
- —
- DSCR
- —
- Eligible?
- —
Short-term bridge; refi at stabilization.
Listing history 5 events
-
2026-06-21days on market $154,000 Active 5 DOM
-
2026-06-21days on market $154,000 Active 4 DOM
-
2026-06-18days on market $154,000 Active 2 DOM
-
2026-06-17remarks 699-char remark
-
2026-06-17$154,000 Active 1 DOM
ⓘ Source: listings_history table (triggers on properties + properties_extension) + one-shot
backfill from property_details.listing_events for pre-trigger history.
Tax reassessment forecast MI · Partial reset (capped growth)
- Current annual tax
- $841 · $70/mo
- Projected year-2 tax
- $1,606 · $134/mo
- Expected delta
- +$765/yr (+$64/mo · 91.0%)
ⓘ Screening estimate from a state-policy table — verify with the county assessor before closing.
Climate risk First Street
- Flood 1/10 Low 0% chance over 30 yrs
- Wildfire 4/10 Moderate
- Heat 1/10 Low 7 d/yr ≥93°F today · 13 d/yr by 30 yrs out
- Wind 1/10 Low
- Air quality 2/10 Low 0 unhealthy d/yr today · 1 by 30 yrs out
Nearby sold comps map
Loading sold comps map…
Walkable amenities ~0.75 mi
Loading nearby amenities…
Taxation est. · year 1
- Rental income
- $15,205
- − Mortgage interest
- −$8,626
- − Property taxes
- −$841
- − Insurance
- −$770
- − Repairs & maintenance
- −$1,216
- − Management
- −$1,216
- − Depreciation
- −$4,480
- Taxable loss
- −$1,946
- Est. tax savings @ 24.0%
- +$467
- After-tax cash flow
- $1,176/yr
For passive investors: Depreciation is non-cash, so a rental often shows a tax loss while cash-flowing — sheltering income. Rental losses are passive: they offset passive income freely, and up to $25,000/yr can offset ordinary (W-2) income if you actively participate and your MAGI is under $100k (phasing out to $0 by $150k); unused losses carry forward. On sale, claimed depreciation is recaptured at up to 25%, and gains may owe capital-gains tax (a 1031 exchange can defer both). Figures are a year-1 estimate at your 24.0% rate — not tax advice; consult a CPA.
Schools (NCES district)
- District
- Kalkaska Public Schools
- NCES district ID
- 2620050
- Math proficiency
- 24% ▼ -8.00%
- Reading proficiency
- 38% ▬ 0.00%
- Median HH income
- $40,055
- Composite
- 26.03/100
- National rank
- #7308
- State rank
- #356 of 540 in MI
Livability — Kalkaska
- Score
- 73/100
- State rank
- #203
- US rank
- #5163
Category grades
Schools grade is shown separately in the Schools card above.
Census & demographics
- Population (ZIP)
- 8,573
Population outlook (Kalkaska County) Hauer SSP2
- Today (2025)
- 17,359 people
- By 2030
- 17,222 · -0.8%
- By 2040
- 16,643 · -4.1%
- By 2050
- 15,810 · -8.9%
- By 2075
- 13,772 · -20.7%
- By 2100
- 10,976 · -36.8%
Race, ethnicity, and origin ACS 2023
- Neighborhood character
- Predominantly White (91%)
- Race & ethnicity
- White 91% Two or more races 4% Hispanic / Latino 3%
- Common ancestry
- Romanian 6% Lithuanian 3% Iranian 3%
- Foreign-born
- 1% · Canada
- Languages at home
- 97% English-only · Spanish 2% Other Indo-European 1%
Political lean MEDSL · Kalkaska
- 2024 margin
- Solid R (+42.9) · D 27.8% · R 70.7% · Other 1.5%
- 2008→2024 swing
- -34.1pp toward R · 2008: -8.8pp · 2024: -42.9pp
- All cycles
- 2024: R+42.9 2020: R+41.7 2016: R+44.1 2012: R+19.7 2008: R+8.8
Not yet ingested
- Civics
- —
Market trends
- HPI YoY
- ▼ -158.61%
- Current HPI
- 290.8403
- Rent YoY
- —
- Metro
- —
- State GDP YoY
- ▲ 1.37%
- F500 in state
- 28
Industry mix (Fortune 500 HQ in MI)
| Industry | F500 HQs | Revenue |
|---|---|---|
| Automotive Parts | 3 | $48B |
|
||
| Automotive | 2 | $372B |
|
||
| Chemicals | 1 | $45B |
|
||
| Automotive Retail | 1 | $29B |
|
||
| Healthcare / Medical Devices | 1 | $23B |
|
||
| Automotive Technology | 1 | $20B |
|
||
Price history
+1455.6% since first listed10 events — show timeline
- 2026-06-16 Listed $154,000 REALCOMP
- 2026-06-16 Listed $154,000 MiRealSource-MiMLS
- 2012-05-11 Sold (MLS) $25,000 MiRealSource-MiMLS
- 2012-03-14 Listed $27,200 MiRealSource-MiMLS
- 2012-02-27 Listing Removed — MiRealSource-MiMLS
- 2012-02-17 Listed $27,000 MiRealSource-MiMLS
- 2012-01-27 Listing Removed — MiRealSource-MiMLS
- 2011-12-09 Listed $28,500 MiRealSource-MiMLS
- 2011-11-04 Sold (MLS) $9,900 MiRealSource-MiMLS
- 2011-08-18 Listed $9,900 MiRealSource-MiMLS
Property tax history
+2.6%/yrLatest (2025): $841 · +1.9% YoY. Source: county tax records.
Cash-flow waterfall
monthlySold comps — $/sqft
last 12 mo · ≤1 miLoading sold comps…