143 W Forest View Ln · Henrietta, NC
Flood risk 1/10 · Minimal
- FEMA flood zone
- X (unshaded)
- Chance of flooding over 30 yrs
- 0.0%
- Est. flood insurance / yr
- $507 – $1,088
Fire risk 5/10 · Moderate
- Est. fire insurance / yr
- $906 – $1,684
Heat risk 6/10 · Moderate
- Hot days now (above 105°F)
- 7 days/yr
- Hot days in 30 yrs
- 17 days/yr
Wind risk 2/10 · Minimal
- Chance of severe wind over 30 yrs
- 1.0%
Air-quality risk 3/10 · Minor
- Unhealthy air days now
- 3 days/yr
- Unhealthy air days in 30 yrs
- 4 days/yr
Risk factors via First Street. Map © Google.
Why this score? — see what drove the B- grade
The composite is a weighted blend of 9 inputs, each scored 0–100. Each bar is that input's sub-score; the figure is the points it added to the 100-point composite (weight × sub-score).
- Cash flow +30.0/30.0
- 1% rule +10.0/10.0
- DSCR +10.0/10.0
- ARV discount +7.5/15.0
- Condition / age +3.8/5.0
- Schools +3.6/10.0
- Rent growth +2.5/5.0
- Livability +2.1/5.0
- Appreciation +0.0/10.0
$60,000
🖨 Deal sheet (PDF) 📄 Offer letter ✓ Due diligence
Listing remarks
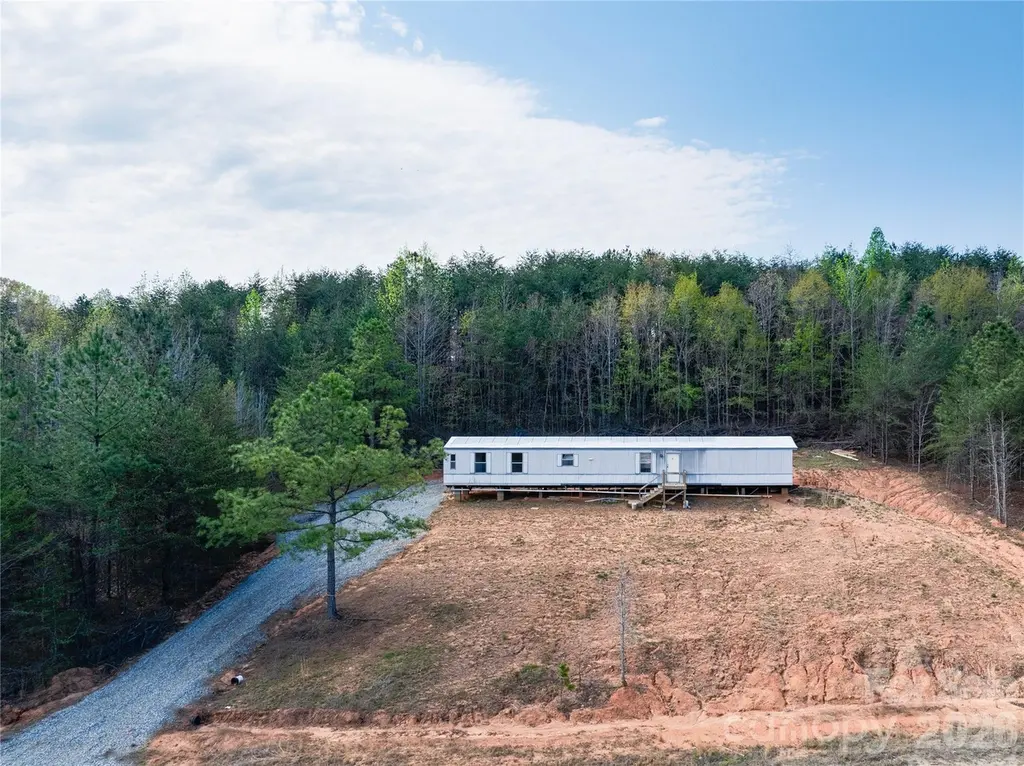
Investor Special with Major Upside Potential! This 2000 Redman single wide presents an excellent opportunity for investors, flippers, or those looking to build equity through finishing touches. Situated on a generous . 58-acre lot with a newly installed gravel driveway and conveniently located just minutes from the South Carolina border, this property offers both accessibility and the appeal of quiet country living. The home is already well underway through a full renovation, with fresh sheetrock installed throughout and a beautifully updated kitchen featuring new cabinetry and countertops. Both bathrooms have been upgraded, including a refreshed primary bath with new vanity, toilet, and tu
Key facts
- Full renovation
- Updated kitchen
- New cabinetry
Tags
Property features AI
Finance
- HOA & community: No HOA
Exterior
- Parking: Driveway
- Utilities: City water (and other — see remarks); Septic installed
- Home design: Manufactured singlewide residence; One story
- Construction: Manufactured construction; Metal construction materials; Metal roof; No foundation details listed
- Exterior features: Gravel road access; Private maintained road
Interior
- Kitchen: No appliances listed
- Bedrooms: Three bedrooms located on the main level
- Bathrooms: Two full bathrooms (both on the main level)
- Heating & cooling: No heating system listed; No cooling system listed
- Interior features: Three total rooms (room count 3); Walk-in closet(s)
- Laundry & utility: Mud room; No laundry appliances listed
Neighborhood map
What this means for you Summary
Snapshot
- This is a 3-bed/2.0-bath single-family listed at $60k. Condition is rated good.
Deal economics
- At list price, monthly cash flow is $425 ($5k/yr) — positive.
- The deal already cash-flows at list — no discount required.
- Meets the 1% rule at list price ($1k rent vs $60k).
- Recommended offer: $56k (6.0% below list) — sets the bar for market timing.
Location & tenants
- Location reads 42/100 on livability (#727 in NC) — a working-class tenant base; expect higher turnover. Strengths: cost of living A+, crime A; Watch: amenities F, commute F, employment F.
- Rutherford County Schools (rural): math 43% / reading 44% proficiency, ranked #98 of 178 in NC (top 55%) — families likely to look elsewhere, expect single-tenant / working-renter base with shorter leases; 60% free/reduced lunch — lower-income household profile, screen leases tightly.
- Zoned schools: Cliffside Elementary School (math 52% / reading 47%, grade D, #417 of 1,410 statewide, top 32%, 213 students, 99% FRL); Chase Middle School (math 35% / reading 47%, grade F, #209 of 475 statewide, top 45%, 501 students, 99% FRL); Chase High School (math 67% / reading 47%, grade C, #248 of 535 statewide, top 48%, 660 students, 99% FRL) — zoned schools average 99% FRL vs 60% district-wide (39 pts higher); higher-poverty schools than district average — tighter screening recommended.
- Market conditions: 53 active listings in the ZIP; 193 units permitted in Rutherford County in 2024 (0 in 5+ unit buildings).
Forward outlook
- Local home prices are declining (-3.0%/yr); year-one equity from $415 of loan paydown is wiped out by about $2k of value loss. Plan a longer hold.
- Rutherford County population projected at -17% by 2050 — secular population decline; favor cash flow + early exit over multi-decade hold.
- At projected returns (-3.0% appreciation + 3.0% rent growth), your $17k cash investment doubles in ~4 years — after that, you're playing with house money.
Negotiation context
- It's been on market 70 days — a 6% lower offer ($56k) is reasonable based on typical stale-listing flexibility.
- 2 sale attempts; this cycle's ask has dropped $9k (13%) from the opening price — seller is motivated, your offer sets the floor, not the list.
Risks & watch-outs
- Climate carrying-cost: moderate wildfire risk; extreme-heat days projected 7→17/yr by 2055 (HVAC capex compounding) — expect insurance premiums to compound above CPI over the hold.
Questions for the listing agent
- It's been on market 70 days. Have you received any prior offers? Is the seller open to a 6% concession, seller financing, or rate buy-down credit?
- Why hasn't it sold? Are there any deal-killer items the seller is aware of (foundation, flood, title, zoning, code violations)?
- Is there a deadline driving the sale (1031 exchange, divorce, estate, relocation)? That informs how much negotiation room exists.
- Schools are F-rated, which usually means shorter tenancies and higher turnover. Who's the typical renter profile here, and what's been the actual vacancy rate?
- What's the average days-on-market for RENTAL listings here right now (not sales)? A rising rental-DOM trend means longer vacancies and softer asking-rent achievability than the comps imply.
- What's the recent tenant-quality profile in this submarket — average credit score on applications, eviction rate, late-payment / NSF rate, and stable-employment percentage? A property-management company in the area should have these aggregated.
- How much new for-sale + rental construction is in the pipeline within 1–3 miles? Heavy new supply typically softens prices + rents 12–24 months out; constrained supply supports both.
Investment metrics
- 1% rule
- 1.77% ✓
- Cap rate
- 14.79%
- Cash-on-cash
- 30.33%
- DSCR
- 2.35
- GRM
- 4.7
CMA / ARV
- ARV (on-the-fly)
- $193,200
- Comps found
- 1
Show comp detail 1 sale within ~0.75 mi
| Address | Dist | Beds/Ba | Sqft | Sold | Price | $/sf | Match |
|---|---|---|---|---|---|---|---|
| 726 Goodes Creek Church Rd | 0.70mi | 3/2.0 | 926 (-12%) | 16mo | $170,000 | $184 | 34 |
Match score weights: distance 35% · size 25% · config 20% · recency 20%. Top-matched comps best support the ARV.
Projected returns pro-forma
-3.0% appreciation · 3.0% rent growth · sell at horizon
- IRR
- 25.0%
- Equity multiple
- 2.03×
- Total profit
- $17,341
- Equity at exit
- $8,946
- IRR
- 32.8%
- Equity multiple
- 3.98×
- Total profit
- $49,994
- Equity at exit
- $5,188
Cash invested: $16,800 (down + closing). Projections, not guarantees.
Landlord ↔ Tenant lean methodology
- Overall (STATE)
- 85 Strongly Landlord-Friendly
- State North Carolina
- 85 Strongly Landlord-Friendly · R+3
- County
- — inherits STATE
- City
- — inherits STATE
ZIP-level market 28114
- Home prices YoY
- -11.8%
- Active inventory
- 53
- Price-to-rent
- 4.7×
Monthly cashflow live
- Estimated rent
- $1,062 medium interval (Pro) →
- Mortgage (P&I)
- −$315
- Tax est. 1.5%
- −$75 /mo · $900/yr
- Insurance
- −$25
- HOA
- −$0
- Lot rent
- −$0
- Vacancy / Maint / Mgmt
- −$223
- Net cashflow
- $425
Break-even live
Sensitivity live
| Price | -10% $466 | -5% $445 | +0% $425 | +5% $404 | +10% $383 |
|---|---|---|---|---|---|
| Rent | -10% $341 | -5% $383 | +0% $425 | +5% $467 | +10% $509 |
| Rate | -1.0pp $455 | -0.5pp $440 | base $425 | +0.5pp $409 | +1.0pp $393 |
UW: 25.0% down · 7.5% · 30yr · 1.5% tax · 5.0% vac · 8.0% maint · 8.0% mgmt
Financing live
Cash to close
- Down payment
- $15,000
- Closing costs
- $1,800
- Reserves months
- —
- Total cash needed
- —
Loan-product check · same deal, 3 products live
Conventional
25% down · 7.5% · 30yr
- Down + closing
- —
- Monthly P&I
- —
- Monthly cashflow
- —
- DSCR
- —
- Eligible?
- —
Personal DTI + credit; lowest rate.
DSCR
20% down · 8.5% · 30yr
- Down + closing
- —
- Monthly P&I
- —
- Monthly cashflow
- —
- DSCR
- —
- Eligible?
- —
No personal income docs; deal must DSCR.
Hard money
10% down · 12.0% · 12mo
- Down + closing
- —
- Monthly P&I
- —
- Monthly cashflow
- —
- DSCR
- —
- Eligible?
- —
Short-term bridge; refi at stabilization.
Listing history 12 events
-
2026-06-13statusdays on market $60,000 Pending 70 DOM
-
2026-06-10days on market $60,000 Active 69 DOM
-
2026-06-09days on market $60,000 Active 68 DOM
-
2026-06-08days on market $60,000 Active 67 DOM
-
2026-06-07pricedays on market $60,000 Active 66 DOM
-
2026-06-02days on market $64,800 Active 61 DOM
-
2026-06-01days on market $64,800 Active 60 DOM
-
2026-05-31days on market $64,800 Active 59 DOM
-
2026-05-30days on market $64,800 Active 58 DOM
-
2026-05-06price $64,800
-
2026-04-02$69,000 Active
-
2026-01-23$75,000 Active
ⓘ Source: listings_history table (triggers on properties + properties_extension) + one-shot
backfill from property_details.listing_events for pre-trigger history.
Climate risk First Street
- Flood 1/10 Low FEMA zone X (unshaded) · 0% chance over 30 yrs
- Wildfire 5/10 Major
- Heat 6/10 Major 7 d/yr ≥105°F today · 17 d/yr by 30 yrs out
- Wind 2/10 Low 100% chance of damaging wind over 30 yrs
- Air quality 3/10 Moderate 3 unhealthy d/yr today · 4 by 30 yrs out
Nearby sold comps map
Loading sold comps map…
Walkable amenities ~0.75 mi
Loading nearby amenities…
Taxation est. · year 1
- Rental income
- $12,749
- − Mortgage interest
- −$3,361
- − Property taxes
- −$900
- − Insurance
- −$300
- − Repairs & maintenance
- −$1,020
- − Management
- −$1,020
- − Depreciation
- −$1,745
- Taxable income
- $4,403
- Est. tax owed @ 24.0%
- −$1,057
- After-tax cash flow
- $4,039/yr
For passive investors: Depreciation is non-cash, so a rental often shows a tax loss while cash-flowing — sheltering income. Rental losses are passive: they offset passive income freely, and up to $25,000/yr can offset ordinary (W-2) income if you actively participate and your MAGI is under $100k (phasing out to $0 by $150k); unused losses carry forward. On sale, claimed depreciation is recaptured at up to 25%, and gains may owe capital-gains tax (a 1031 exchange can defer both). Figures are a year-1 estimate at your 24.0% rate — not tax advice; consult a CPA.
Condition & rehab AI · 12 photos
This 2000 Redman single wide is in good condition with moderate renovations underway. It offers a great opportunity for investors to complete the finishing touches and increase its value.
Value-add opportunities
- Both Paint interior walls and trim — Enhances curb appeal and interior aesthetics
- Both Install flooring (e.g., hardwood or tile) — Improves living space and adds value
- Both Install new windows (if needed) — Enhances natural light and energy efficiency
- Both Install new HVAC system — Improves comfort and energy efficiency
- Both Landscaping and curb appeal — Enhances curb appeal and adds value
Renovation cost estimate screening
Value-add ROI direction
- Both Paint interior walls and trim — Enhances curb appeal and interior aesthetics ↑
- Both Install flooring (e.g., hardwood or tile) — Improves living space and adds value ↑
- Both Install new windows (if needed) — Enhances natural light and energy efficiency ↑
- Both Install new HVAC system — Improves comfort and energy efficiency ↑
- Both Landscaping and curb appeal — Enhances curb appeal and adds value ↑
ⓘ Cost ranges are severity-bucket heuristics (US national rule-of-thumb). Get contractor quotes + a written scope before underwriting a rehab budget.
Schools (NCES district)
- District
- Rutherford County Schools
- NCES district ID
- 3704080
- Math proficiency
- 43% ▼ -1.00%
- Reading proficiency
- 44% ▼ -2.00%
- Median HH income
- $36,490
- Composite
- 36.11/100
- National rank
- #4753
- State rank
- #98 of 178 in NC
Livability — Henrietta
- Score
- 42/100
- State rank
- #727
- US rank
- #27079
Category grades
Schools grade is shown separately in the Schools card above.
Census & demographics
- City population
- 273
- Population (ZIP)
- 7,568
Population outlook (Rutherford County) Hauer SSP2
- Today (2025)
- 63,695 people
- By 2030
- 61,670 · -3.2%
- By 2040
- 57,212 · -10.2%
- By 2050
- 52,763 · -17.2%
- By 2075
- 44,493 · -30.1%
- By 2100
- 38,127 · -40.1%
Race, ethnicity, and origin ACS 2023
- Neighborhood character
- Predominantly White (91%)
- Race & ethnicity
- White 91% Hispanic / Latino 5% Black 3% Two or more races 2%
- Hispanic origin (detail)
- Mexican 5%
- Common ancestry
- Romanian 2% Serbian 2% Lithuanian 1%
- Foreign-born
- 3% · Canada
- Languages at home
- 96% English-only · Spanish 3%
Political lean MEDSL · Rutherford
- 2024 margin
- Solid R (+47.8) · D 25.8% · R 73.6%
- 2008→2024 swing
- -16.0pp toward R · 2008: -31.8pp · 2024: -47.8pp
- All cycles
- 2024: R+47.8 2020: R+45.8 2016: R+47.9 2012: R+33.5 2008: R+31.8
Not yet ingested
- Civics
- —
Market trends
- HPI YoY
- ▼ -33.57%
- Current HPI
- 249.8113
- Rent YoY
- —
- Metro
- —
- State GDP YoY
- ▲ 3.28%
- F500 in state
- 26
Industry mix (Fortune 500 HQ in NC)
| Industry | F500 HQs | Revenue |
|---|---|---|
| Financial Services | 2 | $213B |
|
||
| Retail | 2 | $95B |
|
||
| Industrial Conglomerate | 1 | $38B |
|
||
| Metals / Steel | 1 | $35B |
|
||
| Utilities | 1 | $30B |
|
||
| Industrial Machinery | 1 | $19B |
|
||
Price history
-13.6% since first listed3 events — show timeline
- 2026-05-06 Price Changed $64,800 CANOPYMLS as Distributed by MLS Grid
- 2026-04-02 Listed $69,000 CANOPYMLS as Distributed by MLS Grid
- 2026-01-23 Listed $75,000 CANOPYMLS as Distributed by MLS Grid
Cash-flow waterfall
monthlySold comps — $/sqft
last 12 mo · ≤1 miLoading sold comps…