7841 Doctor Strange Dr · Corpus Christi, TX
Flood risk No data
- FEMA flood zone
- —
- Chance of flooding over 30 yrs
- —
- Est. flood insurance / yr
- —
Fire risk No data
- Est. fire insurance / yr
- —
Heat risk No data
- Hot days now (above threshold)
- —
- Hot days in 30 yrs
- —
Wind risk No data
- Chance of severe wind over 30 yrs
- —
Air-quality risk No data
- Unhealthy air days now
- —
- Unhealthy air days in 30 yrs
- —
Risk factors via First Street. Map © Google.
Why this score? — see what drove the F grade
The composite is a weighted blend of 9 inputs, each scored 0–100. Each bar is that input's sub-score; the figure is the points it added to the 100-point composite (weight × sub-score).
- Cash flow +8.8/30.0
- ARV discount +7.5/15.0
- Livability +3.9/5.0
- Rent growth +3.0/5.0
- Schools +2.8/10.0
- 1% rule +2.7/10.0
- Condition / age +2.5/5.0
- DSCR +2.4/10.0
- Appreciation +0.0/10.0
$324,999
🖨 Deal sheet (PDF) 📄 Offer letter ✓ Due diligence
Listing remarks
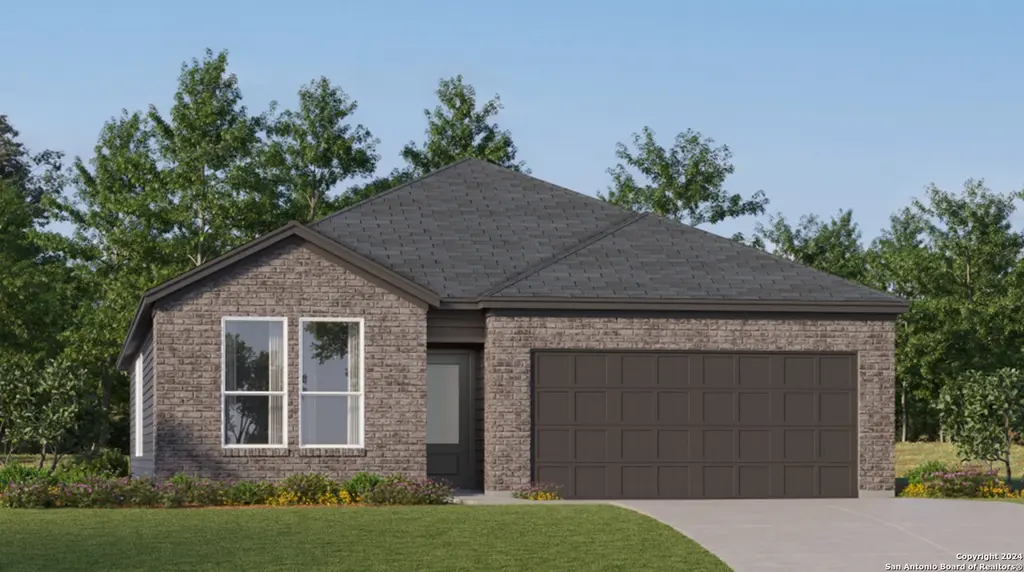
The Navarre- This new single-level home boasts a modern and low-maintenance design. Three secondary bedrooms are located off the foyer, with a nearby study perfect for focusing on important tasks throughout the week. An inviting open-concept living area combines the kitchen, living and dining areas, with a nearby covered patio ready for outdoor entertainment and leisure. A lavish owner's suite completes the home, offering direct access to an en-suite bathroom and generous walk-in closet. Prices and features may vary and are subject to change. Photos are for illustrative purposes only. Estimated Completion April 2026. The completion date, prices and features may vary and are subject to chang
Key facts
- Study
- Walk-in closet
- Covered patio
Tags
Neighborhood map
What this means for you Summary
Snapshot
- This is a 4-bed/3.0-bath land listed at $325k.
Deal economics
- At list price, monthly cash flow is $-268 ($-3k/yr) — negative.
- To cash-flow at today's rent, offer at most $286k (12.0% below list).
- To meet the 1% rule (rent ≥ 1% of price), the offer needs to be $250k (23.0% below list).
- Recommended offer: $250k (23.0% below list) — sets the bar for 1% rule.
- Cap rate 5.3% vs local median 3.6% in Corpus Christi — top-decile yield for the area; either an underpriced asset or a hidden risk that comps aren't pricing in. Stress-test before assuming the spread holds.
Location & tenants
- Location reads 78/100 on livability (#66 in TX, #2,404 nationally) — a middle-class / working-renter tenant base. Strengths: commute A+, cost of living A+, housing A+; Watch: crime F.
- Corpus Christi ISD (urban): math 31% / reading 35% proficiency, ranked #562 of 826 in TX (top 68%) — families likely to look elsewhere, expect single-tenant / working-renter base with shorter leases; 63% free/reduced lunch — lower-income household profile, screen leases tightly.
- Zoned schools: Kolda El (math 51% / reading 59%, grade C, #602 of 4,322 statewide, top 14%, 879 students, 36% FRL); Adkins Middle (math 40% / reading 39%, grade F, #660 of 1,662 statewide, top 41%, 956 students, 48% FRL); Veterans Memorial H S (math 50% / reading 57%, grade C-, #428 of 1,632 statewide, top 27%, 1,949 students, 36% FRL) — zoned schools average 40% FRL vs 63% district-wide (23 pts lower); this property's tenant base skews higher-income than the district average.
- Zoned-school proficiency averages 49% at this address vs 33% district-wide (+16 pts) — the actual schools serving this property are materially stronger than the Corpus Christi ISD average implies; a family-tenant draw the district grade alone would hide.
- Market conditions: Rents rising (+1.9%/yr); 623 active listings in the ZIP; 20 comparable units currently listed for rent nearby; rentals at typical pace (median 23d on market — plan ~3-4 weeks tenant-placement turnaround); solid renter incomes; 1,397 units permitted in Nueces County in 2024 (47 in 5+ unit buildings).
- This rent runs 30% of the median local income ($99k/yr) — at the standard rent-burdened threshold; future hikes will face affordability resistance.
Forward outlook
- Local home prices are declining (-3.0%/yr); year-one equity from $2k of loan paydown is wiped out by about $10k of value loss. Plan a longer hold.
- Nueces County population projected at +36% by 2050 — long-run rental-demand tailwind backs the buy-and-hold thesis.
Negotiation context
- It's been on market 24 days — a 2% lower offer ($320k) is reasonable based on typical stale-listing flexibility.
Questions for the listing agent
- What do current leases actually rent for vs. the listed asking? Can we see a recent rent roll and the last 12 months of T-12 income?
- Is there a deadline driving the sale (1031 exchange, divorce, estate, relocation)? That informs how much negotiation room exists.
- Crime grade is F in this area — have there been break-ins, vandalism, or insurance claims at this property in the last 3 years? What carrier currently insures it and at what premium?
- The area grade is low — what's the realistic commute time and amenity access for the typical tenant pool here? Any planned neighborhood developments (good or bad) we should know about?
- What's the average days-on-market for RENTAL listings here right now (not sales)? A rising rental-DOM trend means longer vacancies and softer asking-rent achievability than the comps imply.
- What's the recent tenant-quality profile in this submarket — average credit score on applications, eviction rate, late-payment / NSF rate, and stable-employment percentage? A property-management company in the area should have these aggregated.
- How much new for-sale + rental construction is in the pipeline within 1–3 miles? Heavy new supply typically softens prices + rents 12–24 months out; constrained supply supports both.
Investment metrics
- 1% rule
- 0.77% ✗
- Cap rate
- 5.30%
- Cash-on-cash
- -3.54%
- DSCR
- 0.84
- GRM
- 10.8
CMA / ARV
No comps found within radius.
Projected returns pro-forma
-3.0% appreciation · 1.94% rent growth · sell at horizon
- IRR
- -23.4%
- Equity multiple
- 0.20×
- Total profit
- $-72,369
- Equity at exit
- $48,458
- IRR
- -21.2%
- Equity multiple
- -0.05×
- Total profit
- $-95,496
- Equity at exit
- $28,100
Cash invested: $91,000 (down + closing). Projections, not guarantees.
Landlord ↔ Tenant lean methodology
- Overall (STATE)
- 87 Strongly Landlord-Friendly
- State Texas
- 87 Strongly Landlord-Friendly · R+5
- County
- — inherits STATE
- City
- — inherits STATE
ZIP-level market 78414
- Home prices YoY
- -18.1%
- Rents YoY
- 1.9%
- Active inventory
- 623
- Price-to-rent
- 10.8×
Monthly cashflow live
- Estimated rent
- $2,503 high interval (Pro) →
- Mortgage (P&I)
- −$1,704
- Tax est. 1.5%
- −$406 /mo · $4,875/yr
- Insurance
- −$135
- HOA
- −$0
- Vacancy / Maint / Mgmt
- −$526
- Net cashflow
- $-268
Break-even live
Sensitivity live
| Price | -10% $-44 | -5% $-156 | +0% $-268 | +5% $-381 | +10% $-493 |
|---|---|---|---|---|---|
| Rent | -10% $-466 | -5% $-367 | +0% $-268 | +5% $-170 | +10% $-71 |
| Rate | -1.0pp $-105 | -0.5pp $-186 | base $-268 | +0.5pp $-353 | +1.0pp $-438 |
UW: 25.0% down · 7.5% · 30yr · 1.5% tax · 5.0% vac · 8.0% maint · 8.0% mgmt
Financing live
Cash to close
- Down payment
- $81,250
- Closing costs
- $9,750
- Reserves months
- —
- Total cash needed
- —
Loan-product check · same deal, 3 products live
Conventional
25% down · 7.5% · 30yr
- Down + closing
- —
- Monthly P&I
- —
- Monthly cashflow
- —
- DSCR
- —
- Eligible?
- —
Personal DTI + credit; lowest rate.
DSCR
20% down · 8.5% · 30yr
- Down + closing
- —
- Monthly P&I
- —
- Monthly cashflow
- —
- DSCR
- —
- Eligible?
- —
No personal income docs; deal must DSCR.
Hard money
10% down · 12.0% · 12mo
- Down + closing
- —
- Monthly P&I
- —
- Monthly cashflow
- —
- DSCR
- —
- Eligible?
- —
Short-term bridge; refi at stabilization.
Rent comps 20 comps
| Address | Beds | Baths | Sqft | Rent | $/sqft | DOM | Units | Dist |
|---|---|---|---|---|---|---|---|---|
| 7926 Doctor Strange Dr Corpus Christi, TX | 4.0 | 3.0 | 2196 | $2,400 | $1.09 | 23d | 1 | 0.03mi |
| 7925 Wonder Woman Dr Corpus Christi, TX | 4.0 | 3.0 | 1910 | $2,400 | $1.26 | 15d | 1 | 0.06mi |
| 7710 Thor Dr Corpus Christi, TX | 4.0 | 2.5 | 1900 | $2,395 | $1.26 | 15d | 1 | 0.14mi |
| 7705 Wonder Woman Dr Corpus Christi, TX | 3.0 | 2.0 | 1663 | $2,000 | $1.20 | 15d | 1 | 0.15mi |
| 7702 Spiderman Dr Corpus Christi, TX | 4.0 | 2.0 | 1639 | $2,400 | $1.46 | 23d | 1 | 0.20mi |
| 7702 Hulk Dr Corpus Christi, TX | 4.0 | 3.0 | 2373 | $4,000 | $1.69 | 45d | 1 | 0.24mi |
| 7713 Lariat Toss Dr Corpus Christi, TX | 3.0 | 2.0 | 1518 | $2,300 | $1.52 | 45d | 1 | 0.45mi |
| 7610 Rustler Ln Corpus Christi, TX | 3.0 | 2.0 | 1584 | $2,150 | $1.36 | 23d | 1 | 0.54mi |
| 7822 Fort Griffen Dr Corpus Christi, TX | 3.0 | 2.0 | 1618 | $2,100 | $1.30 | 15d | 1 | 0.65mi |
| 7230 Tristan Dr Corpus Christi, TX | 4.0 | 2.0 | 1838 | $2,395 | $1.30 | 45d | 1 | 0.69mi |
| 7230 Bryson Way Corpus Christi, TX | 4.0 | 2.0 | 1884 | $2,500 | $1.33 | 45d | 1 | 0.71mi |
| 8218 Merlin Pl Corpus Christi, TX | 4.0 | 2.0 | 2088 | $2,300 | $1.10 | 15d | 1 | 1.12mi |
| 3810 Los Arroyos Dr Corpus Christi, TX | 3.0 | 2.0 | 1578 | $2,300 | $1.46 | 23d | 1 | 1.14mi |
| 6865 La Salle Dr Corpus Christi, TX | 4.0 | 2.0 | 2186 | $3,000 | $1.37 | 45d | 1 | 1.21mi |
| 7710 Bison Dr Corpus Christi, TX | 4.0 | 2.5 | 2298 | $3,000 | $1.31 | 23d | 1 | 1.30mi |
| 6802 Crosswinds Dr Corpus Christi, TX | 4.0 | 3.0 | 2374 | $3,150 | $1.33 | 45d | 1 | 1.34mi |
| 3617 Garnet Ct Corpus Christi, TX | 4.0 | 2.0 | 1758 | $2,125 | $1.21 | 45d | 1 | 1.34mi |
| 3614 Sapphire Ct Corpus Christi, TX | 4.0 | 2.5 | 1998 | $2,195 | $1.10 | 15d | 1 | 1.37mi |
| 8226 Excalibur Rd Corpus Christi, TX | 3.0 | 2.0 | 1792 | $2,250 | $1.26 | 15d | 1 | 1.44mi |
| 8314 Excalibur Rd Corpus Christi, TX | 4.0 | 2.0 | 2047 | $2,600 | $1.27 | 15d | 1 | 1.48mi |
Listing history 7 events
-
2026-04-14status Pending
-
2026-04-09price $324,999
-
2026-04-04price $326,999
-
2026-04-03price $325,999
-
2026-04-02price $330,999
-
2026-03-24price $340,999
-
2026-03-20$339,999 New
ⓘ Source: listings_history table (triggers on properties + properties_extension) + one-shot
backfill from property_details.listing_events for pre-trigger history.
Nearby sold comps map
Loading sold comps map…
Walkable amenities ~0.75 mi
Loading nearby amenities…
Taxation est. · year 1
- Rental income
- $30,038
- − Mortgage interest
- −$18,205
- − Property taxes
- −$4,875
- − Insurance
- −$1,625
- − Repairs & maintenance
- −$2,403
- − Management
- −$2,403
- − Depreciation
- −$9,455
- Taxable loss
- −$8,928
- Est. tax savings @ 24.0%
- +$2,143
- After-tax cash flow
- $-1,079/yr
For passive investors: Depreciation is non-cash, so a rental often shows a tax loss while cash-flowing — sheltering income. Rental losses are passive: they offset passive income freely, and up to $25,000/yr can offset ordinary (W-2) income if you actively participate and your MAGI is under $100k (phasing out to $0 by $150k); unused losses carry forward. On sale, claimed depreciation is recaptured at up to 25%, and gains may owe capital-gains tax (a 1031 exchange can defer both). Figures are a year-1 estimate at your 24.0% rate — not tax advice; consult a CPA.
Schools (NCES district)
- District
- Corpus Christi ISD
- NCES district ID
- 4815270
- Math proficiency
- 31% ▼ -18.00%
- Reading proficiency
- 35% ▼ -7.00%
- Median HH income
- $45,672
- Composite
- 28.27/100
- National rank
- #6793
- State rank
- #562 of 826 in TX
Livability — Corpus Christi
- Score
- 78/100
- State rank
- #66
- US rank
- #2404
Category grades
Schools grade is shown separately in the Schools card above.
Census & demographics
- Census place
- Corpus Christi, TX
- County
- Nueces County · 296,836 people
- City population
- 296,836
- Metro
- Corpus Christi, TX
- Population (ZIP)
- 54,263
- Household income
- $98,771
- Rent vs Own
- Severe rent burden
- 1167.0
Population outlook (Nueces County) Hauer SSP2
- Today (2025)
- 418,037 people
- By 2030
- 447,123 · +7.0%
- By 2040
- 505,911 · +21.0%
- By 2050
- 567,522 · +35.8%
- By 2075
- 729,686 · +74.6%
- By 2100
- 847,087 · +102.6%
Race, ethnicity, and origin ACS 2023
- Neighborhood character
- Diverse neighborhood (Simpson 0.60)
- Race & ethnicity
- Hispanic / Latino 52% White 35% Two or more races 33% Asian 6% Black 3%
- Hispanic origin (detail)
- Mexican 46% Puerto Rican 1%
- Common ancestry
- Lithuanian 1% Slovak 1% Romanian 1%
- Foreign-born
- 9% · Canada, China, South Korea
- Languages at home
- 70% English-only · Spanish 24% Other Indo-European 2% Chinese 1%
Political lean MEDSL · Nueces
- 2024 margin
- R (+11.5) · D 43.8% · R 55.3%
- 2008→2024 swing
- -7.1pp toward R · 2008: -4.4pp · 2024: -11.5pp
- All cycles
- 2024: R+11.5 2020: R+2.9 2016: R+1.5 2012: R+3.2 2008: R+4.4
Not yet ingested
- Civics
- —
Market trends
- HPI YoY
- ▼ -40.16%
- Current HPI
- 182.3229
- Rent YoY
- ▲ 1.94%
- Metro
- Corpus Christi, TX
- State GDP YoY
- ▲ 3.95%
- F500 in state
- 110
Industry mix (Fortune 500 HQ in TX)
| Industry | F500 HQs | Revenue |
|---|---|---|
| Energy | 16 | $1,198B |
|
||
| Technology | 5 | $198B |
|
||
| Engineering / Construction | 4 | $72B |
|
||
| Energy Services | 3 | $60B |
|
||
| Utilities | 3 | $41B |
|
||
| Healthcare | 2 | $330B |
|
||
Price history
-4.4% since first listed7 events — show timeline
- 2026-04-14 Pending — LERA
- 2026-04-09 Price Changed $324,999 LERA
- 2026-04-04 Price Changed $326,999 LERA
- 2026-04-03 Price Changed $325,999 LERA
- 2026-04-02 Price Changed $330,999 LERA
- 2026-03-24 Price Changed $340,999 LERA
- 2026-03-20 Listed $339,999 LERA
Cash-flow waterfall
monthlySold comps — $/sqft
last 12 mo · ≤1 miLoading sold comps…