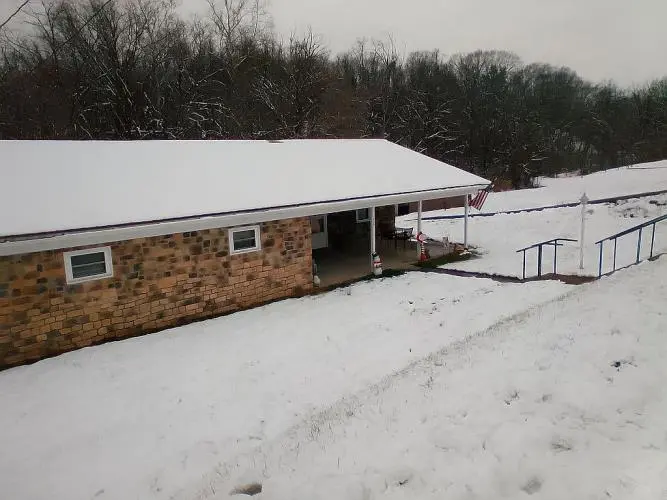
435 1st Ave · Burnham, PA
Flood risk 9/10 · Severe
- FEMA flood zone
- X (unshaded)
- Chance of flooding over 30 yrs
- 0.99%
- Est. flood insurance / yr
- $507 – $1,088
Fire risk 2/10 · Minimal
- Est. fire insurance / yr
- $511 – $949
Heat risk 4/10 · Minor
- Hot days now (above 98°F)
- 7 days/yr
- Hot days in 30 yrs
- 17 days/yr
Wind risk 2/10 · Minimal
- Chance of severe wind over 30 yrs
- —
Air-quality risk 2/10 · Minimal
- Unhealthy air days now
- 0 days/yr
- Unhealthy air days in 30 yrs
- 1 days/yr
Risk factors via First Street. Map © Google.
Why this score? — see what drove the A- grade
The composite is a weighted blend of 9 inputs, each scored 0–100. Each bar is that input's sub-score; the figure is the points it added to the 100-point composite (weight × sub-score).
- Cash flow +30.0/30.0
- ARV discount +15.0/15.0
- DSCR +10.0/10.0
- Appreciation +9.2/10.0
- 1% rule +8.3/10.0
- Livability +3.6/5.0
- Schools +3.2/10.0
- Rent growth +2.5/5.0
- Condition / age +2.5/5.0
$150,000
🖨 Deal sheet 📄 Offer letter ✓ Due diligence
Listing remarks MLS
Very cozy home sitting at the end of 1st ave with a bit of privacy and a very nice size yard that includes an extra lot on the deed, the back yard goes to the other side of hungry run Creek so you do own Creek here. the home has a ton of storage space and a block shed building next to home with metal roof also. .The master side is very nice with master bedroom, living room, master bedroom and bathroom all set up for handicapped if necessary, nice size kitchen and dining room area also. This home also has a huge laundry room with many closets on 1 wall for more storage, nice garage and a 30 * 20 metal building added to garage. .Also 1 small carport on property. .. Beautiful property and quiet living in very nice neighborhood, don't miss out, at least take look. . It's a lot of property and home for the money, started out a mobile home but all vins were removed during the last renovation. cash sale or owner financing available under certain conditions and terms set by seller. ..
Key facts
- Extra lot
- Back yard
- Metal roof
Tags
Neighborhood map
What this means for you Summary
Snapshot
- This is a 2-bed/2.0-bath manufactured listed at $150k.
Deal economics
- At list price, monthly cash flow is $509 ($6k/yr) — positive.
- The deal already cash-flows at list — no discount required.
- Meets the 1% rule at list price ($2k rent vs $150k).
- Recommended offer: $132k (12.0% below list) — sets the bar for market timing.
Location & tenants
- Location reads 72/100 on livability (#634 in PA) — a middle-class / working-renter tenant base. Strengths: crime A+, cost of living A+, housing A+; Watch: schools F, amenities F, commute F.
- Mifflin County SD (town): math 28% / reading 49% proficiency, ranked #380 of 539 in PA (top 70%) — families likely to look elsewhere, expect single-tenant / working-renter base with shorter leases.
- Market conditions: 14 active listings in the ZIP; 1 comparable units currently listed for rent nearby; 58 units permitted in Mifflin County in 2024 (0 in 5+ unit buildings).
Forward outlook
- In year one you build about $14k of equity ($1k loan paydown + $12k appreciation (8.3% local appreciation)).
- Mifflin County population projected at -18% by 2050 — secular population decline; favor cash flow + early exit over multi-decade hold.
- At projected returns (8.3% appreciation + 3.0% rent growth), your $42k cash investment doubles in ~3 years — after that, you're playing with house money.
- By year 3, paydown + projected appreciation supports a ~$34k cash-out refi (75% LTV) — recoverable capital for the next deal without selling this one.
Negotiation context
- It's been on market 177 days — a 12% lower offer ($132k) is reasonable based on typical stale-listing flexibility.
- 3 sale attempts since 2y ago with the ask held roughly flat each time — persistent listings suggest the price (not the market) is what's stuck; bring a comps-based counter.
- Current owner paid $100k; list at $150k implies a 50% gain — meaningful room to come down on a strong offer.
Risks & watch-outs
- Watch-outs: flood insurance adds $66/mo.
- Climate carrying-cost: severe flood risk — expect insurance premiums to compound above CPI over the hold.
Questions for the listing agent
- It's been on market 177 days. Have you received any prior offers? Is the seller open to a 12% concession, seller financing, or rate buy-down credit?
- Built in 1965 — when were the roof, HVAC, electrical panel, plumbing, and water heater last replaced?
- What's the actual annual flood-insurance premium (NFIP or private), and is the property in a SFHA with mandatory coverage?
- Why hasn't it sold? Are there any deal-killer items the seller is aware of (foundation, flood, title, zoning, code violations)?
- Is there a deadline driving the sale (1031 exchange, divorce, estate, relocation)? That informs how much negotiation room exists.
- Schools are F-rated, which usually means shorter tenancies and higher turnover. Who's the typical renter profile here, and what's been the actual vacancy rate?
- What's the average days-on-market for RENTAL listings here right now (not sales)? A rising rental-DOM trend means longer vacancies and softer asking-rent achievability than the comps imply.
- What's the recent tenant-quality profile in this submarket — average credit score on applications, eviction rate, late-payment / NSF rate, and stable-employment percentage? A property-management company in the area should have these aggregated.
- How much new for-sale + rental construction is in the pipeline within 1–3 miles? Heavy new supply typically softens prices + rents 12–24 months out; constrained supply supports both.
Investment metrics
- 1% rule
- 1.33% ✓
- Cap rate
- 10.89%
- Cash-on-cash
- 16.43%
- DSCR
- 1.73
- GRM
- 6.2
CMA / ARV
- ARV (median comp)
- $186,160
- List price
- $150,000
- Delta
- -19.42%
- Verdict
- UNDERPRICED
- Comps
- 20 within 1.0 mi
Projected returns pro-forma
8.31% appreciation · 3.0% rent growth · sell at horizon
- IRR
- 31.9%
- Equity multiple
- 3.31×
- Total profit
- $97,216
- Equity at exit
- $117,121
- IRR
- 28.3%
- Equity multiple
- 7.15×
- Total profit
- $258,265
- Equity at exit
- $235,568
Cash invested: $42,000 (down + closing). Projections, not guarantees.
Landlord ↔ Tenant lean methodology
- Overall (STATE)
- 62 Landlord-Friendly
- State Pennsylvania
- 62 Landlord-Friendly · EVEN
- County
- — inherits STATE
- City
- — inherits STATE
ZIP-level market 17009
- Home prices YoY
- 3.5%
- Active inventory
- 14
- Price-to-rent
- 6.2×
Monthly cashflow live
- Estimated rent
- $2,000 medium interval (Pro) →
- Mortgage (P&I)
- −$787
- Tax from tax record
- −$156 /mo · $1,869/yr
- Insurance
- −$62
- Flood insurance flood zone
- −$66 /mo · $798/yr
- HOA
- −$0
- Vacancy / Maint / Mgmt
- −$420
- Net cashflow
- $509
Break-even live
UW: 25.0% down · 7.5% · 30yr · 1.5% tax · 5.0% vac · 8.0% maint · 8.0% mgmt
Financing live
Cash to close
- Down payment
- $37,500
- Closing costs
- $4,500
- Reserves months
- —
- Total cash needed
- —
Loan-product check · same deal, 3 products live
Conventional
25% down · 7.5% · 30yr
- Down + closing
- —
- Monthly P&I
- —
- Monthly cashflow
- —
- DSCR
- —
- Eligible?
- —
Personal DTI + credit; lowest rate.
DSCR
20% down · 8.5% · 30yr
- Down + closing
- —
- Monthly P&I
- —
- Monthly cashflow
- —
- DSCR
- —
- Eligible?
- —
No personal income docs; deal must DSCR.
Hard money
10% down · 12.0% · 12mo
- Down + closing
- —
- Monthly P&I
- —
- Monthly cashflow
- —
- DSCR
- —
- Eligible?
- —
Short-term bridge; refi at stabilization.
Rent comps 1 comps
| Address | Beds | Baths | Sqft | Rent | $/sqft | DOM | Units | Dist |
|---|---|---|---|---|---|---|---|---|
| 203 4th Ave Burnham, PA | 3.0 | 2.0 | 1960 | $2,000 | $1.02 | 43d | 1 | 0.32mi |
Listing history 22 events
-
2026-06-18days on market $150,000 Active 177 DOM
-
2026-06-17days on market $150,000 Active 176 DOM
-
2026-06-16days on market $150,000 Active 175 DOM
-
2026-06-15days on market $150,000 Active 174 DOM
-
2026-06-13days on market $150,000 Active 172 DOM
-
2026-06-12days on market $150,000 Active 171 DOM
-
2026-06-09days on market $150,000 Active 168 DOM
-
2026-06-08days on market $150,000 Active 167 DOM
-
2026-06-08days on market $150,000 Active 166 DOM
-
2026-06-07days on market $150,000 Active 165 DOM
-
2026-06-04days on market $150,000 Active 162 DOM
-
2026-06-02days on market $150,000 Active 161 DOM
-
2026-06-01days on market $150,000 Active 160 DOM
-
2026-05-31days on market $150,000 Active 159 DOM
-
2025-12-22$150,000 Active 992-char remark
Show marketing remark (992 chars)
Very cozy home sitting at the end of 1st ave with a bit of privacy and a very nice size yard that includes an extra lot on the deed, the back yard goes to the other side of hungry run Creek so you do own Creek here. the home has a ton of storage space and a block shed building next to home with metal roof also. .The master side is very nice with master bedroom, living room, master bedroom and bathroom all set up for handicapped if necessary, nice size kitchen and dining room area also. This home also has a huge laundry room with many closets on 1 wall for more storage, nice garage and a 30 * 20 metal building added to garage. .Also 1 small carport on property. .. Beautiful property and quiet living in very nice neighborhood, don't miss out, at least take look. . It's a lot of property and home for the money, started out a mobile home but all vins were removed during the last renovation. cash sale or owner financing available under certain conditions and terms set by seller. ..
-
2025-10-21historical
-
2025-09-04$150,000 Active
-
2025-02-18soldstatus $100,000
-
2025-02-14soldstatus $100,000 Closed
-
2025-02-06status Pending
-
2024-11-15$119,000 Active
-
2019-12-06soldstatus $58,000
ⓘ Source: listings_history table (triggers on properties + properties_extension) + one-shot
backfill from property_details.listing_events for pre-trigger history.
Tax reassessment forecast PA · Partial reset (capped growth)
- Current annual tax
- $1,869 · $156/mo
- Projected year-2 tax
- $2,119 · $177/mo
- Expected delta
- +$251/yr (+$21/mo · 13.4%)
ⓘ Screening estimate from a state-policy table — verify with the county assessor before closing.
Climate risk First Street
- Flood 9/10 Extreme FEMA zone X (unshaded) · 99% chance over 30 yrs
- Wildfire 2/10 Low
- Heat 4/10 Moderate 7 d/yr ≥98°F today · 17 d/yr by 30 yrs out
- Wind 2/10 Low
- Air quality 2/10 Low 0 unhealthy d/yr today · 1 by 30 yrs out
Nearby sold comps map
Loading sold comps map…
Walkable amenities ~0.75 mi
Loading nearby amenities…
Taxation est. · year 1
- Rental income
- $24,000
- − Mortgage interest
- −$8,402
- − Property taxes
- −$1,869
- − Insurance
- −$1,547
- − Repairs & maintenance
- −$1,920
- − Management
- −$1,920
- − Depreciation
- −$4,364
- Taxable income
- $3,978
- Est. tax owed @ 24.0%
- −$955
- After-tax cash flow
- $5,150/yr
For passive investors: Depreciation is non-cash, so a rental often shows a tax loss while cash-flowing — sheltering income. Rental losses are passive: they offset passive income freely, and up to $25,000/yr can offset ordinary (W-2) income if you actively participate and your MAGI is under $100k (phasing out to $0 by $150k); unused losses carry forward. On sale, claimed depreciation is recaptured at up to 25%, and gains may owe capital-gains tax (a 1031 exchange can defer both). Figures are a year-1 estimate at your 24.0% rate — not tax advice; consult a CPA.
Schools (NCES district)
- District
- Mifflin County SD
- NCES district ID
- 4215290
- Math proficiency
- 28% ▼ -7.00%
- Reading proficiency
- 49% ▼ -9.00%
- Median HH income
- $40,718
- Composite
- 32.28/100
- National rank
- #5755
- State rank
- #380 of 539 in PA
Livability — Burnham
- Score
- 72/100
- State rank
- #634
- US rank
- #6172
Category grades
Schools grade is shown separately in the Schools card above.
Census & demographics
- Census place
- Burnham, PA
- City population
- 2,804
- Population (ZIP)
- 1,682
Population outlook (Mifflin County) Hauer SSP2
- Today (2025)
- 44,611 people
- By 2030
- 43,212 · -3.1%
- By 2040
- 40,197 · -9.9%
- By 2050
- 36,813 · -17.5%
- By 2075
- 28,833 · -35.4%
- By 2100
- 20,296 · -54.5%
Race, ethnicity, and origin ACS 2023
- Neighborhood character
- Predominantly White (91%)
- Race & ethnicity
- White 91% Two or more races 5% Black 3%
- Common ancestry
- Romanian 5% Iranian 3% Lithuanian 2%
- Foreign-born
- 0% · Canada
Political lean MEDSL · Mifflin
- 2024 margin
- Solid R (+56.4) · D 21.4% · R 77.9%
- 2008→2024 swing
- -22.8pp toward R · 2008: -33.7pp · 2024: -56.4pp
- All cycles
- 2024: R+56.4 2020: R+56.1 2016: R+57.5 2012: R+46.8 2008: R+33.7
Not yet ingested
- Civics
- —
Market trends
- HPI YoY
- ▲ 8.31%
- Current HPI
- 249.4239
- Rent YoY
- —
- Metro
- —
- State GDP YoY
- ▲ 1.68%
- F500 in state
- 34
Industry mix (Fortune 500 HQ in PA)
| Industry | F500 HQs | Revenue |
|---|---|---|
| Healthcare | 2 | $309B |
|
||
| Insurance | 2 | $27B |
|
||
| Telecommunications / Media | 1 | $124B |
|
||
| Industrial Distribution | 1 | $22B |
|
||
| Financial Services | 1 | $20B |
|
||
| Chemicals / Materials | 1 | $18B |
|
||
Price history
+158.6% since first listed8 events — show timeline
- 2025-12-22 Listed $150,000 Fizber.com
- 2025-10-21 Listing Removed — BRIGHT MLS
- 2025-09-04 Listed $150,000 BRIGHT MLS
- 2025-02-18 Sold (Public Records) $100,000 Public Records
- 2025-02-14 Sold (MLS) $100,000 BRIGHT MLS
- 2025-02-06 Pending — BRIGHT MLS
- 2024-11-15 Listed $119,000 BRIGHT MLS
- 2019-12-06 Sold (Public Records) $58,000 Public Records
Property tax history
+0.7%/yrLatest (2026): $1,869 · +0.0% YoY. Source: county tax records.
Cash-flow waterfall
monthlySold comps — $/sqft
last 12 mo · ≤1 miLoading sold comps…