743 Swaggertown Rd · East Glenville, NY
Flood risk 1/10 · Minimal
- FEMA flood zone
- X
- Chance of flooding over 30 yrs
- 0.0%
- Est. flood insurance / yr
- $473 – $860
Fire risk 3/10 · Minor
- Est. fire insurance / yr
- $691 – $1,283
Heat risk 3/10 · Minor
- Hot days now (above 95°F)
- 7 days/yr
- Hot days in 30 yrs
- 16 days/yr
Wind risk 2/10 · Minimal
- Chance of severe wind over 30 yrs
- 4.0%
Air-quality risk 1/10 · Minimal
- Unhealthy air days now
- 0 days/yr
- Unhealthy air days in 30 yrs
- 0 days/yr
Risk factors via First Street. Map © Google.
Why this score? — see what drove the D grade
The composite is a weighted blend of 9 inputs, each scored 0–100. Each bar is that input's sub-score; the figure is the points it added to the 100-point composite (weight × sub-score).
- Cash flow +12.6/30.0
- ARV discount +7.5/15.0
- Schools +6.1/10.0
- DSCR +3.7/10.0
- Livability +3.4/5.0
- 1% rule +3.3/10.0
- Rent growth +2.5/5.0
- Condition / age +2.5/5.0
- Appreciation +0.0/10.0
$239,000
🖨 Deal sheet 📄 Offer letter ✓ Due diligence
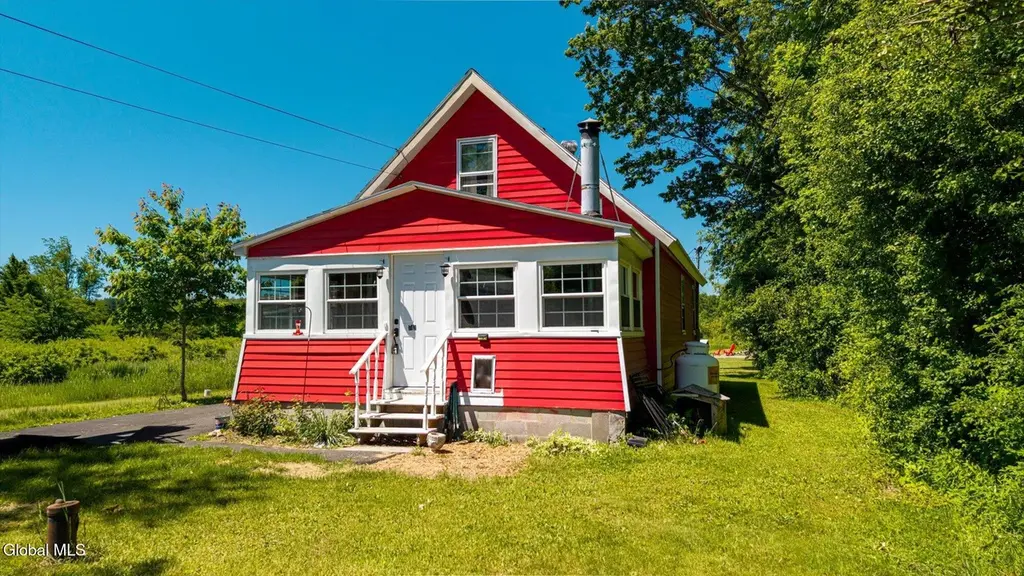
Listing remarks
Nestled on . 36 acres just outside of Charlton, this custom-built bungalow is filled with warmth, character, and timeless charm. Lovingly cared for over the years, the home features German cabinetry throughout, a custom Butler's pantry off the kitchen for additional prep and storage space, and a bright four-season room that adds extra living space year-round. Outside, enjoy a peaceful backyard complete with a fire pit overlooking a forever wild field -- the perfect setting to relax and unwind. Recent updates include a newer roof on both the home and garage (2024) and a freshly painted exterior, offering peace of mind for years to come. Conveniently located near Saratoga, Schenectady, and GE
Key facts
- 0.36 acre lot
- Garage
- Built 1946
Property features AI
Exterior
- Parking: Detached or attached garage with 1 garage space; Parking for up to 8 vehicles
- Utilities: Septic tank
- Home design: Single family residence; One to two story configuration
- Construction: Aluminum siding
- Exterior features: Paved driveway; Asphalt roof; Lot approximately 0.36 acres
Interior
- Kitchen: Electric oven; Microwave; Refrigerator
- Bedrooms: One bedroom on the first floor; Two bedrooms on the second floor
- Bathrooms: One full bathroom (first floor)
- Heating & cooling: Oil and propane heating; Window air conditioning units
- Interior features: Gas fireplace; 7 total rooms; Full basement with interior entry, unfinished space, and walk-out access; Sun room
- Laundry & utility: Washer and dryer; Laundry located in the basement
Neighborhood map
What this means for you Summary
Snapshot
- This is a 3-bed/1.0-bath single-family listed at $239k.
Deal economics
- At list price, monthly cash flow is $-32 ($-389/yr) — negative.
- To cash-flow at today's rent, offer at most $233k (2.4% below list).
- To meet the 1% rule (rent ≥ 1% of price), the offer needs to be $199k (16.9% below list).
- Recommended offer: $199k (16.9% below list) — sets the bar for 1% rule.
- Cap rate 6.1% vs local median 3.5% in East Glenville — top-decile yield for the area; either an underpriced asset or a hidden risk that comps aren't pricing in. Stress-test before assuming the spread holds.
Location & tenants
- Location reads 68/100 on livability (#535 in NY) — a middle-class / working-renter tenant base. Strengths: housing A+, health & safety A+, employment A-; Watch: cost of living C-, crime D+, amenities F.
- Burnt Hills-Ballston Lake Central School District (suburban): math 64% / reading 73% proficiency, ranked #137 of 590 in NY (top 23%) — acceptable for families but not a draw, mixed tenant base, ~2y average lease; only 9% free/reduced lunch — higher-income household profile.
- Zoned schools: Charlton Heights Elementary School (math 72% / reading 72%, grade A-, #378 of 2,108 statewide, top 20%, 481 students, 14% FRL); Burnt Hills-Ballston Lake Senior High School (math 97% / reading 98%, grade A+, #49 of 1,100 statewide, top 5%, 928 students, 19% FRL).
- Zoned-school proficiency averages 85% at this address vs 68% district-wide (+16 pts) — the actual schools serving this property are materially stronger than the Burnt Hills-Ballston Lake Central School District average implies; a family-tenant draw the district grade alone would hide.
- Market conditions: 127 active listings in the ZIP; solid renter incomes; 1,132 units permitted in Saratoga County in 2024 (378 in 5+ unit buildings).
Forward outlook
- Local home prices are declining (-3.0%/yr); year-one equity from $2k of loan paydown is wiped out by about $7k of value loss. Plan a longer hold.
- Saratoga County population projected at +4% by 2050 — modest demand growth; plan on rents tracking national, not racing it.
Negotiation context
- Only 4 days on market — expect competitive offers; lowballing is unlikely to land.
- Current owner paid $100k; list at $239k implies a 139% gain — meaningful room to come down on a strong offer.
Risks & watch-outs
- Watch-outs: built in 1946 — expect roof / HVAC / electrical / plumbing capex.
Questions for the listing agent
- What do current leases actually rent for vs. the listed asking? Can we see a recent rent roll and the last 12 months of T-12 income?
- Built in 1946 — when were the roof, HVAC, electrical panel, plumbing, and water heater last replaced?
- Is there a deadline driving the sale (1031 exchange, divorce, estate, relocation)? That informs how much negotiation room exists.
- Crime grade is D in this area — have there been break-ins, vandalism, or insurance claims at this property in the last 3 years? What carrier currently insures it and at what premium?
- The area grade is low — what's the realistic commute time and amenity access for the typical tenant pool here? Any planned neighborhood developments (good or bad) we should know about?
- What's the average days-on-market for RENTAL listings here right now (not sales)? A rising rental-DOM trend means longer vacancies and softer asking-rent achievability than the comps imply.
- What's the recent tenant-quality profile in this submarket — average credit score on applications, eviction rate, late-payment / NSF rate, and stable-employment percentage? A property-management company in the area should have these aggregated.
- How much new for-sale + rental construction is in the pipeline within 1–3 miles? Heavy new supply typically softens prices + rents 12–24 months out; constrained supply supports both.
Investment metrics
- 1% rule
- 0.83% ✗
- Cap rate
- 6.13%
- Cash-on-cash
- -0.58%
- DSCR
- 0.97
- GRM
- 10.0
CMA / ARV
No comps found within radius.
Projected returns pro-forma
-3.0% appreciation · 3.0% rent growth · sell at horizon
- IRR
- -17.3%
- Equity multiple
- 0.39×
- Total profit
- $-40,795
- Equity at exit
- $35,636
- IRR
- -9.2%
- Equity multiple
- 0.43×
- Total profit
- $-38,187
- Equity at exit
- $20,664
Cash invested: $66,920 (down + closing). Projections, not guarantees.
Landlord ↔ Tenant lean methodology
- Overall (STATE)
- 15 Strongly Tenant-Friendly
- State New York
- 15 Strongly Tenant-Friendly · D+10
- County
- — inherits STATE
- City
- — inherits STATE
ZIP-level market 12302
- Active inventory
- 127
- Price-to-rent
- 10.0×
Monthly cashflow live
- Estimated rent
- $1,986 medium interval (Pro) →
- Mortgage (P&I)
- −$1,253
- Tax from tax record
- −$249 /mo · $2,983/yr
- Insurance
- −$100
- HOA
- −$0
- Vacancy / Maint / Mgmt
- −$417
- Net cashflow
- $-32
Break-even live
UW: 25.0% down · 7.5% · 30yr · 1.5% tax · 5.0% vac · 8.0% maint · 8.0% mgmt
Financing live
Cash to close
- Down payment
- $59,750
- Closing costs
- $7,170
- Reserves months
- —
- Total cash needed
- —
Loan-product check · same deal, 3 products live
Conventional
25% down · 7.5% · 30yr
- Down + closing
- —
- Monthly P&I
- —
- Monthly cashflow
- —
- DSCR
- —
- Eligible?
- —
Personal DTI + credit; lowest rate.
DSCR
20% down · 8.5% · 30yr
- Down + closing
- —
- Monthly P&I
- —
- Monthly cashflow
- —
- DSCR
- —
- Eligible?
- —
No personal income docs; deal must DSCR.
Hard money
10% down · 12.0% · 12mo
- Down + closing
- —
- Monthly P&I
- —
- Monthly cashflow
- —
- DSCR
- —
- Eligible?
- —
Short-term bridge; refi at stabilization.
Listing history 4 events
-
2026-06-09status $239,000 Pending 4 DOM
-
2026-06-08days on market $239,000 Active 4 DOM
-
2026-06-07remarks 699-char remark
-
2026-06-07$239,000 Active 3 DOM
ⓘ Source: listings_history table (triggers on properties + properties_extension) + one-shot
backfill from property_details.listing_events for pre-trigger history.
Tax reassessment forecast NY · Partial reset (capped growth)
- Current annual tax
- $2,983 · $249/mo
- Projected year-2 tax
- $3,511 · $293/mo
- Expected delta
- +$528/yr (+$44/mo · 17.7%)
ⓘ Screening estimate from a state-policy table — verify with the county assessor before closing.
Climate risk First Street
- Flood 1/10 Low FEMA zone X · 0% chance over 30 yrs
- Wildfire 3/10 Moderate
- Heat 3/10 Moderate 7 d/yr ≥95°F today · 16 d/yr by 30 yrs out
- Wind 2/10 Low 4% chance of damaging wind over 30 yrs
- Air quality 1/10 Low 0 unhealthy d/yr today · 0 by 30 yrs out
Nearby sold comps map
Loading sold comps map…
Walkable amenities ~0.75 mi
Loading nearby amenities…
Taxation est. · year 1
- Rental income
- $23,834
- − Mortgage interest
- −$13,388
- − Property taxes
- −$2,983
- − Insurance
- −$1,195
- − Repairs & maintenance
- −$1,907
- − Management
- −$1,907
- − Depreciation
- −$6,953
- Taxable loss
- −$4,498
- Est. tax savings @ 24.0%
- +$1,079
- After-tax cash flow
- $690/yr
For passive investors: Depreciation is non-cash, so a rental often shows a tax loss while cash-flowing — sheltering income. Rental losses are passive: they offset passive income freely, and up to $25,000/yr can offset ordinary (W-2) income if you actively participate and your MAGI is under $100k (phasing out to $0 by $150k); unused losses carry forward. On sale, claimed depreciation is recaptured at up to 25%, and gains may owe capital-gains tax (a 1031 exchange can defer both). Figures are a year-1 estimate at your 24.0% rate — not tax advice; consult a CPA.
Schools (NCES district)
- District
- Burnt Hills-Ballston Lake Central School District
- NCES district ID
- 3605940
- Math proficiency
- 64% ▼ -8.00%
- Reading proficiency
- 73% ▲ 2.00%
- Median HH income
- $79,256
- Composite
- 60.89/100
- National rank
- #813
- State rank
- #137 of 590 in NY
Livability — East Glenville
- Score
- 68/100
- State rank
- #535
- US rank
- #9653
Category grades
Schools grade is shown separately in the Schools card above.
Census & demographics
- County
- Schenectady County · 141,369 people
- City population
- 610
- Metro
- Albany-Schenectady-Troy, NY
- Population (ZIP)
- 28,031
- Household income
- $98,163
- Rent vs Own
- Severe rent burden
- 632.0
Population outlook (Saratoga County) Hauer SSP2
- Today (2025)
- 238,889 people
- By 2030
- 243,681 · +2.0%
- By 2040
- 249,118 · +4.3%
- By 2050
- 248,638 · +4.1%
- By 2075
- 241,675 · +1.2%
- By 2100
- 213,150 · -10.8%
Race, ethnicity, and origin ACS 2023
- Neighborhood character
- Predominantly White (90%)
- Race & ethnicity
- White 90% Two or more races 5% Hispanic / Latino 3% Asian 2% Black 2%
- Common ancestry
- Romanian 9% Lithuanian 4% Italian 3%
- Foreign-born
- 4% · Canada, China
- Languages at home
- 94% English-only · Spanish 2% Chinese 1% Other Indo-European 1%
Political lean MEDSL · Saratoga
- 2024 margin
- Toss-up / Even · D 50.9% · R 49.1%
- 2008→2024 swing
- -1.6pp toward R · 2008: 3.4pp · 2024: 1.8pp
- All cycles
- 2024: D+1.8 2020: D+5.4 2016: R+4.4 2012: D+2.1 2008: D+3.4
Not yet ingested
- Civics
- —
Market trends
- HPI YoY
- ▼ -274.86%
- Current HPI
- 304.1765
- Rent YoY
- —
- Metro
- Albany-Schenectady-Troy, NY
- State GDP YoY
- ▲ 2.60%
- F500 in state
- 92
Industry mix (Fortune 500 HQ in NY)
| Industry | F500 HQs | Revenue |
|---|---|---|
| Financial Services | 10 | $950B |
|
||
| Consumer Goods | 9 | $162B |
|
||
| Insurance | 4 | $225B |
|
||
| Telecommunications | 2 | $144B |
|
||
| Pharmaceuticals | 2 | $112B |
|
||
| Media / Entertainment | 2 | $69B |
|
||
Price history
+139.0% since first listed2 events — show timeline
- 2026-06-04 Listed $239,000 Global MLS
- 2022-06-22 Sold (Public Records) $100,000 Public Records
Property tax history
+13.0%/yrLatest (2025): $2,983 · -0.2% YoY. Source: county tax records.
Cash-flow waterfall
monthlySold comps — $/sqft
last 12 mo · ≤1 miLoading sold comps…