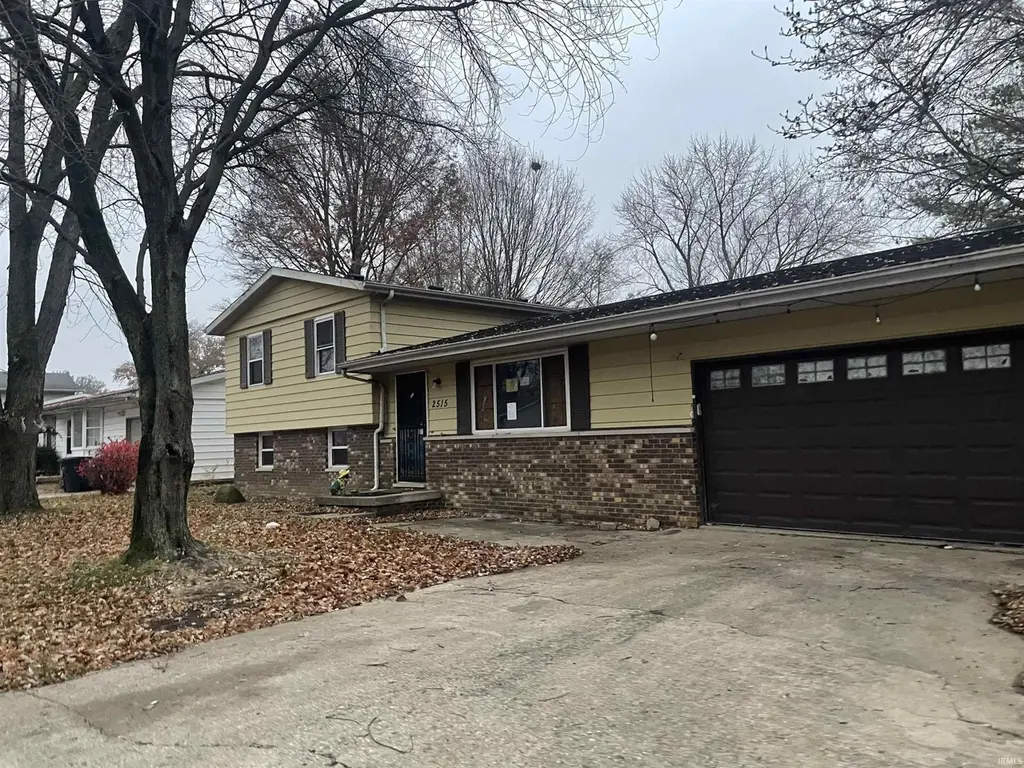
2515 Eckman Dr · Lafayette, IN
Flood risk 1/10 · Minimal
- FEMA flood zone
- X (unshaded)
- Chance of flooding over 30 yrs
- 0.0%
- Est. flood insurance / yr
- $507 – $1,088
Fire risk 1/10 · Minimal
- Est. fire insurance / yr
- $717 – $1,331
Heat risk 3/10 · Minor
- Hot days now (above 101°F)
- 7 days/yr
- Hot days in 30 yrs
- 18 days/yr
Wind risk 2/10 · Minimal
- Chance of severe wind over 30 yrs
- —
Air-quality risk 2/10 · Minimal
- Unhealthy air days now
- 1 days/yr
- Unhealthy air days in 30 yrs
- 2 days/yr
Risk factors via First Street. Map © Google.
Why this score? — see what drove the B- grade
The composite is a weighted blend of 9 inputs, each scored 0–100. Each bar is that input's sub-score; the figure is the points it added to the 100-point composite (weight × sub-score).
- Cash flow +30.0/30.0
- 1% rule +10.0/10.0
- DSCR +10.0/10.0
- ARV discount +7.5/15.0
- Livability +3.7/5.0
- Rent growth +3.2/5.0
- Schools +2.6/10.0
- Condition / age +2.5/5.0
- Appreciation +0.0/10.0
$124,500
🖨 Deal sheet (PDF) 📄 Offer letter ✓ Due diligence
Listing remarks MLS
Great starter home. Spacious 1760 sq ft has slots to offer. Large eat-in kitchen, two family rooms, wood burning fireplace and great fenced back yard.
Key facts
- Fenced back yard
- Eat-in kitchen
- 0.24 acre lot
Tags
Neighborhood map
What this means for you Summary
Snapshot
- This is a 3-bed/2.5-bath single-family listed at $124k.
Deal economics
- At list price, monthly cash flow is $518 ($6k/yr) — positive.
- The deal already cash-flows at list — no discount required.
- Meets the 1% rule at list price ($2k rent vs $124k).
- Cap rate 11.3% vs local median 4.2% in Lafayette — top-decile yield for the area; either an underpriced asset or a hidden risk that comps aren't pricing in. Stress-test before assuming the spread holds.
Location & tenants
- Location reads 74/100 on livability (#68 in IN, #4,374 nationally) — a middle-class / working-renter tenant base. Strengths: cost of living A+, housing A+, health & safety A+; Watch: amenities D+, employment D+, crime F.
- Lafayette School Corporation (urban): math 29% / reading 34% proficiency, ranked #235 of 301 in IN (top 78%) — families likely to look elsewhere, expect single-tenant / working-renter base with shorter leases; 63% free/reduced lunch — lower-income household profile, screen leases tightly.
- Zoned schools: Edgelea Elementary School (math 57% / reading 47%, grade C-, #237 of 994 statewide, top 26%, 457 students, 65% FRL); Jefferson High School (math 23% / reading 55%, grade F, #235 of 369 statewide, top 65%, 2,118 students, 69% FRL) — zoned schools at 67% FRL track the district average.
- Zoned-school proficiency averages 46% at this address vs 32% district-wide (+14 pts) — the actual schools serving this property are materially stronger than the Lafayette School Corporation average implies; a family-tenant draw the district grade alone would hide.
- Market conditions: Rents rising (+2.7%/yr); 186 active listings in the ZIP; 3 comparable units currently listed for rent nearby; rentals lingering (median 45d on market — plan ~5-8 weeks vacancy on turnover, expect pricing pressure); 67% of comp listings sitting > 30 days — soft ceiling on asking rent; 1,341 units permitted in Tippecanoe County in 2024 (869 in 5+ unit buildings).
- This rent runs 33% of the median local income ($68k/yr) — at the standard rent-burdened threshold; future hikes will face affordability resistance.
Forward outlook
- Local home prices are declining (-3.0%/yr); year-one equity from $861 of loan paydown is wiped out by about $4k of value loss. Plan a longer hold.
- Tippecanoe County population projected at +41% by 2050 — long-run rental-demand tailwind backs the buy-and-hold thesis.
- At projected returns (-3.0% appreciation + 2.7% rent growth), your $35k cash investment doubles in ~7 years — after that, you're playing with house money.
Negotiation context
- Only 12 days on market — expect competitive offers; lowballing is unlikely to land.
- 2 sale attempts since 6y ago with the ask held roughly flat each time — persistent listings suggest the price (not the market) is what's stuck; bring a comps-based counter.
Questions for the listing agent
- Built in 1978 — when were the roof, HVAC, electrical panel, plumbing, and water heater last replaced?
- Is there a deadline driving the sale (1031 exchange, divorce, estate, relocation)? That informs how much negotiation room exists.
- Schools are D-rated, which usually means shorter tenancies and higher turnover. Who's the typical renter profile here, and what's been the actual vacancy rate?
- Crime grade is F in this area — have there been break-ins, vandalism, or insurance claims at this property in the last 3 years? What carrier currently insures it and at what premium?
- What's the average days-on-market for RENTAL listings here right now (not sales)? A rising rental-DOM trend means longer vacancies and softer asking-rent achievability than the comps imply.
- What's the recent tenant-quality profile in this submarket — average credit score on applications, eviction rate, late-payment / NSF rate, and stable-employment percentage? A property-management company in the area should have these aggregated.
- How much new for-sale + rental construction is in the pipeline within 1–3 miles? Heavy new supply typically softens prices + rents 12–24 months out; constrained supply supports both.
Investment metrics
- 1% rule
- 1.50% ✓
- Cap rate
- 11.29%
- Cash-on-cash
- 17.83%
- DSCR
- 1.79
- GRM
- 5.6
CMA / ARV
- ARV (on-the-fly)
- $267,520
- Comps found
- 12
Show comp detail 12 sales within ~0.75 mi
| Address | Dist | Beds/Ba | Sqft | Sold | Price | $/sf | Match |
|---|---|---|---|---|---|---|---|
| 2404 Bennett Rd | 0.16mi | 4/1.5 (+1) | 1,836 (+4%) | 2mo | $245,000 | $133 | 75 |
| 350 Limestone Ct W | 0.31mi | 3/2.0 | 1,635 (-7%) | 8mo | $330,000 | $202 | 64 |
| 2524 Whitehall Dr | 0.50mi | 4/2.0 (+1) | 1,808 (+3%) | 1mo | $264,500 | $146 | 64 |
| 416 Atlas Dr | 0.30mi | 3/2.0 | 1,650 (-6%) | 13mo | $320,000 | $194 | 63 |
| 359 Limestone Ct | 0.31mi | 4/2.5 (+1) | 1,900 (+8%) | 12mo | $339,000 | $178 | 57 |
| 901 Southlea Dr | 0.63mi | 4/1.5 (+1) | 1,762 (+0%) | 6mo | $235,000 | $133 | 56 |
| 532 Duroc Ct | 0.39mi | 2/2.0 (-1) | 1,869 (+6%) | 12mo | $253,000 | $135 | 55 |
| 2065 S 9th St | 0.63mi | 3/1.5 | 1,960 (+11%) | 0mo | $297,000 | $152 | 48 |
| 2525 S 9th St | 0.47mi | 3/2.0 | 1,512 (-14%) | 10mo | $274,900 | $182 | 44 |
| 2545 Lafayette Dr | 0.59mi | 3/2.0 | 1,548 (-12%) | 8mo | $80,000 | $52 | 44 |
| 134 Kensal Ct | 0.72mi | 3/2.5 | 1,522 (-14%) | 13mo | $267,900 | $176 | 33 |
| 210 Montifiore St | 0.75mi | 2/2.0 (-1) | 1,558 (-12%) | 8mo | $199,900 | $128 | 32 |
Match score weights: distance 35% · size 25% · config 20% · recency 20%. Top-matched comps best support the ARV.
Projected returns pro-forma
-3.0% appreciation · 2.74% rent growth · sell at horizon
- IRR
- 9.1%
- Equity multiple
- 1.36×
- Total profit
- $12,415
- Equity at exit
- $18,563
- IRR
- 18.1%
- Equity multiple
- 2.48×
- Total profit
- $51,654
- Equity at exit
- $10,764
Cash invested: $34,860 (down + closing). Projections, not guarantees.
Landlord ↔ Tenant lean methodology
- Overall (STATE)
- 90 Strongly Landlord-Friendly
- State Indiana
- 90 Strongly Landlord-Friendly · R+11
- County
- — inherits STATE
- City
- — inherits STATE
ZIP-level market 47909
- Rents YoY
- 2.7%
- Active inventory
- 186
- Price-to-rent
- 5.6×
Monthly cashflow live
- Estimated rent
- $1,864 medium interval (Pro) →
- Mortgage (P&I)
- −$653
- Tax from tax record
- −$250 /mo · $3,003/yr
- Insurance
- −$52
- HOA
- −$0
- Vacancy / Maint / Mgmt
- −$392
- Net cashflow
- $518
Break-even live
Sensitivity live
| Price | -10% $588 | -5% $553 | +0% $518 | +5% $483 | +10% $447 |
|---|---|---|---|---|---|
| Rent | -10% $371 | -5% $444 | +0% $518 | +5% $592 | +10% $665 |
| Rate | -1.0pp $581 | -0.5pp $550 | base $518 | +0.5pp $486 | +1.0pp $453 |
UW: 25.0% down · 7.5% · 30yr · 1.5% tax · 5.0% vac · 8.0% maint · 8.0% mgmt
Financing live
Cash to close
- Down payment
- $31,125
- Closing costs
- $3,735
- Reserves months
- —
- Total cash needed
- —
Loan-product check · same deal, 3 products live
Conventional
25% down · 7.5% · 30yr
- Down + closing
- —
- Monthly P&I
- —
- Monthly cashflow
- —
- DSCR
- —
- Eligible?
- —
Personal DTI + credit; lowest rate.
DSCR
20% down · 8.5% · 30yr
- Down + closing
- —
- Monthly P&I
- —
- Monthly cashflow
- —
- DSCR
- —
- Eligible?
- —
No personal income docs; deal must DSCR.
Hard money
10% down · 12.0% · 12mo
- Down + closing
- —
- Monthly P&I
- —
- Monthly cashflow
- —
- DSCR
- —
- Eligible?
- —
Short-term bridge; refi at stabilization.
Rent comps 3 comps
| Address | Beds | Baths | Sqft | Rent | $/sqft | DOM | Units | Dist |
|---|---|---|---|---|---|---|---|---|
| 324 Plantation Way Lafayette, IN | 3.0 | 2.0 | 1276 | $1,820 | $1.43 | 45d | 1 | 1.32mi |
| 340 Plantation Way Lafayette, IN | 3.0 | 2.0 | 1404 | $1,595 | $1.14 | 45d | 1 | 1.34mi |
| 1213 S 19th St Lafayette, IN | 3.0 | 2.0 | 1484 | $1,900 | $1.28 | 14d | 1 | 1.41mi |
Listing history 4 events
-
2026-03-30status Pending
-
2026-03-18$124,500 Active
-
2020-06-09soldstatus $151,500 150-char remark
Show marketing remark (150 chars)
Great starter home. Spacious 1760 sq ft has slots to offer. Large eat-in kitchen, two family rooms, wood burning fireplace and great fenced back yard.
-
2020-04-03$150,000 150-char remark
Show marketing remark (150 chars)
Great starter home. Spacious 1760 sq ft has slots to offer. Large eat-in kitchen, two family rooms, wood burning fireplace and great fenced back yard.
ⓘ Source: listings_history table (triggers on properties + properties_extension) + one-shot
backfill from property_details.listing_events for pre-trigger history.
Tax reassessment forecast IN · Partial reset (capped growth)
- Current annual tax
- $3,003 · $250/mo
- Projected year-2 tax
- $3,003 · $250/mo
- Expected delta
- $0/yr ($0/mo · 0.0%)
ⓘ Screening estimate from a state-policy table — verify with the county assessor before closing.
Climate risk First Street
- Flood 1/10 Low FEMA zone X (unshaded) · 0% chance over 30 yrs
- Wildfire 1/10 Low
- Heat 3/10 Moderate 7 d/yr ≥101°F today · 18 d/yr by 30 yrs out
- Wind 2/10 Low
- Air quality 2/10 Low 1 unhealthy d/yr today · 2 by 30 yrs out
Nearby sold comps map
Loading sold comps map…
Walkable amenities ~0.75 mi
Loading nearby amenities…
Taxation est. · year 1
- Rental income
- $22,374
- − Mortgage interest
- −$6,974
- − Property taxes
- −$3,003
- − Insurance
- −$622
- − Repairs & maintenance
- −$1,790
- − Management
- −$1,790
- − Depreciation
- −$3,622
- Taxable income
- $4,573
- Est. tax owed @ 24.0%
- −$1,098
- After-tax cash flow
- $5,118/yr
For passive investors: Depreciation is non-cash, so a rental often shows a tax loss while cash-flowing — sheltering income. Rental losses are passive: they offset passive income freely, and up to $25,000/yr can offset ordinary (W-2) income if you actively participate and your MAGI is under $100k (phasing out to $0 by $150k); unused losses carry forward. On sale, claimed depreciation is recaptured at up to 25%, and gains may owe capital-gains tax (a 1031 exchange can defer both). Figures are a year-1 estimate at your 24.0% rate — not tax advice; consult a CPA.
Schools (NCES district)
- District
- Lafayette School Corporation
- NCES district ID
- 1805400
- Math proficiency
- 29% ▼ -9.00%
- Reading proficiency
- 34% ▼ -7.00%
- Median HH income
- $39,817
- Composite
- 26.46/100
- National rank
- #7217
- State rank
- #235 of 301 in IN
Livability — Lafayette
- Score
- 74/100
- State rank
- #68
- US rank
- #4374
Category grades
Schools grade is shown separately in the Schools card above.
Census & demographics
- Census place
- Lafayette, IN
- County
- Tippecanoe County · 181,820 people
- City population
- 106,622
- Metro
- Lafayette-West Lafayette, IN
- Population (ZIP)
- 43,561
- Household income
- $68,035
- Rent vs Own
- Severe rent burden
- 1332.0
Population outlook (Tippecanoe County) Hauer SSP2
- Today (2025)
- 215,327 people
- By 2030
- 232,284 · +7.9%
- By 2040
- 266,517 · +23.8%
- By 2050
- 302,826 · +40.6%
- By 2075
- 394,445 · +83.2%
- By 2100
- 463,500 · +115.3%
Race, ethnicity, and origin ACS 2023
- Neighborhood character
- Predominantly White (75%)
- Race & ethnicity
- White 75% Hispanic / Latino 12% Black 8% Two or more races 7% Asian 2%
- Hispanic origin (detail)
- Mexican 9%
- Common ancestry
- Iranian 2% Slovak 2% Italian 2%
- Foreign-born
- 7% · Canada
- Languages at home
- 92% English-only · Spanish 6% Other Indo-European 1% French/Haitian/Cajun 1%
Political lean MEDSL · Tippecanoe
- 2024 margin
- Toss-up / Even · D 49.0% · R 49.1% · Other 1.9%
- 2008→2024 swing
- -11.8pp toward R · 2008: 11.6pp · 2024: -0.1pp
- All cycles
- 2024: R+0.1 2020: D+0.6 2016: R+5.7 2012: R+3.6 2008: D+11.6
Not yet ingested
- Civics
- —
Market trends
- HPI YoY
- ▼ -131.96%
- Current HPI
- 214.2557
- Rent YoY
- ▲ 2.74%
- Metro
- Lafayette-West Lafayette, IN
- State GDP YoY
- ▲ 2.90%
- F500 in state
- 18
Industry mix (Fortune 500 HQ in IN)
| Industry | F500 HQs | Revenue |
|---|---|---|
| Industrial Machinery | 2 | $37B |
|
||
| Healthcare | 1 | $177B |
|
||
| Pharmaceuticals | 1 | $45B |
|
||
| Metals / Steel | 1 | $18B |
|
||
| Agriculture | 1 | $17B |
|
||
| Packaging | 1 | $12B |
|
||
Price history
-17.0% since first listed4 events — show timeline
- 2026-03-30 Pending — IRMLS
- 2026-03-18 Listed $124,500 IRMLS
- 2020-06-09 Sold (MLS) $151,500 IRMLS
- 2020-04-03 Listed $150,000 IRMLS
Property tax history
+11.4%/yrLatest (2024): $3,003 · -10.7% YoY. Source: county tax records.
Cash-flow waterfall
monthlySold comps — $/sqft
last 12 mo · ≤1 miLoading sold comps…