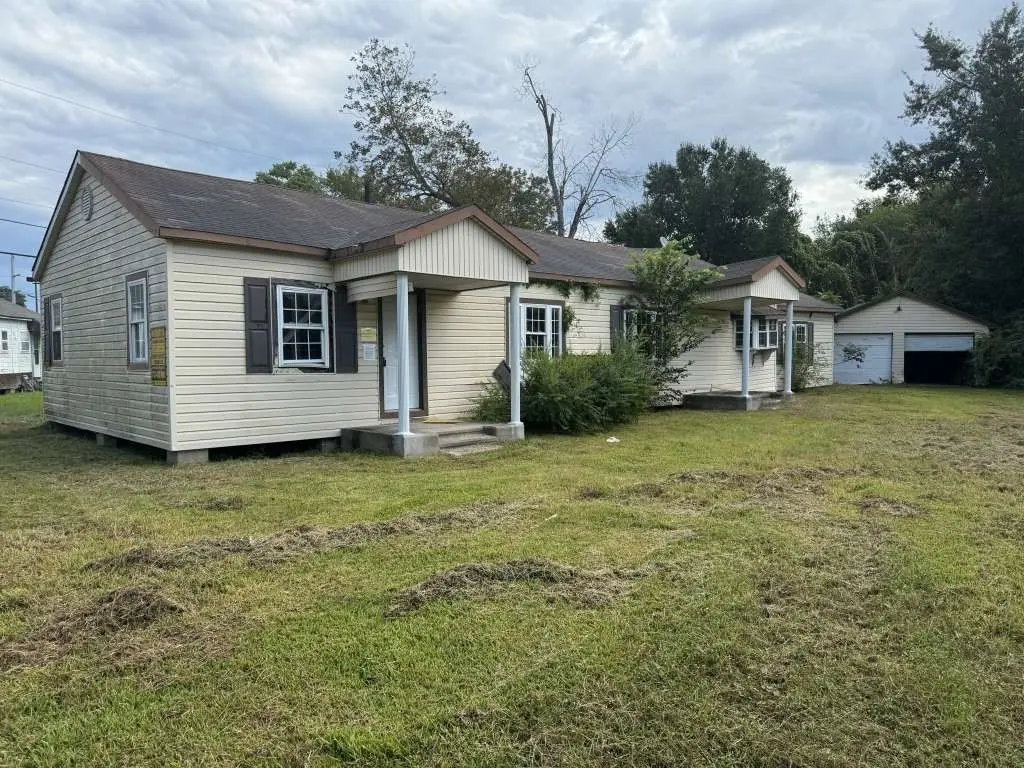
2006 2nd St · Orange, TX
Flood risk 7/10 · Major
- FEMA flood zone
- X (shaded)
- Chance of flooding over 30 yrs
- 0.92%
- Est. flood insurance / yr
- $507 – $1,088
Fire risk 2/10 · Minimal
- Est. fire insurance / yr
- $1,222 – $2,270
Heat risk 9/10 · Severe
- Hot days now (above 109°F)
- 7 days/yr
- Hot days in 30 yrs
- 24 days/yr
Wind risk 9/10 · Severe
- Chance of severe wind over 30 yrs
- 99.0%
Air-quality risk 3/10 · Minor
- Unhealthy air days now
- 2 days/yr
- Unhealthy air days in 30 yrs
- 3 days/yr
Risk factors via First Street. Map © Google.
Why this score? — see what drove the A- grade
The composite is a weighted blend of 9 inputs, each scored 0–100. Each bar is that input's sub-score; the figure is the points it added to the 100-point composite (weight × sub-score).
- Cash flow +30.0/30.0
- ARV discount +15.0/15.0
- 1% rule +10.0/10.0
- DSCR +10.0/10.0
- Appreciation +5.5/10.0
- Rent growth +3.9/5.0
- Livability +3.6/5.0
- Condition / age +2.5/5.0
- Schools +1.6/10.0
$47,999
🖨 Deal sheet (PDF) 📄 Offer letter ✓ Due diligence
Listing remarks MLS
INVESTORS! Welcome to 2006 2nd St, a renovation-ready home in Orange, TX! With two bedrooms, one bathroom, and 1,704 square feet of livable space, this property offers ample potential for customization. Featuring wood/vinyl flooring throughout most of the home and a spacious kitchen with its own designated area, it provides a solid foundation for renovation. Additionally, arched walkways and built-in shelving add character to the space. Situated on a generous 14,810 square foot lot, this property offers plenty of land value and endless possibilities for outdoor activities or whatever you desire. This location is just 30 minutes from Lake Charles! This property is part of an ORANGE COUNTY INVESTOR PACKAGE that is available for a limited time. WE MAKE IT EASY TO OWN. This is a great opportunity! Don't wait, call us today to get more information on the owner's easy terms and smooth process that may be able to put the deed in your name and make this your dream investment.
Key facts
- Wood vinyl flooring
- Arched walkways
- Generous lot
Tags
Neighborhood map
What this means for you Summary
Snapshot
- This is a 2-bed/1.0-bath single-family listed at $48k.
Deal economics
- At list price, monthly cash flow is $513 ($6k/yr) — positive.
- The deal already cash-flows at list — no discount required.
- Meets the 1% rule at list price ($1k rent vs $48k).
- Recommended offer: $42k (12.0% below list) — sets the bar for market timing.
- Cap rate 20.8% vs local median 3.8% in Orange — top-decile yield for the area; either an underpriced asset or a hidden risk that comps aren't pricing in. Stress-test before assuming the spread holds.
Location & tenants
- Location reads 71/100 on livability (#286 in TX) — a middle-class / working-renter tenant base. Strengths: cost of living A+, housing A+, health & safety A+; Watch: crime D+, employment D+, amenities F.
- West Orange-Cove CISD (suburban): math 17% / reading 21% proficiency, ranked #784 of 826 in TX (top 95%) — low school quality limits family demand, transient renter base, plan for 1-2y turnover; 79% free/reduced lunch — lower-income household profile, screen leases tightly.
- Zoned schools: West Orange-Stark El (math 14% / reading 17%, grade F, #3,990 of 4,322 statewide, top 93%, 1,130 students, 94% FRL); West Orange-Stark Middle (math 20% / reading 20%, grade F, #1,428 of 1,662 statewide, top 87%, 505 students, 92% FRL); West Orange-Stark H S (math 19% / reading 31%, grade F, #1,250 of 1,632 statewide, top 77%, 660 students, 88% FRL).
- Market conditions: Rents rising fast (+5.7%/yr); 338 active listings in the ZIP; 7 comparable units currently listed for rent nearby; rentals at typical pace (median 23d on market — plan ~3-4 weeks tenant-placement turnaround); 43% of comp listings sitting > 30 days — soft ceiling on asking rent; 235 units permitted in Orange County in 2024 (50 in 5+ unit buildings).
Forward outlook
- In year one you build about $817 of equity ($332 loan paydown + $485 appreciation (1.0% local appreciation)).
- Orange County population projected at +6% by 2050 — modest demand growth; plan on rents tracking national, not racing it.
- At projected returns (1.0% appreciation + 5.7% rent growth), your $13k cash investment doubles in ~2 years — after that, you're playing with house money.
Negotiation context
- It's been on market 478 days — a 12% lower offer ($42k) is reasonable based on typical stale-listing flexibility.
- 2 sale attempts since 2y ago; this cycle's ask has dropped $14k (22%) from the opening price — seller is motivated, your offer sets the floor, not the list.
Risks & watch-outs
- Watch-outs: flood insurance adds $66/mo; built in 1941 — expect roof / HVAC / electrical / plumbing capex.
- Climate carrying-cost: major flood risk; severe wind risk, 99% chance of damaging wind over 30y; extreme-heat days projected 7→24/yr by 2055 (HVAC capex compounding) — expect insurance premiums to compound above CPI over the hold.
Questions for the listing agent
- It's been on market 478 days. Have you received any prior offers? Is the seller open to a 12% concession, seller financing, or rate buy-down credit?
- Built in 1941 — when were the roof, HVAC, electrical panel, plumbing, and water heater last replaced?
- What's the actual annual flood-insurance premium (NFIP or private), and is the property in a SFHA with mandatory coverage?
- Why hasn't it sold? Are there any deal-killer items the seller is aware of (foundation, flood, title, zoning, code violations)?
- Is there a deadline driving the sale (1031 exchange, divorce, estate, relocation)? That informs how much negotiation room exists.
- Schools are D-rated, which usually means shorter tenancies and higher turnover. Who's the typical renter profile here, and what's been the actual vacancy rate?
- Crime grade is D in this area — have there been break-ins, vandalism, or insurance claims at this property in the last 3 years? What carrier currently insures it and at what premium?
- What's the average days-on-market for RENTAL listings here right now (not sales)? A rising rental-DOM trend means longer vacancies and softer asking-rent achievability than the comps imply.
- What's the recent tenant-quality profile in this submarket — average credit score on applications, eviction rate, late-payment / NSF rate, and stable-employment percentage? A property-management company in the area should have these aggregated.
- How much new for-sale + rental construction is in the pipeline within 1–3 miles? Heavy new supply typically softens prices + rents 12–24 months out; constrained supply supports both.
Investment metrics
- 1% rule
- 2.39% ✓
- Cap rate
- 20.77%
- Cash-on-cash
- 51.72%
- DSCR
- 3.30
- GRM
- 3.5
CMA / ARV
- ARV (median comp)
- $80,204
- List price
- $47,999
- Delta
- -40.15%
- Verdict
- UNDERPRICED
- Comps
- 15 within 1.0 mi
Show comp detail 1 sale within ~0.75 mi
| Address | Dist | Beds/Ba | Sqft | Sold | Price | $/sf | Match |
|---|---|---|---|---|---|---|---|
| 2241 Cross Ln | 0.64mi | 3/2.0 (+1) | 1,571 (-8%) | 1mo | $28,999 | $18 | 48 |
Match score weights: distance 35% · size 25% · config 20% · recency 20%. Top-matched comps best support the ARV.
Projected returns pro-forma
1.01% appreciation · 5.71% rent growth · sell at horizon
- IRR
- 51.3%
- Equity multiple
- 3.74×
- Total profit
- $36,856
- Equity at exit
- $16,411
- IRR
- 54.2%
- Equity multiple
- 8.25×
- Total profit
- $97,385
- Equity at exit
- $21,828
Cash invested: $13,440 (down + closing). Projections, not guarantees.
Landlord ↔ Tenant lean methodology
- Overall (STATE)
- 87 Strongly Landlord-Friendly
- State Texas
- 87 Strongly Landlord-Friendly · R+5
- County
- — inherits STATE
- City
- — inherits STATE
ZIP-level market 77630
- Home prices YoY
- 0.4%
- Rents YoY
- 5.7%
- Active inventory
- 338
- Price-to-rent
- 3.5×
Monthly cashflow live
- Estimated rent
- $1,150 high interval (Pro) →
- Mortgage (P&I)
- −$252
- Tax from tax record
- −$57 /mo · $686/yr
- Insurance
- −$20
- Flood insurance flood zone
- −$66 /mo · $798/yr
- HOA
- −$0
- Vacancy / Maint / Mgmt
- −$241
- Net cashflow
- $513
Break-even live
Sensitivity live
| Price | -10% $540 | -5% $526 | +0% $513 | +5% $499 | +10% $486 |
|---|---|---|---|---|---|
| Rent | -10% $422 | -5% $467 | +0% $513 | +5% $558 | +10% $604 |
| Rate | -1.0pp $537 | -0.5pp $525 | base $513 | +0.5pp $500 | +1.0pp $488 |
UW: 25.0% down · 7.5% · 30yr · 1.5% tax · 5.0% vac · 8.0% maint · 8.0% mgmt
Financing live
Cash to close
- Down payment
- $12,000
- Closing costs
- $1,440
- Reserves months
- —
- Total cash needed
- —
Loan-product check · same deal, 3 products live
Conventional
25% down · 7.5% · 30yr
- Down + closing
- —
- Monthly P&I
- —
- Monthly cashflow
- —
- DSCR
- —
- Eligible?
- —
Personal DTI + credit; lowest rate.
DSCR
20% down · 8.5% · 30yr
- Down + closing
- —
- Monthly P&I
- —
- Monthly cashflow
- —
- DSCR
- —
- Eligible?
- —
No personal income docs; deal must DSCR.
Hard money
10% down · 12.0% · 12mo
- Down + closing
- —
- Monthly P&I
- —
- Monthly cashflow
- —
- DSCR
- —
- Eligible?
- —
Short-term bridge; refi at stabilization.
Rent comps 7 comps
| Address | Beds | Baths | Sqft | Rent | $/sqft | DOM | Units | Dist |
|---|---|---|---|---|---|---|---|---|
| 1885 E Farragut Ave Orange, TX | 1.0–3.0 | 1.0–2.5 | 1023 | $924 | $0.90 | 15d | 9 | 0.12mi |
| 1019 Ruby Ln Orange, TX | 2.0 | 1.0 | 1243 | $1,100 | $0.88 | 15d | 1 | 0.81mi |
| 1030 Clairmont Dr Orange, TX | 3.0 | 2.0 | 1372 | $1,850 | $1.35 | 22d | 1 | 0.85mi |
| 1500 Link Ave Orange, TX | 1.0–2.0 | 1.0–1.5 | 1082 | $1,050 | $0.97 | 15d | 1 | 0.92mi |
| 9 W Eads Ave Orange, TX | 3.0 | 2.0 | 1255 | $1,400 | $1.12 | 45d | 1 | 1.00mi |
| 1010 N 16th St Orange, TX | 3.0 | 1.5 | 1100 | $1,500 | $1.36 | 45d | 1 | 1.25mi |
| 2208 Monterrey Dr Orange, TX | 3.0 | 1.0 | 1132 | $1,200 | $1.06 | 45d | 1 | 1.41mi |
Listing history 21 events
-
2026-06-21days on market $47,999 Active 478 DOM
-
2026-06-18days on market $47,999 Active 475 DOM
-
2026-06-17days on market $47,999 Active 474 DOM
-
2026-06-16days on market $47,999 Active 473 DOM
-
2026-06-15days on market $47,999 Active 472 DOM
-
2026-06-14days on market $47,999 Active 470 DOM
-
2026-06-13days on market $47,999 Active 469 DOM
-
2026-06-10days on market $47,999 Active 467 DOM
-
2026-06-09days on market $47,999 Active 466 DOM
-
2026-06-08days on market $47,999 Active 465 DOM
-
2026-06-07days on market $47,999 Active 464 DOM
-
2026-06-03days on market $47,999 Active 460 DOM
-
2026-06-02days on market $47,999 Active 459 DOM
-
2026-06-01days on market $47,999 Active 458 DOM
-
2026-05-31days on market $47,999 Active 457 DOM
-
2026-05-30days on market $47,999 Active 456 DOM
-
2026-02-20price $47,999 982-char remark
Show marketing remark (982 chars)
INVESTORS! Welcome to 2006 2nd St, a renovation-ready home in Orange, TX! With two bedrooms, one bathroom, and 1,704 square feet of livable space, this property offers ample potential for customization. Featuring wood/vinyl flooring throughout most of the home and a spacious kitchen with its own designated area, it provides a solid foundation for renovation. Additionally, arched walkways and built-in shelving add character to the space. Situated on a generous 14,810 square foot lot, this property offers plenty of land value and endless possibilities for outdoor activities or whatever you desire. This location is just 30 minutes from Lake Charles! This property is part of an ORANGE COUNTY INVESTOR PACKAGE that is available for a limited time. WE MAKE IT EASY TO OWN. This is a great opportunity! Don't wait, call us today to get more information on the owner's easy terms and smooth process that may be able to put the deed in your name and make this your dream investment.
-
2025-08-18price $54,999 982-char remark
Show marketing remark (982 chars)
INVESTORS! Welcome to 2006 2nd St, a renovation-ready home in Orange, TX! With two bedrooms, one bathroom, and 1,704 square feet of livable space, this property offers ample potential for customization. Featuring wood/vinyl flooring throughout most of the home and a spacious kitchen with its own designated area, it provides a solid foundation for renovation. Additionally, arched walkways and built-in shelving add character to the space. Situated on a generous 14,810 square foot lot, this property offers plenty of land value and endless possibilities for outdoor activities or whatever you desire. This location is just 30 minutes from Lake Charles! This property is part of an ORANGE COUNTY INVESTOR PACKAGE that is available for a limited time. WE MAKE IT EASY TO OWN. This is a great opportunity! Don't wait, call us today to get more information on the owner's easy terms and smooth process that may be able to put the deed in your name and make this your dream investment.
-
2025-02-28historical
-
2025-02-21$61,749 Active 982-char remark
Show marketing remark (982 chars)
INVESTORS! Welcome to 2006 2nd St, a renovation-ready home in Orange, TX! With two bedrooms, one bathroom, and 1,704 square feet of livable space, this property offers ample potential for customization. Featuring wood/vinyl flooring throughout most of the home and a spacious kitchen with its own designated area, it provides a solid foundation for renovation. Additionally, arched walkways and built-in shelving add character to the space. Situated on a generous 14,810 square foot lot, this property offers plenty of land value and endless possibilities for outdoor activities or whatever you desire. This location is just 30 minutes from Lake Charles! This property is part of an ORANGE COUNTY INVESTOR PACKAGE that is available for a limited time. WE MAKE IT EASY TO OWN. This is a great opportunity! Don't wait, call us today to get more information on the owner's easy terms and smooth process that may be able to put the deed in your name and make this your dream investment.
-
2024-11-04$61,749 Active
ⓘ Source: listings_history table (triggers on properties + properties_extension) + one-shot
backfill from property_details.listing_events for pre-trigger history.
Tax reassessment forecast TX · Resets to sale price
- Current annual tax
- $686 · $57/mo
- Projected year-2 tax
- $878 · $73/mo
- Expected delta
- +$192/yr (+$16/mo · 28.0%)
ⓘ Screening estimate from a state-policy table — verify with the county assessor before closing.
Climate risk First Street
- Flood 7/10 Severe FEMA zone X (shaded) · 92% chance over 30 yrs
- Wildfire 2/10 Low
- Heat 9/10 Extreme 7 d/yr ≥109°F today · 24 d/yr by 30 yrs out
- Wind 9/10 Extreme 99% chance of damaging wind over 30 yrs
- Air quality 3/10 Moderate 2 unhealthy d/yr today · 3 by 30 yrs out
Nearby sold comps map
Loading sold comps map…
Walkable amenities ~0.75 mi
Loading nearby amenities…
Taxation est. · year 1
- Rental income
- $13,794
- − Mortgage interest
- −$2,689
- − Property taxes
- −$686
- − Insurance
- −$1,037
- − Repairs & maintenance
- −$1,104
- − Management
- −$1,104
- − Depreciation
- −$1,396
- Taxable income
- $5,779
- Est. tax owed @ 24.0%
- −$1,387
- After-tax cash flow
- $4,766/yr
For passive investors: Depreciation is non-cash, so a rental often shows a tax loss while cash-flowing — sheltering income. Rental losses are passive: they offset passive income freely, and up to $25,000/yr can offset ordinary (W-2) income if you actively participate and your MAGI is under $100k (phasing out to $0 by $150k); unused losses carry forward. On sale, claimed depreciation is recaptured at up to 25%, and gains may owe capital-gains tax (a 1031 exchange can defer both). Figures are a year-1 estimate at your 24.0% rate — not tax advice; consult a CPA.
Schools (NCES district)
- District
- West Orange-Cove CISD
- NCES district ID
- 4845090
- Math proficiency
- 17% ▼ -7.00%
- Reading proficiency
- 21% ▼ -2.00%
- Median HH income
- $37,329
- Composite
- 15.86/100
- National rank
- #9260
- State rank
- #784 of 826 in TX
Livability — Orange
- Score
- 71/100
- State rank
- #286
- US rank
- #6456
Category grades
Schools grade is shown separately in the Schools card above.
Census & demographics
- Census place
- Orange, TX
- County
- Orange County · 87,112 people
- City population
- 22,976
- Metro
- Beaumont-Port Arthur, TX
- Population (ZIP)
- 28,983
- Household income
- $64,373
- Rent vs Own
- Severe rent burden
- 1018.0
Population outlook (Orange County) Hauer SSP2
- Today (2025)
- 88,065 people
- By 2030
- 89,591 · +1.7%
- By 2040
- 91,982 · +4.4%
- By 2050
- 93,023 · +5.6%
- By 2075
- 94,871 · +7.7%
- By 2100
- 88,155 · +0.1%
Race, ethnicity, and origin ACS 2023
- Neighborhood character
- Majority White (64%)
- Race & ethnicity
- White 64% Black 21% Hispanic / Latino 11% Two or more races 9%
- Hispanic origin (detail)
- Mexican 7%
- Common ancestry
- Lithuanian 13% Italian 1% Slovak 1%
- Foreign-born
- 5% · Canada
- Languages at home
- 91% English-only · Spanish 7% French/Haitian/Cajun 1% Other Asian/Pacific 1%
Political lean MEDSL · Orange
- 2024 margin
- Solid R (+66.8) · D 16.4% · R 83.1%
- 2008→2024 swing
- -19.6pp toward R · 2008: -47.1pp · 2024: -66.8pp
- All cycles
- 2024: R+66.8 2020: R+63.4 2016: R+61.9 2012: R+54.3 2008: R+47.1
Not yet ingested
- Civics
- —
Market trends
- HPI YoY
- ▲ 1.01%
- Current HPI
- 264.14
- Rent YoY
- ▲ 5.71%
- Metro
- Beaumont-Port Arthur, TX
- State GDP YoY
- ▲ 3.95%
- F500 in state
- 110
Industry mix (Fortune 500 HQ in TX)
| Industry | F500 HQs | Revenue |
|---|---|---|
| Energy | 16 | $1,198B |
|
||
| Technology | 5 | $198B |
|
||
| Engineering / Construction | 4 | $72B |
|
||
| Energy Services | 3 | $60B |
|
||
| Utilities | 3 | $41B |
|
||
| Healthcare | 2 | $330B |
|
||
Price history
-22.3% since first listed5 events — show timeline
- 2026-02-20 Price Changed $47,999 HARMLS
- 2025-08-18 Price Changed $54,999 HARMLS
- 2025-02-28 Listing Removed — HARMLS
- 2025-02-21 Listed $61,749 HARMLS
- 2024-11-04 Listed $61,749 HARMLS
Property tax history
-6.3%/yrLatest (2025): $686 · +0.0% YoY. Source: county tax records.
Cash-flow waterfall
monthlySold comps — $/sqft
last 12 mo · ≤1 miLoading sold comps…