4058 County Road 5360 · Willow Springs, MO
Flood risk 1/10 · Minimal
- FEMA flood zone
- X (unshaded)
- Chance of flooding over 30 yrs
- 0.0%
- Est. flood insurance / yr
- $473 – $860
Fire risk 6/10 · Moderate
- Est. fire insurance / yr
- $1,054 – $1,958
Heat risk 4/10 · Minor
- Hot days now (above 105°F)
- 7 days/yr
- Hot days in 30 yrs
- 19 days/yr
Wind risk 2/10 · Minimal
- Chance of severe wind over 30 yrs
- 2.0%
Air-quality risk 1/10 · Minimal
- Unhealthy air days now
- 0 days/yr
- Unhealthy air days in 30 yrs
- 0 days/yr
Risk factors via First Street. Map © Google.
Why this score? — see what drove the B grade
The composite is a weighted blend of 9 inputs, each scored 0–100. Each bar is that input's sub-score; the figure is the points it added to the 100-point composite (weight × sub-score).
- Cash flow +30.0/30.0
- 1% rule +10.0/10.0
- DSCR +10.0/10.0
- ARV discount +9.9/15.0
- Schools +3.4/10.0
- Livability +3.1/5.0
- Rent growth +2.5/5.0
- Condition / age +2.5/5.0
- Appreciation +0.7/10.0
$79,900
🖨 Deal sheet 📄 Offer letter ✓ Due diligence
Listing remarks MLS
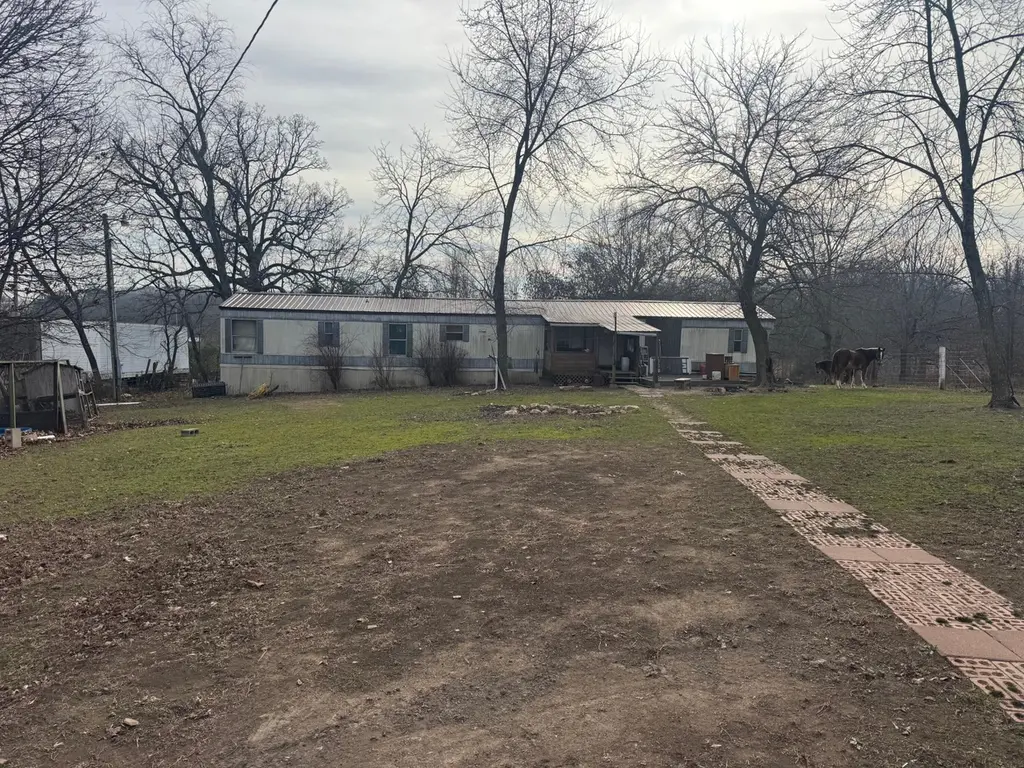
Check out this hobby farm! This property features over 5 acres, county road frontage, water, sewer, and electric! Whether you're looking to remodel the existing home or build your dream home, this is the perfect opportunity!
Key facts
- Water
- Hobby farm
- Sewer
Tags
Neighborhood map
What this means for you Summary
Snapshot
- This is a 4-bed/2.0-bath other listed at $80k.
Deal economics
- At list price, monthly cash flow is $550 ($7k/yr) — positive.
- The deal already cash-flows at list — no discount required.
- Meets the 1% rule at list price ($1k rent vs $80k).
- Recommended offer: $70k (12.0% below list) — sets the bar for market timing.
- Cap rate 14.5% vs local median 3.7% in Willow Springs — top-decile yield for the area; either an underpriced asset or a hidden risk that comps aren't pricing in. Stress-test before assuming the spread holds.
Location & tenants
- Location reads 62/100 on livability (#386 in MO) — a middle-class / working-renter tenant base. Strengths: crime A+, cost of living A+; Watch: schools F, amenities F, commute F.
- Willow Springs R-IV (rural): math 34% / reading 50% proficiency, ranked #140 of 324 in MO (top 43%) — families likely to look elsewhere, expect single-tenant / working-renter base with shorter leases.
- Market conditions: 80 active listings in the ZIP; 53 units permitted in Howell County in 2024 (0 in 5+ unit buildings).
Forward outlook
- Local home prices are declining (-3.0%/yr); year-one equity from $552 of loan paydown is wiped out by about $2k of value loss. Plan a longer hold.
- Howell County population projected at -18% by 2050 — secular population decline; favor cash flow + early exit over multi-decade hold.
- At projected returns (-3.0% appreciation + 3.0% rent growth), your $22k cash investment doubles in ~5 years — after that, you're playing with house money.
Negotiation context
- It's been on market 141 days — a 12% lower offer ($70k) is reasonable based on typical stale-listing flexibility.
- 2 sale attempts since 9y ago; this cycle's ask has dropped $15k (16%) from the opening price — seller is motivated, your offer sets the floor, not the list.
Risks & watch-outs
- Climate carrying-cost: major wildfire risk — expect insurance premiums to compound above CPI over the hold.
Questions for the listing agent
- It's been on market 141 days. Have you received any prior offers? Is the seller open to a 12% concession, seller financing, or rate buy-down credit?
- Why hasn't it sold? Are there any deal-killer items the seller is aware of (foundation, flood, title, zoning, code violations)?
- Is there a deadline driving the sale (1031 exchange, divorce, estate, relocation)? That informs how much negotiation room exists.
- Schools are F-rated, which usually means shorter tenancies and higher turnover. Who's the typical renter profile here, and what's been the actual vacancy rate?
- What's the average days-on-market for RENTAL listings here right now (not sales)? A rising rental-DOM trend means longer vacancies and softer asking-rent achievability than the comps imply.
- What's the recent tenant-quality profile in this submarket — average credit score on applications, eviction rate, late-payment / NSF rate, and stable-employment percentage? A property-management company in the area should have these aggregated.
- How much new for-sale + rental construction is in the pipeline within 1–3 miles? Heavy new supply typically softens prices + rents 12–24 months out; constrained supply supports both.
Investment metrics
- 1% rule
- 1.62% ✓
- Cap rate
- 14.55%
- Cash-on-cash
- 29.48%
- DSCR
- 2.31
- GRM
- 5.2
CMA / ARV
- ARV (median comp)
- $84,316
- List price
- $79,900
- Delta
- -5.24%
- Verdict
- FAIR
- Comps
- 1 within 2.0 mi
Projected returns pro-forma
-3.0% appreciation · 3.0% rent growth · sell at horizon
- IRR
- 23.9%
- Equity multiple
- 1.98×
- Total profit
- $22,025
- Equity at exit
- $11,913
- IRR
- 31.8%
- Equity multiple
- 3.87×
- Total profit
- $64,127
- Equity at exit
- $6,908
Cash invested: $22,372 (down + closing). Projections, not guarantees.
Landlord ↔ Tenant lean methodology
- Overall (STATE)
- 81 Strongly Landlord-Friendly
- State Missouri
- 81 Strongly Landlord-Friendly · R+10
- County
- — inherits STATE
- City
- — inherits STATE
ZIP-level market 65793
- Home prices YoY
- -3.8%
- Active inventory
- 80
- Price-to-rent
- 5.2×
Monthly cashflow live
- Estimated rent
- $1,292 medium interval (Pro) →
- Mortgage (P&I)
- −$419
- Tax from tax record
- −$19 /mo · $226/yr
- Insurance
- −$33
- HOA
- −$0
- Vacancy / Maint / Mgmt
- −$271
- Net cashflow
- $550
Break-even live
UW: 25.0% down · 7.5% · 30yr · 1.5% tax · 5.0% vac · 8.0% maint · 8.0% mgmt
Financing live
Cash to close
- Down payment
- $19,975
- Closing costs
- $2,397
- Reserves months
- —
- Total cash needed
- —
Loan-product check · same deal, 3 products live
Conventional
25% down · 7.5% · 30yr
- Down + closing
- —
- Monthly P&I
- —
- Monthly cashflow
- —
- DSCR
- —
- Eligible?
- —
Personal DTI + credit; lowest rate.
DSCR
20% down · 8.5% · 30yr
- Down + closing
- —
- Monthly P&I
- —
- Monthly cashflow
- —
- DSCR
- —
- Eligible?
- —
No personal income docs; deal must DSCR.
Hard money
10% down · 12.0% · 12mo
- Down + closing
- —
- Monthly P&I
- —
- Monthly cashflow
- —
- DSCR
- —
- Eligible?
- —
Short-term bridge; refi at stabilization.
Listing history 20 events
-
2026-06-18days on market $79,900 Active 141 DOM
-
2026-06-17days on market $79,900 Active 140 DOM
-
2026-06-16days on market $79,900 Active 139 DOM
-
2026-06-15days on market $79,900 Active 138 DOM
-
2026-06-13days on market $79,900 Active 136 DOM
-
2026-06-12days on market $79,900 Active 135 DOM
-
2026-06-09days on market $79,900 Active 132 DOM
-
2026-06-08days on market $79,900 Active 131 DOM
-
2026-06-07days on market $79,900 Active 130 DOM
-
2026-06-07days on market $79,900 Active 129 DOM
-
2026-06-04days on market $79,900 Active 126 DOM
-
2026-06-02pricedays on market $79,900 Active 125 DOM
-
2026-06-01days on market $84,900 Active 124 DOM
-
2026-05-31days on market $84,900 Active 123 DOM
-
2026-03-13price $84,900 224-char remark
Show marketing remark (224 chars)
Check out this hobby farm! This property features over 5 acres, county road frontage, water, sewer, and electric! Whether you're looking to remodel the existing home or build your dream home, this is the perfect opportunity!
-
2026-01-28$95,000 Active 224-char remark
Show marketing remark (224 chars)
Check out this hobby farm! This property features over 5 acres, county road frontage, water, sewer, and electric! Whether you're looking to remodel the existing home or build your dream home, this is the perfect opportunity!
-
2018-01-19soldstatus 478-char remark
Show marketing remark (478 chars)
Cute little hobby farm on 5 acres m/l! 4 bedroom, 2 bath 16x80 mobile with covered front porch sits back off road with landscaped front yard, Goldfish Koi Pond with waterfall, beautiful oak trees, garden spot, fruit trees, pigeon/chicken house, barn, storage shed, cellar, back deck, 2 electric meters and the Pheasant pens optional. There is an outside wood furnace that is 3 years old, private drilled well, lagoon and fenced on 3 sides. The washer & dryer are included.
-
2017-12-02$69,900 478-char remark
Show marketing remark (478 chars)
Cute little hobby farm on 5 acres m/l! 4 bedroom, 2 bath 16x80 mobile with covered front porch sits back off road with landscaped front yard, Goldfish Koi Pond with waterfall, beautiful oak trees, garden spot, fruit trees, pigeon/chicken house, barn, storage shed, cellar, back deck, 2 electric meters and the Pheasant pens optional. There is an outside wood furnace that is 3 years old, private drilled well, lagoon and fenced on 3 sides. The washer & dryer are included.
-
2006-10-18soldstatus
-
1995-08-02soldstatus
ⓘ Source: listings_history table (triggers on properties + properties_extension) + one-shot
backfill from property_details.listing_events for pre-trigger history.
Tax reassessment forecast MO · Resets to sale price
- Current annual tax
- $226 · $19/mo
- Projected year-2 tax
- $775 · $65/mo
- Expected delta
- +$549/yr (+$46/mo · 242.6%)
ⓘ Screening estimate from a state-policy table — verify with the county assessor before closing.
Climate risk First Street
- Flood 1/10 Low FEMA zone X (unshaded) · 0% chance over 30 yrs
- Wildfire 6/10 Major
- Heat 4/10 Moderate 7 d/yr ≥105°F today · 19 d/yr by 30 yrs out
- Wind 2/10 Low 2% chance of damaging wind over 30 yrs
- Air quality 1/10 Low 0 unhealthy d/yr today · 0 by 30 yrs out
Nearby sold comps map
Loading sold comps map…
Walkable amenities ~0.75 mi
Loading nearby amenities…
Taxation est. · year 1
- Rental income
- $15,505
- − Mortgage interest
- −$4,476
- − Property taxes
- −$226
- − Insurance
- −$400
- − Repairs & maintenance
- −$1,240
- − Management
- −$1,240
- − Depreciation
- −$2,324
- Taxable income
- $5,598
- Est. tax owed @ 24.0%
- −$1,344
- After-tax cash flow
- $5,251/yr
For passive investors: Depreciation is non-cash, so a rental often shows a tax loss while cash-flowing — sheltering income. Rental losses are passive: they offset passive income freely, and up to $25,000/yr can offset ordinary (W-2) income if you actively participate and your MAGI is under $100k (phasing out to $0 by $150k); unused losses carry forward. On sale, claimed depreciation is recaptured at up to 25%, and gains may owe capital-gains tax (a 1031 exchange can defer both). Figures are a year-1 estimate at your 24.0% rate — not tax advice; consult a CPA.
Schools (NCES district)
- District
- Willow Springs R-IV
- NCES district ID
- 2932070
- Math proficiency
- 34% ▲ 2.00%
- Reading proficiency
- 50% ▲ 2.00%
- Median HH income
- $32,334
- Composite
- 34.4/100
- National rank
- #5207
- State rank
- #140 of 324 in MO
Livability — Willow Springs
- Score
- 62/100
- State rank
- #386
- US rank
- #16837
Category grades
Schools grade is shown separately in the Schools card above.
Census & demographics
- City population
- 5,679
- Population (ZIP)
- 5,679
Population outlook (Howell County) Hauer SSP2
- Today (2025)
- 38,462 people
- By 2030
- 37,240 · -3.2%
- By 2040
- 34,495 · -10.3%
- By 2050
- 31,450 · -18.2%
- By 2075
- 23,660 · -38.5%
- By 2100
- 16,373 · -57.4%
Race, ethnicity, and origin ACS 2023
- Neighborhood character
- Predominantly White (89%)
- Race & ethnicity
- White 89% Two or more races 8% Hispanic / Latino 4%
- Common ancestry
- Romanian 2% Serbian 2% Slovak 1%
- Foreign-born
- 2%
- Languages at home
- 97% English-only · French/Haitian/Cajun 1% Spanish 1%
Political lean MEDSL · Howell
- 2024 margin
- Solid R (+66.8) · D 16.2% · R 83.0%
- 2008→2024 swing
- -36.0pp toward R · 2008: -30.8pp · 2024: -66.8pp
- All cycles
- 2024: R+66.8 2020: R+64.2 2016: R+63.2 2012: R+43.8 2008: R+30.8
Not yet ingested
- Civics
- —
Market trends
- HPI YoY
- ▼ -8.63%
- Current HPI
- 220.7596
- Rent YoY
- —
- Metro
- —
- State GDP YoY
- ▲ 1.84%
- F500 in state
- 20
Industry mix (Fortune 500 HQ in MO)
| Industry | F500 HQs | Revenue |
|---|---|---|
| Healthcare | 1 | $163B |
|
||
| Insurance | 1 | $21B |
|
||
| Industrial Technology | 1 | $17B |
|
||
| Retail | 1 | $16B |
|
||
| Industrial Distribution | 1 | $10B |
|
||
| Utilities | 1 | $9B |
|
||
Price history
+21.5% since first listed6 events — show timeline
- 2026-03-13 Price Changed $84,900 SOMO
- 2026-01-28 Listed $95,000 SOMO
- 2018-01-19 Sold (MLS) — SOMO
- 2017-12-02 Listed $69,900 SOMO
- 2006-10-18 Sold (Public Records) — Public Records
- 1995-08-02 Sold (Public Records) — Public Records
Property tax history
+2.2%/yrLatest (2025): $226 · +11.6% YoY. Source: county tax records.
Cash-flow waterfall
monthlySold comps — $/sqft
last 12 mo · ≤1 miLoading sold comps…