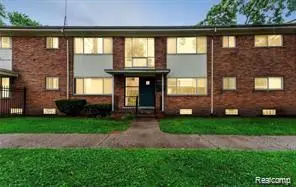
17282 Bentler St · Detroit, MI
Flood risk 1/10 · Minimal
- FEMA flood zone
- X (unshaded)
- Chance of flooding over 30 yrs
- 0.0%
- Est. flood insurance / yr
- $507 – $1,088
Fire risk 1/10 · Minimal
- Est. fire insurance / yr
- $784 – $1,456
Heat risk 3/10 · Minor
- Hot days now (above 98°F)
- 7 days/yr
- Hot days in 30 yrs
- 15 days/yr
Wind risk 2/10 · Minimal
- Chance of severe wind over 30 yrs
- —
Air-quality risk 3/10 · Minor
- Unhealthy air days now
- 2 days/yr
- Unhealthy air days in 30 yrs
- 3 days/yr
Risk factors via First Street. Map © Google.
Why this score? — see what drove the D grade
The composite is a weighted blend of 9 inputs, each scored 0–100. Each bar is that input's sub-score; the figure is the points it added to the 100-point composite (weight × sub-score).
- Cash flow +15.0/30.0
- ARV discount +7.5/15.0
- 1% rule +5.0/10.0
- DSCR +5.0/10.0
- Rent growth +4.5/5.0
- Livability +3.7/5.0
- Condition / age +2.5/5.0
- Schools +1.3/10.0
- Appreciation +0.0/10.0
$10,000
🖨 Deal sheet (PDF) 📄 Offer letter ✓ Due diligence
Listing remarks MLS
Fire damaged unit. Bring best offer. Batvai
Key facts
- $345 HOA
- Built 1957
- Listed 158 days
Neighborhood map
What this means for you Summary
Snapshot
- This is a 1-bed/1.0-bath condo listed at $10k.
Deal economics
- At list price, monthly cash flow is $300 ($4k/yr) — positive.
- The deal already cash-flows at list — no discount required.
- Meets the 1% rule at list price ($904 rent vs $10k).
- Recommended offer: $9k (12.0% below list) — sets the bar for market timing.
- Cap rate 42.3% vs local median 10.0% in Detroit — top-decile yield for the area; either an underpriced asset or a hidden risk that comps aren't pricing in. Stress-test before assuming the spread holds.
Location & tenants
- Location reads 73/100 on livability (#218 in MI) — a middle-class / working-renter tenant base. Strengths: amenities A+, commute A+, cost of living A+; Watch: crime F, employment F.
- Detroit Public Schools Community District (urban): math 10% / reading 24% proficiency, ranked #499 of 540 in MI (top 92%) — low school quality limits family demand, transient renter base, plan for 1-2y turnover; 90% free/reduced lunch — lower-income household profile, screen leases tightly.
- Zoned schools: Emerson Elementarymiddle School (519 students, 90% FRL); Henry Ford High School (math 24% / reading 24%, grade F, #481 of 713 statewide, top 81%, 712 students, 86% FRL) — zoned schools at 88% FRL track the district average.
- Market conditions: Rents rising fast (+8.0%/yr); 309 active listings in the ZIP; 21 comparable units currently listed for rent nearby; rentals at typical pace (median 26d on market — plan ~3-4 weeks tenant-placement turnaround); lower-income renter base — watch delinquency; 2,639 units permitted in Wayne County in 2024 (1,216 in 5+ unit buildings).
Forward outlook
- Local home prices are declining (-3.0%/yr); year-one equity from $69 of loan paydown is wiped out by about $300 of value loss. Plan a longer hold.
- Wayne County population projected at -17% by 2050 — secular population decline; favor cash flow + early exit over multi-decade hold.
- At projected returns (-3.0% appreciation + 8.0% rent growth), your $3k cash investment doubles in ~1 year — after that, you're playing with house money.
Negotiation context
- It's been on market 158 days — a 12% lower offer ($9k) is reasonable based on typical stale-listing flexibility.
- 2 sale attempts; this cycle's ask has dropped $5k (33%) from the opening price — seller is motivated, your offer sets the floor, not the list.
Risks & watch-outs
- Watch-outs: HOA is 38% of rent; built in 1957 — expect roof / HVAC / electrical / plumbing capex.
Questions for the listing agent
- It's been on market 158 days. Have you received any prior offers? Is the seller open to a 12% concession, seller financing, or rate buy-down credit?
- Built in 1957 — when were the roof, HVAC, electrical panel, plumbing, and water heater last replaced?
- What does the HOA fee cover, when was the last increase, and are there any pending special assessments or reserve-fund shortfalls?
- Any open or pending special assessments — roof, HVAC, plumbing, elevator, façade? What's the per-unit balance and payoff schedule, and is the seller paying it off at close or rolling it to the buyer?
- Why hasn't it sold? Are there any deal-killer items the seller is aware of (foundation, flood, title, zoning, code violations)?
- Is there a deadline driving the sale (1031 exchange, divorce, estate, relocation)? That informs how much negotiation room exists.
- Schools are F-rated, which usually means shorter tenancies and higher turnover. Who's the typical renter profile here, and what's been the actual vacancy rate?
- Crime grade is F in this area — have there been break-ins, vandalism, or insurance claims at this property in the last 3 years? What carrier currently insures it and at what premium?
- The area grade is low — what's the realistic commute time and amenity access for the typical tenant pool here? Any planned neighborhood developments (good or bad) we should know about?
- What's the average days-on-market for RENTAL listings here right now (not sales)? A rising rental-DOM trend means longer vacancies and softer asking-rent achievability than the comps imply.
- What's the recent tenant-quality profile in this submarket — average credit score on applications, eviction rate, late-payment / NSF rate, and stable-employment percentage? A property-management company in the area should have these aggregated.
- How much new apartment / multifamily construction is in the pipeline within 1–3 miles? Heavy new supply (>2% of stock underway) typically softens rents 12–24 months out; light construction supports rent growth.
Investment metrics
- 1% rule
- 9.04% ✓
- Cap rate
- 42.31%
- Cash-on-cash
- 128.63%
- DSCR
- 6.72
- GRM
- 0.9
CMA / ARV
No comps found within radius.
Projected returns pro-forma
-3.0% appreciation · 8.0% rent growth · sell at horizon
- IRR
- —
- Equity multiple
- 9.04×
- Total profit
- $22,499
- Equity at exit
- $1,491
- IRR
- —
- Equity multiple
- 24.88×
- Total profit
- $66,869
- Equity at exit
- $865
Cash invested: $2,800 (down + closing). Projections, not guarantees.
Landlord ↔ Tenant lean methodology
- Overall (STATE)
- 62 Landlord-Friendly
- State Michigan
- 62 Landlord-Friendly · EVEN
- County
- — inherits STATE
- City
- — inherits STATE
ZIP-level market 48219
- Home prices YoY
- -10.3%
- Rents YoY
- 8.0%
- Active inventory
- 309
- Price-to-rent
- 0.9×
Monthly cashflow live
- Estimated rent
- $904 high interval (Pro) →
- Mortgage (P&I)
- −$52
- Tax est. 1.5%
- −$12 /mo · $150/yr
- Insurance
- −$4
- HOA
- −$345
- Vacancy / Maint / Mgmt
- −$190
- Net cashflow
- $300
Break-even live
Sensitivity live
| Price | -10% $307 | -5% $304 | +0% $300 | +5% $297 | +10% $293 |
|---|---|---|---|---|---|
| Rent | -10% $229 | -5% $264 | +0% $300 | +5% $336 | +10% $372 |
| Rate | -1.0pp $305 | -0.5pp $303 | base $300 | +0.5pp $298 | +1.0pp $295 |
UW: 25.0% down · 7.5% · 30yr · 1.5% tax · 5.0% vac · 8.0% maint · 8.0% mgmt
Financing live
Cash to close
- Down payment
- $2,500
- Closing costs
- $300
- Reserves months
- —
- Total cash needed
- —
Loan-product check · same deal, 3 products live
Conventional
25% down · 7.5% · 30yr
- Down + closing
- —
- Monthly P&I
- —
- Monthly cashflow
- —
- DSCR
- —
- Eligible?
- —
Personal DTI + credit; lowest rate.
DSCR
20% down · 8.5% · 30yr
- Down + closing
- —
- Monthly P&I
- —
- Monthly cashflow
- —
- DSCR
- —
- Eligible?
- —
No personal income docs; deal must DSCR.
Hard money
10% down · 12.0% · 12mo
- Down + closing
- —
- Monthly P&I
- —
- Monthly cashflow
- —
- DSCR
- —
- Eligible?
- —
Short-term bridge; refi at stabilization.
Rent comps 21 comps
| Address | Beds | Baths | Sqft | Rent | $/sqft | DOM | Units | Dist |
|---|---|---|---|---|---|---|---|---|
| 17274 Bentler St Detroit, MI | 2.0 | 1.0 | 700 | $850 | $1.21 | 45d | 2 | 0.02mi |
| 17274 Bentler St Detroit, MI | 2.0 | 1.0 | 700 | $838 | $1.20 | 26d | 2 | 0.02mi |
| 17274 Bentler St #46 Detroit, MI | 2.0 | 1.0 | 700 | $850 | $1.21 | 18d | 1 | 0.04mi |
| 17270 Bentler St Detroit, MI | 2.0 | 1.0 | 650 | $850 | $1.31 | 45d | 1 | 0.05mi |
| 16854 Lahser Rd Detroit, MI | 1.0 | 1.0 | 680 | $885 | $1.30 | 14d | 1 | 0.35mi |
| 16885 Lahser Rd Unit 1A Detroit, MI | 1.0 | 1.0 | 650 | $750 | $1.15 | 6d | 1 | 0.36mi |
| 16885 Lahser Rd Apt 3A Detroit, MI | 1.0 | 1.0 | 700 | $750 | $1.07 | 45d | 1 | 0.36mi |
| 17644 Lahser Rd Unit 7 Detroit, MI | 1.0 | 1.0 | 600 | $995 | $1.66 | 26d | 1 | 0.37mi |
| 18045 Lahser Rd Detroit, MI | 1.0 | 1.0 | 670 | $960 | $1.43 | 6d | 2 | 0.44mi |
| 16700 Lahser Rd Apt 18 Detroit, MI | 2.0 | 1.0 | 750 | $900 | $1.20 | 45d | 1 | 0.46mi |
| 18350 Lahser Rd Detroit, MI | 1.0 | 1.0 | 600 | $950 | $1.58 | 45d | 1 | 0.53mi |
| 18400 Lahser Rd Detroit, MI | 1.0 | 1.0 | 620 | $950 | $1.53 | 26d | 1 | 0.56mi |
| 18450 Lahser Rd Apt 1 Detroit, MI | 1.0 | 1.0 | 650 | $820 | $1.26 | 6d | 1 | 0.59mi |
| 18274 Fielding St Detroit, MI | 2.0 | 1.0 | 700 | $1,200 | $1.71 | 18d | 1 | 0.64mi |
| 16194 Fielding St Unit 2 Detroit, MI | 2.0 | 1.0 | 750 | $950 | $1.27 | 16d | 1 | 0.71mi |
| 24244 Dale St Unit 211 Detroit, MI | 1.0 | 1.0 | 550 | $800 | $1.45 | 26d | 1 | 1.31mi |
| 15143 Evergreen Rd Detroit, MI | 2.0 | 1.0 | 653 | $875 | $1.34 | 26d | 1 | 1.38mi |
| 15143 Evergreen Rd Detroit, MI | 2.0 | 1.0 | 653 | $875 | $1.34 | 23d | 1 | 1.38mi |
| 24235 W McNichols Rd Detroit, MI | 1.0 | 1.0 | 700 | $800 | $1.14 | 45d | 4 | 1.40mi |
| 19255 Shiawassee Dr Apt 105 Detroit, MI | 1.0 | 1.0 | 680 | $950 | $1.40 | 6d | 1 | 1.48mi |
| 16581 Wormer St Detroit, MI | 2.0 | 1.0 | 720 | $1,100 | $1.53 | 45d | 1 | 1.48mi |
HOA detail condo
- Monthly dues
- $345 · $4,140/yr
- Assessments
- None detected in remarks — confirm with the listing agent.
Listing history 3 events
-
2026-05-31days on market $10,000 Active 158 DOM
-
2025-12-24$15,000 Active 43-char remark
Show marketing remark (43 chars)
Fire damaged unit. Bring best offer. Batvai
-
2025-12-24$15,000 Active 43-char remark
Show marketing remark (43 chars)
Fire damaged unit. Bring best offer. Batvai
ⓘ Source: listings_history table (triggers on properties + properties_extension) + one-shot
backfill from property_details.listing_events for pre-trigger history.
Climate risk First Street
- Flood 1/10 Low FEMA zone X (unshaded) · 0% chance over 30 yrs
- Wildfire 1/10 Low
- Heat 3/10 Moderate 7 d/yr ≥98°F today · 15 d/yr by 30 yrs out
- Wind 2/10 Low
- Air quality 3/10 Moderate 2 unhealthy d/yr today · 3 by 30 yrs out
Nearby sold comps map
Loading sold comps map…
Walkable amenities ~0.75 mi
Loading nearby amenities…
Taxation est. · year 1
- Rental income
- $10,849
- − Mortgage interest
- −$560
- − Property taxes
- −$150
- − Insurance
- −$50
- − Repairs & maintenance
- −$868
- − Management
- −$868
- − HOA
- −$4,140
- − Depreciation
- −$291
- Taxable income
- $3,922
- Est. tax owed @ 24.0%
- −$941
- After-tax cash flow
- $2,660/yr
For passive investors: Depreciation is non-cash, so a rental often shows a tax loss while cash-flowing — sheltering income. Rental losses are passive: they offset passive income freely, and up to $25,000/yr can offset ordinary (W-2) income if you actively participate and your MAGI is under $100k (phasing out to $0 by $150k); unused losses carry forward. On sale, claimed depreciation is recaptured at up to 25%, and gains may owe capital-gains tax (a 1031 exchange can defer both). Figures are a year-1 estimate at your 24.0% rate — not tax advice; consult a CPA.
Schools (NCES district)
- District
- Detroit Public Schools Community District
- NCES district ID
- 2601103
- Math proficiency
- 10% ▼ -2.00%
- Reading proficiency
- 24% ▲ 6.00%
- Median HH income
- $25,815
- Composite
- 13.06/100
- National rank
- #9564
- State rank
- #499 of 540 in MI
Livability — Detroit
- Score
- 73/100
- State rank
- #218
- US rank
- #5427
Category grades
Schools grade is shown separately in the Schools card above.
Census & demographics
- Census place
- Detroit, MI
- County
- Wayne County · 1,562,939 people
- City population
- 572,865
- Metro
- Detroit-Warren-Dearborn, MI
- Population (ZIP)
- 47,208
- Household income
- $43,655
- Rent vs Own
- Severe rent burden
- 3584.0
Population outlook (Wayne County) Hauer SSP2
- Today (2025)
- 1,675,273 people
- By 2030
- 1,620,300 · -3.3%
- By 2040
- 1,502,341 · -10.3%
- By 2050
- 1,384,039 · -17.4%
- By 2075
- 1,124,592 · -32.9%
- By 2100
- 881,193 · -47.4%
Race, ethnicity, and origin ACS 2023
- Neighborhood character
- Predominantly Black (88%)
- Race & ethnicity
- Black 88% White 5% Two or more races 4% Hispanic / Latino 1%
- Common ancestry
- Romanian 1% Lithuanian 1%
- Foreign-born
- 2% · Canada
- Languages at home
- 96% English-only · Spanish 1% French/Haitian/Cajun 1%
Political lean MEDSL · Wayne
- 2024 margin
- Strong D (+29.0) · D 62.7% · R 33.7% · Other 3.6%
- 2008→2024 swing
- -20.5pp toward R · 2008: 49.5pp · 2024: 29.0pp
- All cycles
- 2024: D+29.0 2020: D+38.1 2016: D+37.3 2012: D+46.9 2008: D+49.5
Not yet ingested
- Civics
- —
Market trends
- HPI YoY
- ▼ -65.06%
- Current HPI
- 563.3263
- Rent YoY
- ▲ 8.04%
- Metro
- Detroit-Warren-Dearborn, MI
- State GDP YoY
- ▲ 1.37%
- F500 in state
- 28
Industry mix (Fortune 500 HQ in MI)
| Industry | F500 HQs | Revenue |
|---|---|---|
| Automotive Parts | 3 | $48B |
|
||
| Automotive | 2 | $372B |
|
||
| Chemicals | 1 | $45B |
|
||
| Automotive Retail | 1 | $29B |
|
||
| Healthcare / Medical Devices | 1 | $23B |
|
||
| Automotive Technology | 1 | $20B |
|
||
Price history
+0.0% since first listed2 events — show timeline
- 2025-12-24 Listed $15,000 MiRealSource-MiMLS
- 2025-12-24 Listed $15,000 REALCOMP
Cash-flow waterfall
monthlySold comps — $/sqft
last 12 mo · ≤1 miLoading sold comps…