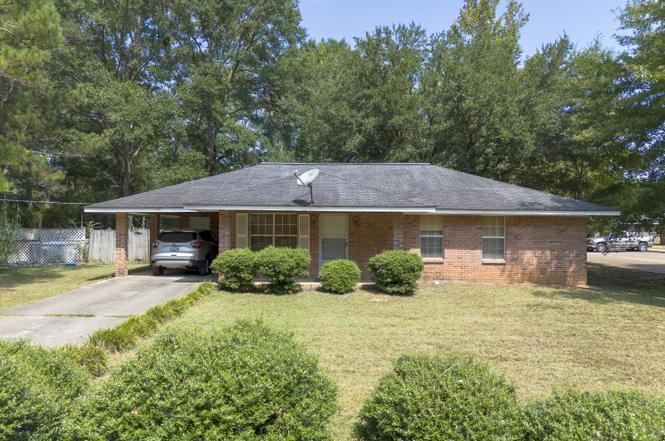
209 11th St · Mount Olive, MS
Flood risk No data
- FEMA flood zone
- —
- Chance of flooding over 30 yrs
- —
- Est. flood insurance / yr
- —
Fire risk No data
- Est. fire insurance / yr
- —
Heat risk No data
- Hot days now (above threshold)
- —
- Hot days in 30 yrs
- —
Wind risk No data
- Chance of severe wind over 30 yrs
- —
Air-quality risk No data
- Unhealthy air days now
- —
- Unhealthy air days in 30 yrs
- —
Risk factors via First Street. Map © Google.
Why this score? — see what drove the D grade
The composite is a weighted blend of 9 inputs, each scored 0–100. Each bar is that input's sub-score; the figure is the points it added to the 100-point composite (weight × sub-score).
- Cash flow +16.2/30.0
- Appreciation +8.8/10.0
- DSCR +5.0/10.0
- 1% rule +3.6/10.0
- Livability +3.3/5.0
- Rent growth +2.5/5.0
- Condition / age +2.5/5.0
- Schools +2.2/10.0
- ARV discount +0.0/15.0
$115,000
🖨 Deal sheet (PDF) 📄 Offer letter ✓ Due diligence
Listing remarks
Welcome to this beautiful 3-bedroom, 2-bathroom home perfectly situated on a large corner lot within the city limits. This property offers the perfect blend of comfort and convenience with an open living area, spacious kitchen, and a functional layout designed for modern living. Enjoy the private backyard, ideal for entertaining or relaxing, and take advantage of the proximity to local schools, shopping, dining, and parks. With its prime location and move-in-ready condition, this home is a must-see!
Key facts
- Proximity to parks
- Proximity to dining
- Private backyard
Tags
Property features AI
Exterior
- Parking: Carport (1 space)
- Utilities: Public water; Public sewer; Electricity available
- Home design: Single-family residence; House; One level
- Construction: Brick construction; Slab foundation; Built (year per public records)
- Exterior features: Shingle roof; Corner lot; Other exterior features
Interior
- Kitchen: Refrigerator
- Bathrooms: 2 full bathrooms
- Heating & cooling: Central heating; Central air conditioning
- Interior features: Refrigerator included; Laundry located inside
- Laundry & utility: Indoor laundry
Neighborhood map
What this means for you Summary
Snapshot
- This is a 3-bed/1.0-bath single-family listed at $115k.
Deal economics
- At list price, monthly cash flow is $61 ($729/yr) — positive.
- The deal already cash-flows at list — no discount required.
- To meet the 1% rule (rent ≥ 1% of price), the offer needs to be $99k (14.0% below list).
- Recommended offer: $99k (14.0% below list) — sets the bar for 1% rule.
Location & tenants
- Location reads 66/100 on livability (#93 in MS) — a middle-class / working-renter tenant base. Strengths: crime A+, cost of living A+, housing A+; Watch: health & safety D, schools F, amenities F.
- Covington County School District (rural): math 26% / reading 28% proficiency, ranked #78 of 130 in MS (top 60%) — low school quality limits family demand, transient renter base, plan for 1-2y turnover; 74% free/reduced lunch — lower-income household profile, screen leases tightly.
- Market conditions: 27 active listings in the ZIP.
Forward outlook
- In year one you build about $9k of equity ($795 loan paydown + $9k appreciation (7.6% local appreciation)).
- Covington County population projected at -15% by 2050 — secular population decline; favor cash flow + early exit over multi-decade hold.
- At projected returns (7.6% appreciation + 3.0% rent growth), your $32k cash investment doubles in ~3 years — after that, you're playing with house money.
- By year 4, paydown + projected appreciation supports a ~$33k cash-out refi (75% LTV) — recoverable capital for the next deal without selling this one.
Negotiation context
- It's been on market 245 days — a 12% lower offer ($101k) is reasonable based on typical stale-listing flexibility.
- 2 sale attempts; this cycle's ask has dropped $15k (12%) from the opening price — seller is motivated, your offer sets the floor, not the list.
Questions for the listing agent
- It's been on market 245 days. Have you received any prior offers? Is the seller open to a 14% concession, seller financing, or rate buy-down credit?
- Why hasn't it sold? Are there any deal-killer items the seller is aware of (foundation, flood, title, zoning, code violations)?
- Is there a deadline driving the sale (1031 exchange, divorce, estate, relocation)? That informs how much negotiation room exists.
- Schools are F-rated, which usually means shorter tenancies and higher turnover. Who's the typical renter profile here, and what's been the actual vacancy rate?
- The area grade is low — what's the realistic commute time and amenity access for the typical tenant pool here? Any planned neighborhood developments (good or bad) we should know about?
- What's the average days-on-market for RENTAL listings here right now (not sales)? A rising rental-DOM trend means longer vacancies and softer asking-rent achievability than the comps imply.
- What's the recent tenant-quality profile in this submarket — average credit score on applications, eviction rate, late-payment / NSF rate, and stable-employment percentage? A property-management company in the area should have these aggregated.
- How much new for-sale + rental construction is in the pipeline within 1–3 miles? Heavy new supply typically softens prices + rents 12–24 months out; constrained supply supports both.
Investment metrics
- 1% rule
- 0.86% ✗
- Cap rate
- 6.93%
- Cash-on-cash
- 2.26%
- DSCR
- 1.10
- GRM
- 9.7
CMA / ARV
- ARV (on-the-fly)
- $96,900
- Comps found
- 1
Show comp detail 1 sale within ~0.75 mi
| Address | Dist | Beds/Ba | Sqft | Sold | Price | $/sf | Match |
|---|---|---|---|---|---|---|---|
| 1001 Mckee St | 0.22mi | 3/2.0 | 1,178 (+3%) | 16mo | $100,000 | $85 | 66 |
Match score weights: distance 35% · size 25% · config 20% · recency 20%. Top-matched comps best support the ARV.
Projected returns pro-forma
7.57% appreciation · 3.0% rent growth · sell at horizon
- IRR
- 20.8%
- Equity multiple
- 2.49×
- Total profit
- $48,048
- Equity at exit
- $84,003
- IRR
- 19.3%
- Equity multiple
- 5.24×
- Total profit
- $136,443
- Equity at exit
- $163,635
Cash invested: $32,200 (down + closing). Projections, not guarantees.
Landlord ↔ Tenant lean methodology
- Overall (STATE)
- 90 Strongly Landlord-Friendly
- State Mississippi
- 90 Strongly Landlord-Friendly · R+11
- County
- — inherits STATE
- City
- — inherits STATE
ZIP-level market 39119
- Home prices YoY
- 5.3%
- Active inventory
- 27
- Price-to-rent
- 9.7×
Monthly cashflow live
- Estimated rent
- $990 medium interval (Pro) →
- Mortgage (P&I)
- −$603
- Tax from tax record
- −$70 /mo · $840/yr
- Insurance
- −$48
- HOA
- −$0
- Vacancy / Maint / Mgmt
- −$208
- Net cashflow
- $61
Break-even live
Sensitivity live
| Price | -10% $126 | -5% $93 | +0% $61 | +5% $28 | +10% $-4 |
|---|---|---|---|---|---|
| Rent | -10% $-17 | -5% $22 | +0% $61 | +5% $100 | +10% $139 |
| Rate | -1.0pp $119 | -0.5pp $90 | base $61 | +0.5pp $31 | +1.0pp $1 |
UW: 25.0% down · 7.5% · 30yr · 1.5% tax · 5.0% vac · 8.0% maint · 8.0% mgmt
Financing live
Cash to close
- Down payment
- $28,750
- Closing costs
- $3,450
- Reserves months
- —
- Total cash needed
- —
Loan-product check · same deal, 3 products live
Conventional
25% down · 7.5% · 30yr
- Down + closing
- —
- Monthly P&I
- —
- Monthly cashflow
- —
- DSCR
- —
- Eligible?
- —
Personal DTI + credit; lowest rate.
DSCR
20% down · 8.5% · 30yr
- Down + closing
- —
- Monthly P&I
- —
- Monthly cashflow
- —
- DSCR
- —
- Eligible?
- —
No personal income docs; deal must DSCR.
Hard money
10% down · 12.0% · 12mo
- Down + closing
- —
- Monthly P&I
- —
- Monthly cashflow
- —
- DSCR
- —
- Eligible?
- —
Short-term bridge; refi at stabilization.
Listing history 5 events
-
2026-03-20price $115,000
-
2026-02-22status Active
-
2026-01-23status Pending
-
2025-09-29price $120,000
-
2025-08-24$130,000 Active
ⓘ Source: listings_history table (triggers on properties + properties_extension) + one-shot
backfill from property_details.listing_events for pre-trigger history.
Tax reassessment forecast MS · Resets to sale price
- Current annual tax
- $840 · $70/mo
- Projected year-2 tax
- $909 · $76/mo
- Expected delta
- +$69/yr (+$6/mo · 8.2%)
ⓘ Screening estimate from a state-policy table — verify with the county assessor before closing.
Nearby sold comps map
Loading sold comps map…
Walkable amenities ~0.75 mi
Loading nearby amenities…
Taxation est. · year 1
- Rental income
- $11,874
- − Mortgage interest
- −$6,442
- − Property taxes
- −$840
- − Insurance
- −$575
- − Repairs & maintenance
- −$950
- − Management
- −$950
- − Depreciation
- −$3,345
- Taxable loss
- −$1,228
- Est. tax savings @ 24.0%
- +$295
- After-tax cash flow
- $1,024/yr
For passive investors: Depreciation is non-cash, so a rental often shows a tax loss while cash-flowing — sheltering income. Rental losses are passive: they offset passive income freely, and up to $25,000/yr can offset ordinary (W-2) income if you actively participate and your MAGI is under $100k (phasing out to $0 by $150k); unused losses carry forward. On sale, claimed depreciation is recaptured at up to 25%, and gains may owe capital-gains tax (a 1031 exchange can defer both). Figures are a year-1 estimate at your 24.0% rate — not tax advice; consult a CPA.
Schools (NCES district)
- District
- Covington County School District
- NCES district ID
- 2801290
- Math proficiency
- 26% ▼ -7.00%
- Reading proficiency
- 28% ▼ -4.00%
- Median HH income
- $33,020
- Composite
- 22.09/100
- National rank
- #8183
- State rank
- #78 of 130 in MS
Livability — Mount Olive
- Score
- 66/100
- State rank
- #93
- US rank
- #11501
Category grades
Schools grade is shown separately in the Schools card above.
Census & demographics
- Census place
- Mount Olive, MS
- Population (ZIP)
- 6,199
Population outlook (Covington County) Hauer SSP2
- Today (2025)
- 19,294 people
- By 2030
- 18,875 · -2.2%
- By 2040
- 17,777 · -7.9%
- By 2050
- 16,381 · -15.1%
- By 2075
- 12,704 · -34.2%
- By 2100
- 9,090 · -52.9%
Race, ethnicity, and origin ACS 2023
- Neighborhood character
- Majority Black (50%)
- Race & ethnicity
- Black 50% White 46% Two or more races 2% Hispanic / Latino 2%
- Common ancestry
- Serbian 4% Italian 1% Slovak 1%
- Foreign-born
- 0%
- Languages at home
- 99% English-only · Spanish 1%
Political lean MEDSL · Covington
- 2024 margin
- Solid R (+33.3) · D 33.0% · R 66.2%
- 2008→2024 swing
- -15.6pp toward R · 2008: -17.7pp · 2024: -33.3pp
- All cycles
- 2024: R+33.3 2020: R+26.0 2016: R+24.5 2012: R+16.2 2008: R+17.7
Not yet ingested
- Civics
- —
Market trends
- HPI YoY
- ▲ 7.57%
- Current HPI
- 150.7147
- Rent YoY
- —
- Metro
- —
- State GDP YoY
- —
- F500 in state
- 0
Price history
-11.5% since first listed5 events — show timeline
- 2026-03-20 Price Changed $115,000 MLSU
- 2026-02-22 Relisted — MLSU
- 2026-01-23 Pending — MLSU
- 2025-09-29 Price Changed $120,000 MLSU
- 2025-08-24 Listed $130,000 MLSU
Property tax history
+6.1%/yrLatest (2025): $840 · +0.0% YoY. Source: county tax records.
Cash-flow waterfall
monthlySold comps — $/sqft
last 12 mo · ≤1 miLoading sold comps…