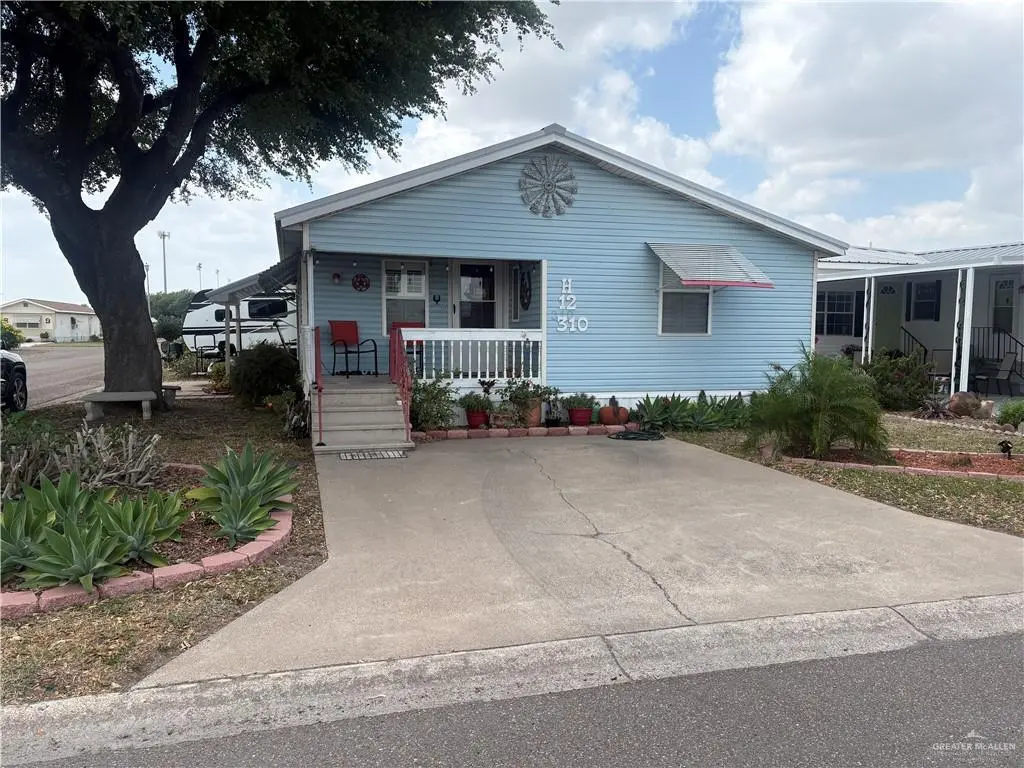
310 Randal Dr Unit H12 · Mission, TX
Flood risk 6/10 · Moderate
- FEMA flood zone
- A
- Chance of flooding over 30 yrs
- 0.74%
- Est. flood insurance / yr
- $1,009 – $1,996
Fire risk 4/10 · Minor
- Est. fire insurance / yr
- $1,222 – $2,270
Heat risk 9/10 · Severe
- Hot days now (above 111°F)
- 7 days/yr
- Hot days in 30 yrs
- 22 days/yr
Wind risk 8/10 · Major
- Chance of severe wind over 30 yrs
- 94.0%
Air-quality risk 2/10 · Minimal
- Unhealthy air days now
- 1 days/yr
- Unhealthy air days in 30 yrs
- 2 days/yr
Risk factors via First Street. Map © Google.
Why this score? — see what drove the C grade
The composite is a weighted blend of 9 inputs, each scored 0–100. Each bar is that input's sub-score; the figure is the points it added to the 100-point composite (weight × sub-score).
- Cash flow +29.2/30.0
- DSCR +10.0/10.0
- 1% rule +8.6/10.0
- Livability +3.8/5.0
- Condition / age +3.8/5.0
- Rent growth +2.7/5.0
- Schools +1.7/10.0
- ARV discount +0.0/15.0
- Appreciation +0.0/10.0
$87,000
🖨 Deal sheet 📄 Offer letter ✓ Due diligence
Listing remarks MLS
WOW - Nice 2 bed/2 bath 1986 Palm Harbor Home NOW AVAILABLE in Heritage Square, a 55+ Community in Mission. This FULLY FURNISHED home features recent upgrades like flooring, enclosed Texas Room, plantation shutters, and brand new stove. This split bedroom floor plan features spacious bathrooms in both the primary suite and near the guest bedroom. This home sits on a corner lot with beautiful landscaping and a giant mature tree that blankets your covered front and side patios (YES - 2 Patios) during warm sunny days while you relax with friends and neighbors! OH YEAH - It includes a well maintained 2014 E-Z GO Golf cart to cruise around the community. Heritage Square is an active 55+ community with amenities such as: swimming pool, hot tub, entertainment hall & community kitchen, social clubs, community events... and more. Conveniently located close to medical facilities, shopping, restaurant, and entertainment and only an hour and 1/2 from the beautiful beaches of South Padre Island.
Key facts
- 3,118 sq ft lot
- Parking
- Built 1992
Neighborhood map
What this means for you Summary
Snapshot
- This is a 2-bed/2.0-bath manufactured listed at $87k. Condition is rated good.
Deal economics
- At list price, monthly cash flow is $177 ($2k/yr) — positive.
- The deal already cash-flows at list — no discount required.
- Meets the 1% rule at list price ($1k rent vs $87k).
- Recommended offer: $82k (6.0% below list) — sets the bar for market timing.
- Cap rate 10.5% vs local median 3.5% in Mission — top-decile yield for the area; either an underpriced asset or a hidden risk that comps aren't pricing in. Stress-test before assuming the spread holds.
Location & tenants
- Location reads 75/100 on livability (#148 in TX, #4,155 nationally) — a middle-class / working-renter tenant base. Strengths: cost of living A+, housing A+, health & safety A+; Watch: schools C-, amenities F, commute F.
- Mission CISD (urban): math 15% / reading 28% proficiency, ranked #775 of 826 in TX (top 94%) — low school quality limits family demand, transient renter base, plan for 1-2y turnover; 78% free/reduced lunch — lower-income household profile, screen leases tightly.
- Market conditions: Rents flat; 852 active listings in the ZIP; 40 comparable units currently listed for rent nearby; rentals lingering (median 44d on market — plan ~5-8 weeks vacancy on turnover, expect pricing pressure); 50% of comp listings sitting > 30 days — soft ceiling on asking rent; 7,378 units permitted in Hidalgo County in 2024 (641 in 5+ unit buildings).
Forward outlook
- Local home prices are declining (-3.0%/yr); year-one equity from $601 of loan paydown is wiped out by about $3k of value loss. Plan a longer hold.
- Hidalgo County population projected at +28% by 2050 — long-run rental-demand tailwind backs the buy-and-hold thesis.
Negotiation context
- It's been on market 78 days — a 6% lower offer ($82k) is reasonable based on typical stale-listing flexibility.
Risks & watch-outs
- Watch-outs: flood insurance adds $125/mo.
- Climate carrying-cost: in FEMA flood zone A (mandatory federal flood insurance); severe wind risk, 94% chance of damaging wind over 30y; extreme-heat days projected 7→22/yr by 2055 (HVAC capex compounding) — expect insurance premiums to compound above CPI over the hold.
Questions for the listing agent
- It's been on market 78 days. Have you received any prior offers? Is the seller open to a 6% concession, seller financing, or rate buy-down credit?
- What's the actual annual flood-insurance premium (NFIP or private), and is the property in a SFHA with mandatory coverage?
- What does the HOA fee cover, when was the last increase, and are there any pending special assessments or reserve-fund shortfalls?
- Why hasn't it sold? Are there any deal-killer items the seller is aware of (foundation, flood, title, zoning, code violations)?
- Is there a deadline driving the sale (1031 exchange, divorce, estate, relocation)? That informs how much negotiation room exists.
- What's the average days-on-market for RENTAL listings here right now (not sales)? A rising rental-DOM trend means longer vacancies and softer asking-rent achievability than the comps imply.
- What's the recent tenant-quality profile in this submarket — average credit score on applications, eviction rate, late-payment / NSF rate, and stable-employment percentage? A property-management company in the area should have these aggregated.
- How much new for-sale + rental construction is in the pipeline within 1–3 miles? Heavy new supply typically softens prices + rents 12–24 months out; constrained supply supports both.
Investment metrics
- 1% rule
- 1.36% ✓
- Cap rate
- 10.46%
- Cash-on-cash
- 14.88%
- DSCR
- 1.66
- GRM
- 6.1
CMA / ARV
- ARV (median comp)
- $72,313
- List price
- $87,000
- Delta
- 20.31%
- Verdict
- OVERPRICED
- Comps
- 20 within 1.0 mi
Show comp detail 6 sales within ~0.75 mi
| Address | Dist | Beds/Ba | Sqft | Sold | Price | $/sf | Match |
|---|---|---|---|---|---|---|---|
| 1204 Deidre Dr | 0.07mi | 2/1.5 | 1,180 (+5%) | 12mo | $76,900 | $65 | 78 |
| 1203 Angela Dr | 0.16mi | 3/2.0 (+1) | 1,120 (-1%) | 14mo | $120,000 | $107 | 75 |
| 1302 Deidre Dr | 0.09mi | 3/2.0 (+1) | 1,216 (+8%) | 10mo | $155,000 | $127 | 70 |
| 502 Sagittarius St | 0.64mi | 2/2.0 | 1,064 (-6%) | 4mo | $110,000 | $103 | 58 |
| 1516 St Augustine Dr | 0.51mi | 3/2.0 (+1) | 1,140 (+1%) | 14mo | $145,000 | $127 | 58 |
| 416 Sagittarius St | 0.61mi | 3/2.0 (+1) | 1,292 (+14%) | 2mo | $90,000 | $70 | 41 |
Match score weights: distance 35% · size 25% · config 20% · recency 20%. Top-matched comps best support the ARV.
Projected returns pro-forma
-3.0% appreciation · 0.93% rent growth · sell at horizon
- IRR
- -5.8%
- Equity multiple
- 0.79×
- Total profit
- $-5,138
- Equity at exit
- $12,972
- IRR
- 0.6%
- Equity multiple
- 1.04×
- Total profit
- $976
- Equity at exit
- $7,522
Cash invested: $24,360 (down + closing). Projections, not guarantees.
Landlord ↔ Tenant lean methodology
- Overall (STATE)
- 87 Strongly Landlord-Friendly
- State Texas
- 87 Strongly Landlord-Friendly · R+5
- County
- — inherits STATE
- City
- — inherits STATE
ZIP-level market 78572
- Home prices YoY
- -22.9%
- Rents YoY
- 0.9%
- Active inventory
- 852
- Price-to-rent
- 6.1×
Monthly cashflow live
- Estimated rent
- $1,185 high interval (Pro) →
- Mortgage (P&I)
- −$456
- Tax est. 1.5%
- −$109 /mo · $1,305/yr
- Insurance
- −$36
- Flood insurance flood zone
- −$125 /mo · $1,502/yr
- HOA
- −$33
- Vacancy / Maint / Mgmt
- −$249
- Net cashflow
- $177
Break-even live
UW: 25.0% down · 7.5% · 30yr · 1.5% tax · 5.0% vac · 8.0% maint · 8.0% mgmt
Financing live
Cash to close
- Down payment
- $21,750
- Closing costs
- $2,610
- Reserves months
- —
- Total cash needed
- —
Loan-product check · same deal, 3 products live
Conventional
25% down · 7.5% · 30yr
- Down + closing
- —
- Monthly P&I
- —
- Monthly cashflow
- —
- DSCR
- —
- Eligible?
- —
Personal DTI + credit; lowest rate.
DSCR
20% down · 8.5% · 30yr
- Down + closing
- —
- Monthly P&I
- —
- Monthly cashflow
- —
- DSCR
- —
- Eligible?
- —
No personal income docs; deal must DSCR.
Hard money
10% down · 12.0% · 12mo
- Down + closing
- —
- Monthly P&I
- —
- Monthly cashflow
- —
- DSCR
- —
- Eligible?
- —
Short-term bridge; refi at stabilization.
Rent comps 40 comps
| Address | Beds | Baths | Sqft | Rent | $/sqft | DOM | Units | Dist |
|---|---|---|---|---|---|---|---|---|
| 405 Cory Dr Mission, TX | 2.0 | 1.0 | 832 | $750 | $0.90 | 21d | 1 | 0.04mi |
| 402 Cory Dr Unit B-10 Mission, TX | 2.0 | 1.0 | 714 | $750 | $1.05 | 43d | 1 | 0.05mi |
| 106 S Bryan Rd Unit 13 Mission, TX | 2.0 | 1.0 | 720 | $725 | $1.01 | 43d | 1 | 0.20mi |
| 100 Yosemite Dr Unit 1 Mission, TX | 3.0 | 2.0 | 1195 | $1,375 | $1.15 | 43d | 1 | 0.39mi |
| 103 Yosemite Dr Unit 2 Mission, TX | 3.0 | 2.0 | 1116 | $1,375 | $1.23 | 43d | 1 | 0.42mi |
| 105 San Jose Dr Unit 1 Mission, TX | 3.0 | 2.0 | 1195 | $1,345 | $1.13 | 19d | 1 | 0.45mi |
| 105 San Jose Dr Unit 1 Mission, TX | 3.0 | 2.0 | 1195 | $1,345 | $1.13 | 14d | 1 | 0.45mi |
| 105 San Jose Dr Unit 4 Mission, TX | 3.0 | 2.0 | 1195 | $1,350 | $1.13 | 43d | 1 | 0.45mi |
| 101 San Jose Dr Apt 3 Mission, TX | 3.0 | 2.0 | 1195 | $1,350 | $1.13 | 43d | 1 | 0.48mi |
| 101 San Jose Dr Apt 4 Mission, TX | 3.0 | 2.0 | 1195 | $1,375 | $1.15 | 43d | 1 | 0.48mi |
| 101 San Jose Dr Apt 4 Mission, TX | 3.0 | 2.0 | 1195 | $1,375 | $1.15 | 23d | 1 | 0.48mi |
| 816 Travis St Mission, TX | 1.0–2.0 | 1.0–2.0 | 952 | $1,215 | $1.28 | 43d | 12 | 0.62mi |
| 900 Travis St Mission, TX | 1.0–2.0 | 1.0–2.0 | 1053 | $1,250 | $1.19 | 14d | 1 | 0.68mi |
| 813 Travis St #408 Mission, TX | 3.0 | 2.0 | 1230 | $1,800 | $1.46 | 23d | 1 | 0.68mi |
| 813 Travis St #207 Mission, TX | 3.0 | 2.0 | 1320 | $1,600 | $1.21 | 23d | 1 | 0.68mi |
| 1511 Evergreen Ave Mission, TX | 3.0 | 2.0 | 1286 | $1,300 | $1.01 | 43d | 1 | 0.69mi |
| 523 Perkins Ave Mission, TX | 2.0 | 2.0 | 1050 | $950 | $0.90 | 43d | 1 | 1.10mi |
| 513 San Antonio Ave Apt 8 Mission, TX | 1.0 | 1.5 | 971 | $975 | $1.00 | 43d | 1 | 1.11mi |
| 600 San Antonio Ave Unit 7 Mission, TX | 2.0 | 2.0 | 900 | $880 | $0.98 | 43d | 1 | 1.14mi |
| 1923 Sunset Dr Mission, TX | 3.0 | 2.5 | 1499 | $1,850 | $1.23 | 21d | 1 | 1.16mi |
| 606 San Antonio Ave Unit 1 Mission, TX | 2.0 | 2.0 | 900 | $850 | $0.94 | 23d | 1 | 1.16mi |
| 606 San Antonio Ave Unit 4 Mission, TX | 2.0 | 2.0 | 900 | $895 | $0.99 | 21d | 1 | 1.16mi |
| 606 San Antonio Ave Unit 606-4 Mission, TX | 2.0 | 1.0 | 900 | $850 | $0.94 | 43d | 1 | 1.16mi |
| 2105 Selena St Mission, TX | 3.0 | 2.0 | 1100 | $1,500 | $1.36 | 14d | 1 | 1.18mi |
| 2007 Cassandra St Mission, TX | 3.0 | 2.5 | 1422 | $2,500 | $1.76 | 14d | 1 | 1.23mi |
| 2002 E 1st St Mission, TX | 3.0 | 2.0 | 1017 | $1,300 | $1.28 | 43d | 1 | 1.25mi |
| 104 Sunflower St Unit 5 Mission, TX | 3.0 | 2.0 | 950 | $1,550 | $1.63 | 14d | 1 | 1.31mi |
| 1707 Highland Park Ave Unit 4-B Mission, TX | 2.0 | 2.0 | 1336 | $1,200 | $0.90 | 14d | 1 | 1.33mi |
| 721 W 4th St Mission, TX | 3.0 | 1.5 | 1194 | $1,400 | $1.17 | 14d | 1 | 1.34mi |
| 7102 N 56th Ln Unit 1 Mission, TX | 2.0 | 2.0 | 980 | $1,075 | $1.10 | 21d | 1 | 1.34mi |
| 1006 Fairway Dr Mission, TX | 2.0 | 2.0 | 1072 | $1,100 | $1.03 | 43d | 1 | 1.34mi |
| 2008 Selena St Unit 3 Mission, TX | 3.0 | 2.0 | 1092 | $1,450 | $1.33 | 43d | 1 | 1.35mi |
| 2112 Cassandra St Unit 2 Mission, TX | 3.0 | 2.0 | 1050 | $1,395 | $1.33 | 43d | 1 | 1.38mi |
| 1801 Highland Park Ave Mission, TX | 2.0 | 2.0 | 1173 | $1,500 | $1.28 | 19d | 1 | 1.38mi |
| 1400 N Dunlap Ave Mission, TX | 2.0 | 1.0 | 1068 | $800 | $0.75 | 19d | 1 | 1.41mi |
| 814 Cimarron Dr Mission, TX | 3.0 | 2.5 | 1376 | $1,875 | $1.36 | 14d | 1 | 1.42mi |
| 2004 Angus St Mission, TX | 3.0 | 2.0 | 1150 | $975 | $0.85 | 43d | 1 | 1.43mi |
| 108 N Dove St Unit 3 Mission, TX | 2.0 | 2.0 | 1131 | $1,250 | $1.11 | 23d | 1 | 1.44mi |
| 1827 Highland Park Ave Unit 1 Mission, TX | 2.0 | 2.0 | 1300 | $1,200 | $0.92 | 43d | 1 | 1.46mi |
| 221 W 14th St Mission, TX | 3.0 | 2.0 | 1290 | $1,100 | $0.85 | 43d | 1 | 1.46mi |
HOA detail
- Monthly dues
- $33 · $396/yr
- Likely covers
- landscapingpool
Listing history 15 events
-
2026-06-18days on market $87,000 Active 78 DOM
-
2026-06-17days on market $87,000 Active 77 DOM
-
2026-06-16days on market $87,000 Active 76 DOM
-
2026-06-15days on market $87,000 Active 75 DOM
-
2026-06-14days on market $87,000 Active 73 DOM
-
2026-06-10days on market $87,000 Active 70 DOM
-
2026-06-09days on market $87,000 Active 69 DOM
-
2026-06-08days on market $87,000 Active 68 DOM
-
2026-06-07days on market $87,000 Active 67 DOM
-
2026-06-03days on market $87,000 Active 63 DOM
-
2026-06-02days on market $87,000 Active 62 DOM
-
2026-06-01days on market $87,000 Active 61 DOM
-
2026-05-31days on market $87,000 Active 60 DOM
-
2026-05-31days on market $87,000 Active 59 DOM
-
2026-04-01$89,000 Active 1002-char remark
Show marketing remark (1002 chars)
WOW - Nice 2 bed/2 bath 1986 Palm Harbor Home NOW AVAILABLE in Heritage Square, a 55+ Community in Mission. This FULLY FURNISHED home features recent upgrades like flooring, enclosed Texas Room, plantation shutters, and brand new stove. This split bedroom floor plan features spacious bathrooms in both the primary suite and near the guest bedroom. This home sits on a corner lot with beautiful landscaping and a giant mature tree that blankets your covered front and side patios (YES - 2 Patios) during warm sunny days while you relax with friends and neighbors! OH YEAH - It includes a well maintained 2014 E-Z GO Golf cart to cruise around the community. Heritage Square is an active 55+ community with amenities such as: swimming pool, hot tub, entertainment hall & community kitchen, social clubs, community events... and more. Conveniently located close to medical facilities, shopping, restaurant, and entertainment and only an hour and 1/2 from the beautiful beaches of South Padre Island.
ⓘ Source: listings_history table (triggers on properties + properties_extension) + one-shot
backfill from property_details.listing_events for pre-trigger history.
Climate risk First Street
- Flood 6/10 Major FEMA zone A · 74% chance over 30 yrs
- Wildfire 4/10 Moderate
- Heat 9/10 Extreme 7 d/yr ≥111°F today · 22 d/yr by 30 yrs out
- Wind 8/10 Severe 94% chance of damaging wind over 30 yrs
- Air quality 2/10 Low 1 unhealthy d/yr today · 2 by 30 yrs out
Nearby sold comps map
Loading sold comps map…
Walkable amenities ~0.75 mi
Loading nearby amenities…
Taxation est. · year 1
- Rental income
- $14,222
- − Mortgage interest
- −$4,873
- − Property taxes
- −$1,305
- − Insurance
- −$1,937
- − Repairs & maintenance
- −$1,138
- − Management
- −$1,138
- − HOA
- −$396
- − Depreciation
- −$2,531
- Taxable income
- $904
- Est. tax owed @ 24.0%
- −$217
- After-tax cash flow
- $1,905/yr
For passive investors: Depreciation is non-cash, so a rental often shows a tax loss while cash-flowing — sheltering income. Rental losses are passive: they offset passive income freely, and up to $25,000/yr can offset ordinary (W-2) income if you actively participate and your MAGI is under $100k (phasing out to $0 by $150k); unused losses carry forward. On sale, claimed depreciation is recaptured at up to 25%, and gains may owe capital-gains tax (a 1031 exchange can defer both). Figures are a year-1 estimate at your 24.0% rate — not tax advice; consult a CPA.
Condition & rehab AI · 12 photos
This fully furnished 1986 Palm Harbor home in Heritage Square, a 55+ community, is in good condition with recent upgrades. It offers a spacious floor plan, two patios, and a golf cart included. The home is ready for a new owner to move in and enjoy the community amenities.
Value-add opportunities
- Both Painting the exterior and interior walls — Fresh paint enhances curb appeal and interior aesthetics.
- Resale Updating the kitchen appliances — Modern appliances can attract more buyers.
- Both Replacing the carpet with hardwood or tile — Hardwood or tile flooring can increase both resale and rental value.
- Resale Upgrading the kitchen cabinets — Newer cabinets can make the kitchen more appealing to potential buyers.
- Both Adding a smart thermostat — Smart thermostat can improve energy efficiency and comfort, attracting more buyers and renters.
- Both Landscaping improvements — Landscaping can enhance curb appeal and attract more buyers and renters.
Renovation cost estimate screening
Value-add ROI direction
- Both Painting the exterior and interior walls — Fresh paint enhances curb appeal and interior aesthetics. ↑
- Resale Updating the kitchen appliances — Modern appliances can attract more buyers. ↑
- Both Replacing the carpet with hardwood or tile — Hardwood or tile flooring can increase both resale and rental value. ↑
- Resale Upgrading the kitchen cabinets — Newer cabinets can make the kitchen more appealing to potential buyers. ↑
- Both Adding a smart thermostat — Smart thermostat can improve energy efficiency and comfort, attracting more buyers and renters. ↑
- Both Landscaping improvements — Landscaping can enhance curb appeal and attract more buyers and renters. ↑
ⓘ Cost ranges are severity-bucket heuristics (US national rule-of-thumb). Get contractor quotes + a written scope before underwriting a rehab budget.
Schools (NCES district)
- District
- Mission CISD
- NCES district ID
- 4831040
- Math proficiency
- 15% ▼ -35.00%
- Reading proficiency
- 28% ▼ -15.00%
- Median HH income
- $32,855
- Composite
- 17.47/100
- National rank
- #9061
- State rank
- #775 of 826 in TX
Livability — Mission
- Score
- 75/100
- State rank
- #148
- US rank
- #4155
Category grades
Schools grade is shown separately in the Schools card above.
Census & demographics
- Census place
- Mission, TX
- County
- Hidalgo County · 623,128 people
- City population
- 78,024
- Metro
- McAllen-Edinburg-Mission, TX
- Population (ZIP)
- 78,024
- Household income
- $54,298
- Rent vs Own
- Severe rent burden
- 1714.0
Population outlook (Hidalgo County) Hauer SSP2
- Today (2025)
- 955,232 people
- By 2030
- 1,009,774 · +5.7%
- By 2040
- 1,120,332 · +17.3%
- By 2050
- 1,225,036 · +28.2%
- By 2075
- 1,439,189 · +50.7%
- By 2100
- 1,533,429 · +60.5%
Race, ethnicity, and origin ACS 2023
- Neighborhood character
- Predominantly Hispanic (85%)
- Race & ethnicity
- Hispanic / Latino 85% Two or more races 47% White 12% Asian 2%
- Hispanic origin (detail)
- Mexican 80%
- Common ancestry
- Slovak 1% Portuguese 0%
- Foreign-born
- 28% · Canada, South Korea
- Languages at home
- 22% English-only · Spanish 76%
Political lean MEDSL · Hidalgo
- 2024 margin
- Toss-up / Even · D 48.1% · R 51.0%
- 2008→2024 swing
- -41.6pp toward R · 2008: 38.7pp · 2024: -2.9pp
- All cycles
- 2024: R+2.9 2020: D+17.1 2016: D+40.5 2012: D+41.8 2008: D+38.7
Not yet ingested
- Civics
- —
Market trends
- HPI YoY
- ▼ -62.35%
- Current HPI
- 209.3573
- Rent YoY
- ▲ 0.93%
- Metro
- McAllen-Edinburg-Mission, TX
- State GDP YoY
- ▲ 3.95%
- F500 in state
- 110
Industry mix (Fortune 500 HQ in TX)
| Industry | F500 HQs | Revenue |
|---|---|---|
| Energy | 16 | $1,198B |
|
||
| Technology | 5 | $198B |
|
||
| Engineering / Construction | 4 | $72B |
|
||
| Energy Services | 3 | $60B |
|
||
| Utilities | 3 | $41B |
|
||
| Healthcare | 2 | $330B |
|
||
Price history
1 event — show timeline
- 2026-04-01 Listed $89,000 MCALLENMLS
Cash-flow waterfall
monthlySold comps — $/sqft
last 12 mo · ≤1 miLoading sold comps…