29433 E San Jose Ave · Wellton, AZ
Flood risk 1/10 · Minimal
- FEMA flood zone
- X (unshaded)
- Chance of flooding over 30 yrs
- 0.0%
- Est. flood insurance / yr
- $507 – $1,088
Fire risk 4/10 · Minor
- Est. fire insurance / yr
- $610 – $1,132
Heat risk 10/10 · Severe
- Hot days now (above 113°F)
- 7 days/yr
- Hot days in 30 yrs
- 20 days/yr
Wind risk 1/10 · Minimal
- Chance of severe wind over 30 yrs
- —
Air-quality risk 1/10 · Minimal
- Unhealthy air days now
- 0 days/yr
- Unhealthy air days in 30 yrs
- 0 days/yr
Risk factors via First Street. Map © Google.
Why this score? — see what drove the D grade
The composite is a weighted blend of 9 inputs, each scored 0–100. Each bar is that input's sub-score; the figure is the points it added to the 100-point composite (weight × sub-score).
- Cash flow +12.3/30.0
- ARV discount +10.6/15.0
- Appreciation +5.4/10.0
- DSCR +3.7/10.0
- Livability +3.5/5.0
- Rent growth +2.5/5.0
- Condition / age +2.5/5.0
- 1% rule +2.2/10.0
- Schools +2.0/10.0
$145,000
🖨 Deal sheet (PDF) 📄 Offer letter ✓ Due diligence
Listing remarks
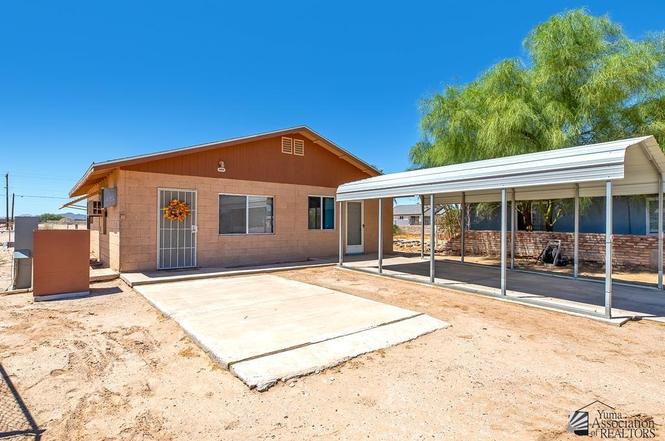
Fully Furnished 2-Bedroom Home in Wellton with Shop & RV Access Discover the potential in this 2-bedroom, 1-bath home— fully furnished and turn-key! Recent updates include a roof replacement (2024), new air conditioning wall unit with heating element, fresh exterior paint, upgraded electrical pedestal with RV access and electric in back building upgraded to code. Enjoy the convenience of covered parking under the spacious carport and take advantage of the detached workshop, complete with air conditioning—ideal for hobbies, storage, or creative projects. Whether you're starting out, downsizing, or looking for a ready-to-go rental, this home is move-in ready and full of oppo
Key facts
- Covered parking
- Rv access
- Detached workshop
Tags
Property features AI
Exterior
- Parking: 1 covered parking space; Detached carport (1 car); RV access/parking
- Utilities: Public water; Septic sewer
- Home design: Single-family residence; Residential property
- Exterior features: Patio; RV hookup; Paved road frontage
Interior
- Kitchen: Refrigerator; Microwave; Electric range
- Flooring: Tile; Carpet; Other
- Bathrooms: 1 full bathroom
- Heating & cooling: Heating present; Cooling present
- Interior features: Window coverings (blinds and drapes); Workshop and storage shed(s)
- Laundry & utility: Washer; Dryer
Neighborhood map
What this means for you Summary
Snapshot
- This is a 1-bed/1.0-bath single-family listed at $145k.
Deal economics
- At list price, monthly cash flow is $-26 ($-312/yr) — negative.
- To cash-flow at today's rent, offer at most $140k (3.2% below list).
- To meet the 1% rule (rent ≥ 1% of price), the offer needs to be $105k (27.6% below list).
- Recommended offer: $105k (27.6% below list) — sets the bar for 1% rule.
- Cap rate 6.1% vs local median 3.7% in Wellton — top-decile yield for the area; either an underpriced asset or a hidden risk that comps aren't pricing in. Stress-test before assuming the spread holds.
Location & tenants
- Location reads 69/100 on livability (#47 in AZ) — a middle-class / working-renter tenant base. Strengths: crime A+, cost of living A+, housing A+; Watch: employment C-, amenities F, commute F.
- Wellton Elementary District (4504) (rural): math 15% / reading 25% proficiency, ranked #367 of 501 in AZ (top 73%) — low school quality limits family demand, transient renter base, plan for 1-2y turnover; 66% free/reduced lunch — lower-income household profile, screen leases tightly.
- Zoned schools: Wellton Elementary School (math 17% / reading 27%, grade F, #687 of 1,109 statewide, top 65%, 156 students, 78% FRL); Antelope Union High School (math 5% / reading 15%, grade F, #298 of 381 statewide, top 90%, 199 students, 64% FRL) — zoned schools at 71% FRL track the district average.
- Market conditions: 116 active listings in the ZIP; 1,399 units permitted in Yuma County in 2024 (180 in 5+ unit buildings).
Forward outlook
- In year one you build about $2k of equity ($1k loan paydown + $1k appreciation (0.7% local appreciation)).
- Yuma County population projected at +4% by 2050 — modest demand growth; plan on rents tracking national, not racing it.
Negotiation context
- It's been on market 328 days — a 12% lower offer ($128k) is reasonable based on typical stale-listing flexibility.
Risks & watch-outs
- Climate carrying-cost: extreme-heat days projected 7→20/yr by 2055 (HVAC capex compounding) — expect insurance premiums to compound above CPI over the hold.
Questions for the listing agent
- What do current leases actually rent for vs. the listed asking? Can we see a recent rent roll and the last 12 months of T-12 income?
- It's been on market 328 days. Have you received any prior offers? Is the seller open to a 28% concession, seller financing, or rate buy-down credit?
- Why hasn't it sold? Are there any deal-killer items the seller is aware of (foundation, flood, title, zoning, code violations)?
- Is there a deadline driving the sale (1031 exchange, divorce, estate, relocation)? That informs how much negotiation room exists.
- Schools are F-rated, which usually means shorter tenancies and higher turnover. Who's the typical renter profile here, and what's been the actual vacancy rate?
- The area grade is low — what's the realistic commute time and amenity access for the typical tenant pool here? Any planned neighborhood developments (good or bad) we should know about?
- What's the average days-on-market for RENTAL listings here right now (not sales)? A rising rental-DOM trend means longer vacancies and softer asking-rent achievability than the comps imply.
- What's the recent tenant-quality profile in this submarket — average credit score on applications, eviction rate, late-payment / NSF rate, and stable-employment percentage? A property-management company in the area should have these aggregated.
- How much new for-sale + rental construction is in the pipeline within 1–3 miles? Heavy new supply typically softens prices + rents 12–24 months out; constrained supply supports both.
Investment metrics
- 1% rule
- 0.72% ✗
- Cap rate
- 6.08%
- Cash-on-cash
- -0.77%
- DSCR
- 0.97
- GRM
- 11.5
CMA / ARV
- ARV (on-the-fly)
- $155,750
- Comps found
- 3
Show comp detail 3 sales within ~0.75 mi
| Address | Dist | Beds/Ba | Sqft | Sold | Price | $/sf | Match |
|---|---|---|---|---|---|---|---|
| 29217 E Napa Ave | 0.37mi | 2/— (+1) | 909 (+2%) | 2mo | $149,000 | $164 | 72 |
| 10325 S Linda Ln | 0.72mi | 1/2.0 | 848 (-5%) | 11mo | $148,000 | $175 | 46 |
| 10447 Sidewinder Unit 29802 COPPER MOUNTAIN DR | 0.47mi | 1/1.0 | 768 (-14%) | 24mo | $190,000 | $247 | 35 |
Match score weights: distance 35% · size 25% · config 20% · recency 20%. Top-matched comps best support the ARV.
Projected returns pro-forma
0.71% appreciation · 3.0% rent growth · sell at horizon
- IRR
- -0.5%
- Equity multiple
- 0.97×
- Total profit
- $-1,057
- Equity at exit
- $47,334
- IRR
- 4.5%
- Equity multiple
- 1.53×
- Total profit
- $21,395
- Equity at exit
- $61,261
Cash invested: $40,600 (down + closing). Projections, not guarantees.
Landlord ↔ Tenant lean methodology
- Overall (STATE)
- 87 Strongly Landlord-Friendly
- State Arizona
- 87 Strongly Landlord-Friendly · R+3
- County
- — inherits STATE
- City
- — inherits STATE
ZIP-level market 85356
- Home prices YoY
- 0.3%
- Active inventory
- 116
- Price-to-rent
- 11.5×
Monthly cashflow live
- Estimated rent
- $1,050 medium interval (Pro) →
- Mortgage (P&I)
- −$760
- Tax from tax record
- −$35 /mo · $416/yr
- Insurance
- −$60
- HOA
- −$0
- Vacancy / Maint / Mgmt
- −$220
- Net cashflow
- $-26
Break-even live
Sensitivity live
| Price | -10% $56 | -5% $15 | +0% $-26 | +5% $-67 | +10% $-108 |
|---|---|---|---|---|---|
| Rent | -10% $-109 | -5% $-68 | +0% $-26 | +5% $15 | +10% $57 |
| Rate | -1.0pp $47 | -0.5pp $11 | base $-26 | +0.5pp $-64 | +1.0pp $-102 |
UW: 25.0% down · 7.5% · 30yr · 1.5% tax · 5.0% vac · 8.0% maint · 8.0% mgmt
Financing live
Cash to close
- Down payment
- $36,250
- Closing costs
- $4,350
- Reserves months
- —
- Total cash needed
- —
Loan-product check · same deal, 3 products live
Conventional
25% down · 7.5% · 30yr
- Down + closing
- —
- Monthly P&I
- —
- Monthly cashflow
- —
- DSCR
- —
- Eligible?
- —
Personal DTI + credit; lowest rate.
DSCR
20% down · 8.5% · 30yr
- Down + closing
- —
- Monthly P&I
- —
- Monthly cashflow
- —
- DSCR
- —
- Eligible?
- —
No personal income docs; deal must DSCR.
Hard money
10% down · 12.0% · 12mo
- Down + closing
- —
- Monthly P&I
- —
- Monthly cashflow
- —
- DSCR
- —
- Eligible?
- —
Short-term bridge; refi at stabilization.
Listing history 19 events
-
2026-06-22remarks 683-char remark
-
2026-06-22pricedays on market $145,000 Active 328 DOM
-
2026-06-19days on market $150,000 Active 326 DOM
-
2026-06-18days on market $150,000 Active 325 DOM
-
2026-06-17days on market $150,000 Active 324 DOM
-
2026-06-16days on market $150,000 Active 323 DOM
-
2026-06-15days on market $150,000 Active 322 DOM
-
2026-06-14days on market $150,000 Active 320 DOM
-
2026-06-13days on market $150,000 Active 319 DOM
-
2026-06-10days on market $150,000 Active 317 DOM
-
2026-06-09days on market $150,000 Active 316 DOM
-
2026-06-08days on market $150,000 Active 315 DOM
-
2026-06-07days on market $150,000 Active 314 DOM
-
2026-06-05days on market $150,000 Active 311 DOM
-
2026-06-02days on market $150,000 Active 309 DOM
-
2026-06-01days on market $150,000 Active 308 DOM
-
2026-05-31days on market $150,000 Active 307 DOM
-
2026-05-30days on market $150,000 Active 306 DOM
-
2025-07-28$150,000 Active
ⓘ Source: listings_history table (triggers on properties + properties_extension) + one-shot
backfill from property_details.listing_events for pre-trigger history.
Tax reassessment forecast AZ · Resets to sale price
- Current annual tax
- $416 · $35/mo
- Projected year-2 tax
- $957 · $80/mo
- Expected delta
- +$541/yr (+$45/mo · 130.0%)
ⓘ Screening estimate from a state-policy table — verify with the county assessor before closing.
Climate risk First Street
- Flood 1/10 Low FEMA zone X (unshaded) · 0% chance over 30 yrs
- Wildfire 4/10 Moderate
- Heat 10/10 Extreme 7 d/yr ≥113°F today · 20 d/yr by 30 yrs out
- Wind 1/10 Low
- Air quality 1/10 Low 0 unhealthy d/yr today · 0 by 30 yrs out
Nearby sold comps map
Loading sold comps map…
Walkable amenities ~0.75 mi
Loading nearby amenities…
Taxation est. · year 1
- Rental income
- $12,599
- − Mortgage interest
- −$8,122
- − Property taxes
- −$416
- − Insurance
- −$725
- − Repairs & maintenance
- −$1,008
- − Management
- −$1,008
- − Depreciation
- −$4,218
- Taxable loss
- −$2,898
- Est. tax savings @ 24.0%
- +$696
- After-tax cash flow
- $383/yr
For passive investors: Depreciation is non-cash, so a rental often shows a tax loss while cash-flowing — sheltering income. Rental losses are passive: they offset passive income freely, and up to $25,000/yr can offset ordinary (W-2) income if you actively participate and your MAGI is under $100k (phasing out to $0 by $150k); unused losses carry forward. On sale, claimed depreciation is recaptured at up to 25%, and gains may owe capital-gains tax (a 1031 exchange can defer both). Figures are a year-1 estimate at your 24.0% rate — not tax advice; consult a CPA.
Schools (NCES district)
- District
- Wellton Elementary District (4504)
- NCES district ID
- 0409090
- Math proficiency
- 15% ▼ -10.00%
- Reading proficiency
- 25% ▬ 0.00%
- Median HH income
- $41,258
- Composite
- 20.3/100
- National rank
- #13817
- State rank
- #367 of 501 in AZ
Livability — Wellton
- Score
- 69/100
- State rank
- #47
- US rank
- #8902
Category grades
Schools grade is shown separately in the Schools card above.
Census & demographics
- Census place
- Wellton, AZ
- Population (ZIP)
- 3,789
Population outlook (Yuma County) Hauer SSP2
- Today (2025)
- 211,633 people
- By 2030
- 214,114 · +1.2%
- By 2040
- 217,856 · +2.9%
- By 2050
- 220,276 · +4.1%
- By 2075
- 222,359 · +5.1%
- By 2100
- 198,880 · -6.0%
Race, ethnicity, and origin ACS 2023
- Neighborhood character
- Predominantly White (72%)
- Race & ethnicity
- White 72% Hispanic / Latino 22% Two or more races 14%
- Hispanic origin (detail)
- Mexican 21%
- Common ancestry
- German 3% Portuguese 2% Italian 1%
- Foreign-born
- 19% · Canada
- Languages at home
- 78% English-only · Spanish 20% French/Haitian/Cajun 2% German/W. Germanic 1%
Political lean MEDSL · Yuma
- 2024 margin
- Strong R (+20.4) · D 39.3% · R 59.8%
- 2008→2024 swing
- -6.6pp toward R · 2008: -13.8pp · 2024: -20.4pp
- All cycles
- 2024: R+20.4 2020: R+6.2 2016: R+5.5 2012: R+16.1 2008: R+13.8
Not yet ingested
- Civics
- —
Market trends
- HPI YoY
- ▲ 0.71%
- Current HPI
- 235.7713
- Rent YoY
- —
- Metro
- —
- State GDP YoY
- ▲ 4.54%
- F500 in state
- 20
Industry mix (Fortune 500 HQ in AZ)
| Industry | F500 HQs | Revenue |
|---|---|---|
| Technology | 2 | $13B |
|
||
| Mining / Metals | 1 | $23B |
|
||
| Environmental Services | 1 | $16B |
|
||
| Metals / Steel | 1 | $14B |
|
||
| Technology Distribution | 1 | $9B |
|
||
| Homebuilding | 1 | $8B |
|
||
Price history
1 event — show timeline
- 2025-07-28 Listed $150,000 YAR
Property tax history
+0.1%/yrLatest (2025): $416 · +8.8% YoY. Source: county tax records.
Cash-flow waterfall
monthlySold comps — $/sqft
last 12 mo · ≤1 miLoading sold comps…