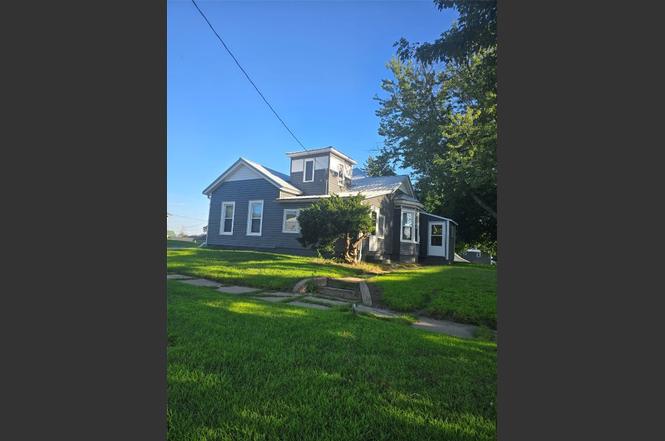
406 Broadway St · Oxford Junction, IA
Flood risk 1/10 · Minimal
- FEMA flood zone
- X (unshaded)
- Chance of flooding over 30 yrs
- 0.0%
- Est. flood insurance / yr
- $473 – $860
Fire risk 3/10 · Minor
- Est. fire insurance / yr
- $902 – $1,676
Heat risk 3/10 · Minor
- Hot days now (above 103°F)
- 7 days/yr
- Hot days in 30 yrs
- 15 days/yr
Wind risk 2/10 · Minimal
- Chance of severe wind over 30 yrs
- —
Air-quality risk 2/10 · Minimal
- Unhealthy air days now
- 2 days/yr
- Unhealthy air days in 30 yrs
- 2 days/yr
Risk factors via First Street. Map © Google.
Why this score? — see what drove the C- grade
The composite is a weighted blend of 9 inputs, each scored 0–100. Each bar is that input's sub-score; the figure is the points it added to the 100-point composite (weight × sub-score).
- Cash flow +17.3/30.0
- Appreciation +7.0/10.0
- DSCR +5.4/10.0
- Schools +5.2/10.0
- 1% rule +4.7/10.0
- Livability +3.1/5.0
- ARV discount +2.8/15.0
- Rent growth +2.5/5.0
- Condition / age +2.5/5.0
$109,000
🖨 Deal sheet 📄 Offer letter ✓ Due diligence
Listing remarks
Charming 2 bed- 1 bath turn of the century home. Old charm with new updates! Plus, a 2-stall garage with a great yard ready for a garden or your dog. Small town affordable living in a quiet neighborhood. Centrally located between Cedar Rapids, Dubuque and the Quad Cities. Come check this place out.
Key facts
- 2-stall garage
- Centrally located
- Quiet neighborhood
Tags
Property features AI
Exterior
- Parking: 2-car garage
- Utilities: Public water; Public sewer
- Home design: Single-family residence; One and one-half level; 1 story total; Frame construction with vinyl siding
- Construction: Frame and vinyl siding construction
- Exterior features: 0.27-acre lot (approx. 99 x 120)
Interior
- Kitchen: Refrigerator included
- Bathrooms: 2 full bathrooms
- Heating & cooling: Natural gas heating
- Interior features: Eat-in kitchen; Partial basement
Neighborhood map
What this means for you Summary
Snapshot
- This is a 2-bed/2.0-bath single-family listed at $109k.
Deal economics
- At list price, monthly cash flow is $79 ($949/yr) — positive.
- The deal already cash-flows at list — no discount required.
- To meet the 1% rule (rent ≥ 1% of price), the offer needs to be $105k (3.3% below list).
- Recommended offer: $96k (12.0% below list) — sets the bar for market timing.
Location & tenants
- Location reads 61/100 on livability (#798 in IA) — a middle-class / working-renter tenant base. Strengths: cost of living A+, housing A-; Watch: crime C-, amenities F, commute F.
- Midland Community School District (rural): math 57% / reading 66% proficiency, ranked #231 of 289 in IA (top 80%) — acceptable for families but not a draw, mixed tenant base, ~2y average lease.
- Zoned schools: Midland Elementary (math 62% / reading 62%, grade B, #363 of 616 statewide, top 62%, 205 students, 51% FRL); Midland Middle/High School (math 56% / reading 67%, grade B-, #255 of 336 statewide, top 76%, 303 students, 52% FRL).
- Market conditions: 5 active listings in the ZIP; 25 units permitted in Jones County in 2024 (0 in 5+ unit buildings).
Forward outlook
- In year one you build about $5k of equity ($754 loan paydown + $4k appreciation (4.0% local appreciation)).
- Jones County population projected to shrink 8% by 2050 — rents likely to lag national; underwrite the cash flow, not the appreciation.
- At projected returns (4.0% appreciation + 3.0% rent growth), your $31k cash investment doubles in ~5 years — after that, you're playing with house money.
- By year 7, paydown + projected appreciation supports a ~$32k cash-out refi (75% LTV) — recoverable capital for the next deal without selling this one.
Negotiation context
- It's been on market 224 days — a 12% lower offer ($96k) is reasonable based on typical stale-listing flexibility.
- 3 sale attempts; this cycle's ask has dropped $10k (8%) from the opening price — seller is motivated, your offer sets the floor, not the list.
Risks & watch-outs
- Watch-outs: built in 1900 — expect roof / HVAC / electrical / plumbing capex.
Questions for the listing agent
- It's been on market 224 days. Have you received any prior offers? Is the seller open to a 12% concession, seller financing, or rate buy-down credit?
- Built in 1900 — when were the roof, HVAC, electrical panel, plumbing, and water heater last replaced?
- Why hasn't it sold? Are there any deal-killer items the seller is aware of (foundation, flood, title, zoning, code violations)?
- Is there a deadline driving the sale (1031 exchange, divorce, estate, relocation)? That informs how much negotiation room exists.
- Schools are B-rated — typically a magnet for longer-tenancy family renters. What's the average tenant stay here, and is there a school-zone premium baked into asking?
- What's the average days-on-market for RENTAL listings here right now (not sales)? A rising rental-DOM trend means longer vacancies and softer asking-rent achievability than the comps imply.
- What's the recent tenant-quality profile in this submarket — average credit score on applications, eviction rate, late-payment / NSF rate, and stable-employment percentage? A property-management company in the area should have these aggregated.
- How much new for-sale + rental construction is in the pipeline within 1–3 miles? Heavy new supply typically softens prices + rents 12–24 months out; constrained supply supports both.
Investment metrics
- 1% rule
- 0.97% ✗
- Cap rate
- 7.16%
- Cash-on-cash
- 3.11%
- DSCR
- 1.14
- GRM
- 8.6
CMA / ARV
- ARV (on-the-fly)
- $98,640
- Comps found
- 1
Show comp detail 1 sale within ~0.75 mi
| Address | Dist | Beds/Ba | Sqft | Sold | Price | $/sf | Match |
|---|---|---|---|---|---|---|---|
| 217 Broadway St | 0.11mi | 2/1.5 | 1,058 (-14%) | 12mo | $85,000 | $80 | 59 |
Match score weights: distance 35% · size 25% · config 20% · recency 20%. Top-matched comps best support the ARV.
Projected returns pro-forma
3.99% appreciation · 3.0% rent growth · sell at horizon
- IRR
- 13.0%
- Equity multiple
- 1.79×
- Total profit
- $23,978
- Equity at exit
- $55,176
- IRR
- 14.4%
- Equity multiple
- 3.34×
- Total profit
- $71,473
- Equity at exit
- $90,175
Cash invested: $30,520 (down + closing). Projections, not guarantees.
Landlord ↔ Tenant lean methodology
- Overall (STATE)
- 83 Strongly Landlord-Friendly
- State Iowa
- 83 Strongly Landlord-Friendly · R+6
- County
- — inherits STATE
- City
- — inherits STATE
ZIP-level market 52323
- Home prices YoY
- 2.9%
- Active inventory
- 5
- Price-to-rent
- 8.6×
Monthly cashflow live
- Estimated rent
- $1,054 medium interval (Pro) →
- Mortgage (P&I)
- −$572
- Tax est. 1.5%
- −$136 /mo · $1,635/yr
- Insurance
- −$45
- HOA
- −$0
- Vacancy / Maint / Mgmt
- −$221
- Net cashflow
- $79
Break-even live
UW: 25.0% down · 7.5% · 30yr · 1.5% tax · 5.0% vac · 8.0% maint · 8.0% mgmt
Financing live
Cash to close
- Down payment
- $27,250
- Closing costs
- $3,270
- Reserves months
- —
- Total cash needed
- —
Loan-product check · same deal, 3 products live
Conventional
25% down · 7.5% · 30yr
- Down + closing
- —
- Monthly P&I
- —
- Monthly cashflow
- —
- DSCR
- —
- Eligible?
- —
Personal DTI + credit; lowest rate.
DSCR
20% down · 8.5% · 30yr
- Down + closing
- —
- Monthly P&I
- —
- Monthly cashflow
- —
- DSCR
- —
- Eligible?
- —
No personal income docs; deal must DSCR.
Hard money
10% down · 12.0% · 12mo
- Down + closing
- —
- Monthly P&I
- —
- Monthly cashflow
- —
- DSCR
- —
- Eligible?
- —
Short-term bridge; refi at stabilization.
Listing history 12 events
-
2026-05-15status Pending
-
2026-05-07status Active
-
2026-04-09status Pending
-
2026-01-05status Active
-
2025-12-29historical
-
2025-10-19price $109,000
-
2025-09-26price $115,000
-
2025-08-29$119,000 Active
-
2025-08-17price $119,000
-
2025-08-14price $119,000
-
2025-07-07price $129,500
-
2025-07-01price $129,500
ⓘ Source: listings_history table (triggers on properties + properties_extension) + one-shot
backfill from property_details.listing_events for pre-trigger history.
Climate risk First Street
- Flood 1/10 Low FEMA zone X (unshaded) · 0% chance over 30 yrs
- Wildfire 3/10 Moderate
- Heat 3/10 Moderate 7 d/yr ≥103°F today · 15 d/yr by 30 yrs out
- Wind 2/10 Low
- Air quality 2/10 Low 2 unhealthy d/yr today · 2 by 30 yrs out
Nearby sold comps map
Loading sold comps map…
Walkable amenities ~0.75 mi
Loading nearby amenities…
Taxation est. · year 1
- Rental income
- $12,643
- − Mortgage interest
- −$6,106
- − Property taxes
- −$1,635
- − Insurance
- −$545
- − Repairs & maintenance
- −$1,011
- − Management
- −$1,011
- − Depreciation
- −$3,171
- Taxable loss
- −$836
- Est. tax savings @ 24.0%
- +$201
- After-tax cash flow
- $1,150/yr
For passive investors: Depreciation is non-cash, so a rental often shows a tax loss while cash-flowing — sheltering income. Rental losses are passive: they offset passive income freely, and up to $25,000/yr can offset ordinary (W-2) income if you actively participate and your MAGI is under $100k (phasing out to $0 by $150k); unused losses carry forward. On sale, claimed depreciation is recaptured at up to 25%, and gains may owe capital-gains tax (a 1031 exchange can defer both). Figures are a year-1 estimate at your 24.0% rate — not tax advice; consult a CPA.
Schools (NCES district)
- District
- Midland Community School District
- NCES district ID
- 1919200
- Math proficiency
- 57% ▼ -8.00%
- Reading proficiency
- 66% ▼ -5.00%
- Median HH income
- $48,981
- Composite
- 52.19/100
- National rank
- #1607
- State rank
- #231 of 289 in IA
Livability — Oxford Junction
- Score
- 61/100
- State rank
- #798
- US rank
- #18173
Category grades
Schools grade is shown separately in the Schools card above.
Census & demographics
- Census place
- Oxford Junction, IA
- City population
- 879
- Population (ZIP)
- 879
Population outlook (Jones County) Hauer SSP2
- Today (2025)
- 20,023 people
- By 2030
- 19,702 · -1.6%
- By 2040
- 19,007 · -5.1%
- By 2050
- 18,396 · -8.1%
- By 2075
- 17,955 · -10.3%
- By 2100
- 17,448 · -12.9%
Race, ethnicity, and origin ACS 2023
- Neighborhood character
- Predominantly White (98%)
- Race & ethnicity
- White 98% Two or more races 2% Hispanic / Latino 1%
- Common ancestry
- Italian 1%
Political lean MEDSL · Jones
- 2024 margin
- Strong R (+26.3) · D 36.0% · R 62.3% · Other 1.7%
- 2008→2024 swing
- -36.7pp toward R · 2008: 10.4pp · 2024: -26.3pp
- All cycles
- 2024: R+26.3 2020: R+21.5 2016: R+19.4 2012: D+7.7 2008: D+10.4
Not yet ingested
- Civics
- —
Market trends
- HPI YoY
- ▲ 3.99%
- Current HPI
- 139.6963
- Rent YoY
- —
- Metro
- —
- State GDP YoY
- ▲ 2.48%
- F500 in state
- 4
Industry mix (Fortune 500 HQ in IA)
| Industry | F500 HQs | Revenue |
|---|---|---|
| Financial Services | 1 | $16B |
|
||
| Retail / Convenience | 1 | $15B |
|
||
Price history
-15.8% since first listed12 events — show timeline
- 2026-05-15 Pending — CRAAR, CDRMLS
- 2026-05-07 Relisted — CRAAR, CDRMLS
- 2026-04-09 Pending — CRAAR, CDRMLS
- 2026-01-05 Relisted — CRAAR, CDRMLS
- 2025-12-29 Delisted — CRAAR, CDRMLS
- 2025-10-19 Price Changed $109,000 CRAAR, CDRMLS
- 2025-09-26 Price Changed $115,000 CRAAR, CDRMLS
- 2025-08-29 Listed $119,000 CRAAR, CDRMLS
- 2025-08-17 Price Changed $119,000 NEIRBR as distributed by MLS GRID
- 2025-08-14 Price Changed $119,000 CRAAR, CDRMLS
- 2025-07-07 Price Changed $129,500 NEIRBR as distributed by MLS GRID
- 2025-07-01 Price Changed $129,500 CRAAR, CDRMLS
Cash-flow waterfall
monthlySold comps — $/sqft
last 12 mo · ≤1 miLoading sold comps…