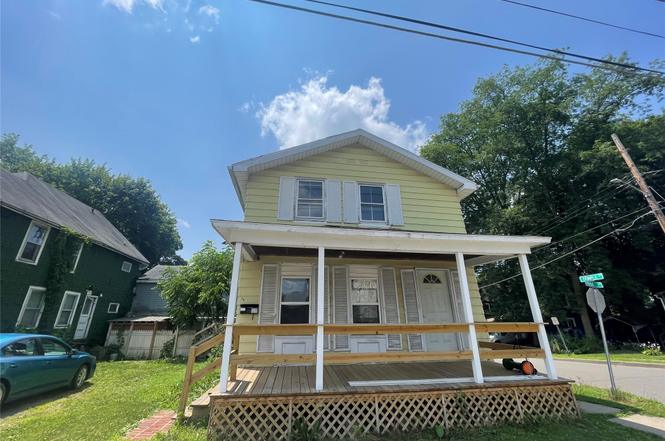
75 Paige St St · Owego, NY
Flood risk 3/10 · Minor
- FEMA flood zone
- X (unshaded)
- Chance of flooding over 30 yrs
- 0.09%
- Est. flood insurance / yr
- $473 – $860
Fire risk 1/10 · Minimal
- Est. fire insurance / yr
- $691 – $1,283
Heat risk 3/10 · Minor
- Hot days now (above 94°F)
- 8 days/yr
- Hot days in 30 yrs
- 17 days/yr
Wind risk 2/10 · Minimal
- Chance of severe wind over 30 yrs
- 1.0%
Air-quality risk 2/10 · Minimal
- Unhealthy air days now
- 0 days/yr
- Unhealthy air days in 30 yrs
- 1 days/yr
Risk factors via First Street. Map © Google.
Why this score? — see what drove the A grade
The composite is a weighted blend of 9 inputs, each scored 0–100. Each bar is that input's sub-score; the figure is the points it added to the 100-point composite (weight × sub-score).
- Cash flow +30.0/30.0
- ARV discount +15.0/15.0
- DSCR +10.0/10.0
- Appreciation +9.1/10.0
- 1% rule +8.5/10.0
- Schools +5.3/10.0
- Livability +3.8/5.0
- Rent growth +2.5/5.0
- Condition / age +2.5/5.0
$99,000
🖨 Deal sheet (PDF) 📄 Offer letter ✓ Due diligence
Listing remarks MLS
Why RENT when you can OWN your own home?! This 3 bedroom, 1.5 bath home offers affordable living with it's lower taxes and could be a fantastic investment opportunity to add to your portfolio. Mere minutes away from Downtown Owego, this home includes a newer Furnace/Water Heater (Oct 2023), new front porch (2024) and off-street parking.
Key facts
- Half bath
- Newer furnace
- Front porch
Tags
Property features AI
Finance
- Other: Property listed by EXIT REALTY HOMEWARD BOUND
Exterior
- Parking: No on-site parking listed
- Utilities: Public water; Public sewer
- Home design: Single-family residence; Two levels
- Construction: Aluminum siding
- Exterior features: Covered porch; Level lot
Interior
- Kitchen: Range; Free-standing range; Refrigerator
- Bedrooms: Total of 8 rooms (bedroom count not specified)
- Flooring: Carpet; Vinyl
- Bathrooms: 1 full bathroom; 1 half bathroom
- Heating & cooling: Forced air heating; Wall/window air conditioning units
- Interior features: Range; Free-standing range; Gas water heater; Refrigerator
- Laundry & utility: Gas water heater
Neighborhood map
What this means for you Summary
Snapshot
- This is a 2-bed/1.5-bath single-family listed at $99k.
Deal economics
- At list price, monthly cash flow is $437 ($5k/yr) — positive.
- The deal already cash-flows at list — no discount required.
- Meets the 1% rule at list price ($1k rent vs $99k).
- Cap rate 11.6% vs local median 5.3% in Owego — top-decile yield for the area; either an underpriced asset or a hidden risk that comps aren't pricing in. Stress-test before assuming the spread holds.
Location & tenants
- Location reads 76/100 on livability (#214 in NY, #3,289 nationally) — a middle-class / working-renter tenant base. Strengths: cost of living A+, housing A+, health & safety A+; Watch: employment D+, commute F.
- Owego-Apalachin Central School District (town): math 62% / reading 62% proficiency, ranked #204 of 590 in NY (top 35%) — acceptable for families but not a draw, mixed tenant base, ~2y average lease.
- Zoned schools: Owego Elementary School (math 72% / reading 67%, grade A-, #447 of 2,108 statewide, top 24%, 486 students, 53% FRL); Owego-Apalachin Middle School (math 36% / reading 57%, grade D+, #330 of 729 statewide, top 46%, 443 students, 45% FRL); Owego Free Academy (math 98% / reading 75%, grade A, #342 of 1,100 statewide, top 31%, 606 students, 41% FRL).
- Market conditions: 65 active listings in the ZIP; 2 comparable units currently listed for rent nearby; 139 units permitted in Tioga County in 2024 (65 in 5+ unit buildings).
Forward outlook
- In year one you build about $9k of equity ($684 loan paydown + $8k appreciation (8.1% local appreciation)).
- Tioga County population projected at -27% by 2050 — secular population decline; favor cash flow + early exit over multi-decade hold.
- At projected returns (8.1% appreciation + 3.0% rent growth), your $28k cash investment doubles in ~2 years — after that, you're playing with house money.
- By year 4, paydown + projected appreciation supports a ~$30k cash-out refi (75% LTV) — recoverable capital for the next deal without selling this one.
Negotiation context
- Only 4 days on market — expect competitive offers; lowballing is unlikely to land.
- 6 sale attempts since 24y ago with the ask held roughly flat each time — persistent listings suggest the price (not the market) is what's stuck; bring a comps-based counter.
- Current owner paid $78k; 27% above their basis — modest negotiation headroom, anchor on the comps not their cost.
Risks & watch-outs
- Watch-outs: built in 1920 — expect roof / HVAC / electrical / plumbing capex.
Questions for the listing agent
- Built in 1920 — when were the roof, HVAC, electrical panel, plumbing, and water heater last replaced?
- Is there a deadline driving the sale (1031 exchange, divorce, estate, relocation)? That informs how much negotiation room exists.
- What's the average days-on-market for RENTAL listings here right now (not sales)? A rising rental-DOM trend means longer vacancies and softer asking-rent achievability than the comps imply.
- What's the recent tenant-quality profile in this submarket — average credit score on applications, eviction rate, late-payment / NSF rate, and stable-employment percentage? A property-management company in the area should have these aggregated.
- How much new for-sale + rental construction is in the pipeline within 1–3 miles? Heavy new supply typically softens prices + rents 12–24 months out; constrained supply supports both.
Investment metrics
- 1% rule
- 1.35% ✓
- Cap rate
- 11.58%
- Cash-on-cash
- 18.90%
- DSCR
- 1.84
- GRM
- 6.2
CMA / ARV
- ARV (on-the-fly)
- $137,088
- Comps found
- 10
Show comp detail 10 sales within ~0.75 mi
| Address | Dist | Beds/Ba | Sqft | Sold | Price | $/sf | Match |
|---|---|---|---|---|---|---|---|
| 75 Paige St | 0.00mi | 3/1.5 (+1) | 1,344 (0%) | 14mo | $78,000 | $58 | 84 |
| 113 Spencer Ave Ave | 0.13mi | 3/1.5 (+1) | 1,264 (-6%) | 4mo | $93,500 | $74 | 76 |
| 4 West Ave | 0.40mi | 3/1.0 (+1) | 1,368 (+2%) | 4mo | $75,000 | $55 | 68 |
| 249 Erie St | 0.30mi | 3/1.5 (+1) | 1,416 (+5%) | 7mo | $145,000 | $102 | 66 |
| 105 Chestnut St | 0.17mi | 3/1.0 (+1) | 1,488 (+11%) | 12mo | $80,000 | $54 | 58 |
| 55 William St | 0.72mi | 2/1.0 | 1,256 (-6%) | 2mo | $164,500 | $131 | 52 |
| 14 Orchard Ave | 0.67mi | 3/1.5 (+1) | 1,400 (+4%) | 9mo | $222,000 | $159 | 49 |
| 10 John St | 0.36mi | 3/1.5 (+1) | 1,486 (+11%) | 14mo | $168,000 | $113 | 49 |
| 95 West Ave | 0.67mi | 3/1.0 (+1) | 1,366 (+2%) | 17mo | $99,000 | $72 | 45 |
| 527 E Main St | 0.67mi | 2/1.5 | 1,469 (+9%) | 11mo | $175,000 | $119 | 44 |
Match score weights: distance 35% · size 25% · config 20% · recency 20%. Top-matched comps best support the ARV.
Projected returns pro-forma
8.11% appreciation · 3.0% rent growth · sell at horizon
- IRR
- 35.0%
- Equity multiple
- 3.50×
- Total profit
- $69,248
- Equity at exit
- $75,941
- IRR
- 31.1%
- Equity multiple
- 7.50×
- Total profit
- $180,244
- Equity at exit
- $151,441
Cash invested: $27,720 (down + closing). Projections, not guarantees.
Landlord ↔ Tenant lean methodology
- Overall (STATE)
- 15 Strongly Tenant-Friendly
- State New York
- 15 Strongly Tenant-Friendly · D+10
- County
- — inherits STATE
- City
- — inherits STATE
ZIP-level market 13827
- Home prices YoY
- 3.2%
- Active inventory
- 65
- Price-to-rent
- 6.2×
Monthly cashflow live
- Estimated rent
- $1,334 medium interval (Pro) →
- Mortgage (P&I)
- −$519
- Tax from tax record
- −$57 /mo · $681/yr
- Insurance
- −$41
- HOA
- −$0
- Vacancy / Maint / Mgmt
- −$280
- Net cashflow
- $437
Break-even live
Sensitivity live
| Price | -10% $493 | -5% $465 | +0% $437 | +5% $408 | +10% $380 |
|---|---|---|---|---|---|
| Rent | -10% $331 | -5% $384 | +0% $437 | +5% $489 | +10% $542 |
| Rate | -1.0pp $486 | -0.5pp $462 | base $437 | +0.5pp $411 | +1.0pp $385 |
UW: 25.0% down · 7.5% · 30yr · 1.5% tax · 5.0% vac · 8.0% maint · 8.0% mgmt
Financing live
Cash to close
- Down payment
- $24,750
- Closing costs
- $2,970
- Reserves months
- —
- Total cash needed
- —
Loan-product check · same deal, 3 products live
Conventional
25% down · 7.5% · 30yr
- Down + closing
- —
- Monthly P&I
- —
- Monthly cashflow
- —
- DSCR
- —
- Eligible?
- —
Personal DTI + credit; lowest rate.
DSCR
20% down · 8.5% · 30yr
- Down + closing
- —
- Monthly P&I
- —
- Monthly cashflow
- —
- DSCR
- —
- Eligible?
- —
No personal income docs; deal must DSCR.
Hard money
10% down · 12.0% · 12mo
- Down + closing
- —
- Monthly P&I
- —
- Monthly cashflow
- —
- DSCR
- —
- Eligible?
- —
Short-term bridge; refi at stabilization.
Rent comps 2 comps
| Address | Beds | Baths | Sqft | Rent | $/sqft | DOM | Units | Dist |
|---|---|---|---|---|---|---|---|---|
| 81 North Ave Unit 2 Owego, NY | 2.0 | 1.0 | 1000 | $1,300 | $1.30 | 45d | 1 | 0.28mi |
| 54 Central Ave #2 Owego, NY | 1.0 | 1.0 | 915 | $1,375 | $1.50 | 23d | 1 | 0.32mi |
Listing history 4 events
-
2026-06-21days on market $99,000 Active 4 DOM
-
2026-06-19days on market $99,000 Active 2 DOM
-
2026-06-17remarks 299-char remark
-
2026-06-17$99,000 Active 1 DOM
ⓘ Source: listings_history table (triggers on properties + properties_extension) + one-shot
backfill from property_details.listing_events for pre-trigger history.
Tax reassessment forecast NY · Partial reset (capped growth)
- Current annual tax
- $681 · $57/mo
- Projected year-2 tax
- $1,177 · $98/mo
- Expected delta
- +$496/yr (+$41/mo · 72.9%)
ⓘ Screening estimate from a state-policy table — verify with the county assessor before closing.
Climate risk First Street
- Flood 3/10 Moderate FEMA zone X (unshaded) · 9% chance over 30 yrs
- Wildfire 1/10 Low
- Heat 3/10 Moderate 8 d/yr ≥94°F today · 17 d/yr by 30 yrs out
- Wind 2/10 Low 100% chance of damaging wind over 30 yrs
- Air quality 2/10 Low 0 unhealthy d/yr today · 1 by 30 yrs out
Nearby sold comps map
Loading sold comps map…
Walkable amenities ~0.75 mi
Loading nearby amenities…
Taxation est. · year 1
- Rental income
- $16,005
- − Mortgage interest
- −$5,546
- − Property taxes
- −$681
- − Insurance
- −$495
- − Repairs & maintenance
- −$1,280
- − Management
- −$1,280
- − Depreciation
- −$2,880
- Taxable income
- $3,843
- Est. tax owed @ 24.0%
- −$922
- After-tax cash flow
- $4,316/yr
For passive investors: Depreciation is non-cash, so a rental often shows a tax loss while cash-flowing — sheltering income. Rental losses are passive: they offset passive income freely, and up to $25,000/yr can offset ordinary (W-2) income if you actively participate and your MAGI is under $100k (phasing out to $0 by $150k); unused losses carry forward. On sale, claimed depreciation is recaptured at up to 25%, and gains may owe capital-gains tax (a 1031 exchange can defer both). Figures are a year-1 estimate at your 24.0% rate — not tax advice; consult a CPA.
Schools (NCES district)
- District
- Owego-Apalachin Central School District
- NCES district ID
- 3622170
- Math proficiency
- 62% ▼ -1.00%
- Reading proficiency
- 62% ▲ 6.00%
- Median HH income
- $57,425
- Composite
- 53.45/100
- National rank
- #1464
- State rank
- #204 of 590 in NY
Livability — Owego
- Score
- 76/100
- State rank
- #214
- US rank
- #3289
Category grades
Schools grade is shown separately in the Schools card above.
Census & demographics
- Census place
- Owego, NY
- Population (ZIP)
- 11,713
Population outlook (Tioga County) Hauer SSP2
- Today (2025)
- 45,155 people
- By 2030
- 42,801 · -5.2%
- By 2040
- 37,960 · -15.9%
- By 2050
- 33,071 · -26.8%
- By 2075
- 24,144 · -46.5%
- By 2100
- 16,545 · -63.4%
Race, ethnicity, and origin ACS 2023
- Neighborhood character
- Predominantly White (93%)
- Race & ethnicity
- White 93% Two or more races 3% Hispanic / Latino 2% Asian 1%
- Common ancestry
- Romanian 5% Lithuanian 3% Iranian 2%
- Foreign-born
- 2% · China
- Languages at home
- 97% English-only · Spanish 1% Chinese 1% German/W. Germanic 1%
Political lean MEDSL · Tioga
- 2024 margin
- Strong R (+22.9) · D 38.6% · R 61.4%
- 2008→2024 swing
- -12.7pp toward R · 2008: -10.2pp · 2024: -22.9pp
- All cycles
- 2024: R+22.9 2020: R+20.6 2016: R+27.6 2012: R+15.1 2008: R+10.2
Not yet ingested
- Civics
- —
Market trends
- HPI YoY
- ▲ 8.11%
- Current HPI
- 259.9605
- Rent YoY
- —
- Metro
- —
- State GDP YoY
- ▲ 2.60%
- F500 in state
- 92
Industry mix (Fortune 500 HQ in NY)
| Industry | F500 HQs | Revenue |
|---|---|---|
| Financial Services | 10 | $950B |
|
||
| Consumer Goods | 9 | $162B |
|
||
| Insurance | 4 | $225B |
|
||
| Telecommunications | 2 | $144B |
|
||
| Pharmaceuticals | 2 | $112B |
|
||
| Media / Entertainment | 2 | $69B |
|
||
Price history
+825.2% since first listed14 events — show timeline
- 2026-06-17 Listed $99,000 GBAOR
- 2025-08-29 Price Changed $96,000 GBAOR
- 2025-07-16 Listed $99,000 GBAOR
- 2025-05-02 Sold (Public Records) $78,000 Public Records
- 2025-05-01 Sold (MLS) $78,000 GBAOR
- 2025-04-04 Pending — GBAOR
- 2025-03-20 Price Changed $84,900 GBAOR
- 2025-02-25 Listed $89,900 GBAOR
- 2022-10-14 Price Changed $49,500 GBAOR
- 2022-10-10 Relisted — GBAOR
- 2022-09-20 Listed $58,500 GBAOR
- 2005-09-07 Sold (Public Records) $22,000 Public Records
- 2002-07-03 Listed $40,900 GBAOR
- 1996-12-17 Sold (Public Records) $10,700 Public Records
Property tax history
-8.4%/yrLatest (2025): $681 · -66.5% YoY. Source: county tax records.
Cash-flow waterfall
monthlySold comps — $/sqft
last 12 mo · ≤1 miLoading sold comps…