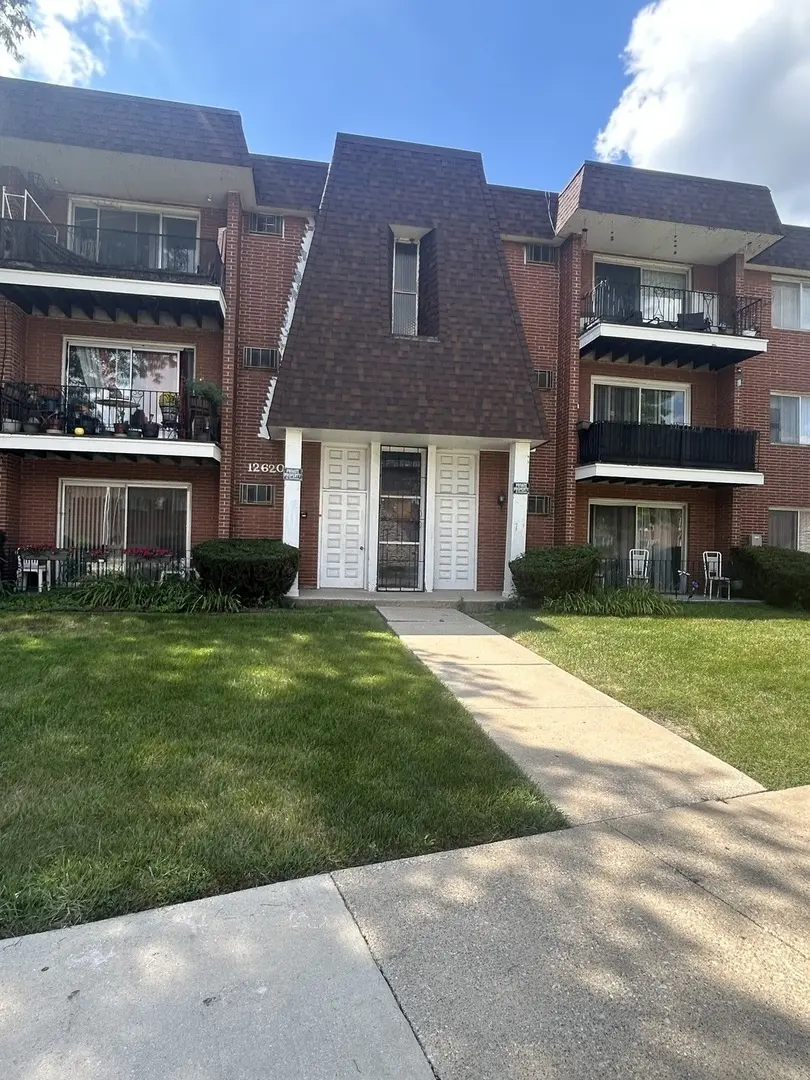
12620 S Alpine Dr #4 · Alsip, IL
Flood risk 3/10 · Minor
- FEMA flood zone
- X (unshaded)
- Chance of flooding over 30 yrs
- 0.2%
- Est. flood insurance / yr
- $507 – $1,088
Fire risk 1/10 · Minimal
- Est. fire insurance / yr
- $804 – $1,492
Heat risk 3/10 · Minor
- Hot days now (above 101°F)
- 7 days/yr
- Hot days in 30 yrs
- 15 days/yr
Wind risk 2/10 · Minimal
- Chance of severe wind over 30 yrs
- —
Air-quality risk 3/10 · Minor
- Unhealthy air days now
- 4 days/yr
- Unhealthy air days in 30 yrs
- 4 days/yr
Risk factors via First Street. Map © Google.
Why this score? — see what drove the D grade
The composite is a weighted blend of 9 inputs, each scored 0–100. Each bar is that input's sub-score; the figure is the points it added to the 100-point composite (weight × sub-score).
- ARV discount +15.0/15.0
- Cash flow +8.1/30.0
- 1% rule +7.2/10.0
- Livability +3.9/5.0
- Rent growth +2.5/5.0
- Condition / age +2.5/5.0
- DSCR +2.1/10.0
- Schools +1.6/10.0
- Appreciation +0.0/10.0
$129,000
🖨 Deal sheet (PDF) 📄 Offer letter ✓ Due diligence
Listing remarks MLS
Fully Remodeled 2 bedrooms, one bath, on the FIRST floor, freshly Painted, Appliances with a dishwasher, Microwave, Spacious living Room, to outdoor balcony, laundry room 5 feet's away. Fees covers, heat, water, Trash. and all exterior maintenance. FHA. is OK.
Key facts
- Outdoor balcony
- Fully remodeled
- Laundry room
Tags
Neighborhood map
What this means for you Summary
Snapshot
- This is a 2-bed/1.0-bath condo listed at $129k.
Deal economics
- At list price, monthly cash flow is $-126 ($-2k/yr) — negative.
- To cash-flow at today's rent, offer at most $107k (17.3% below list).
- Meets the 1% rule at list price ($2k rent vs $129k).
- Recommended offer: $107k (17.3% below list) — sets the bar for cash-flow.
- Cap rate 5.1% vs local median 3.5% in Alsip — top-decile yield for the area; either an underpriced asset or a hidden risk that comps aren't pricing in. Stress-test before assuming the spread holds.
Location & tenants
- Location reads 77/100 on livability (#166 in IL, #3,042 nationally) — a middle-class / working-renter tenant base. Strengths: commute A+, cost of living A+, housing A+; Watch: health & safety C-, crime D+, amenities D+.
- Chsd 218 (suburban): math 14% / reading 20% proficiency, ranked #454 of 620 in IL (top 73%) — low school quality limits family demand, transient renter base, plan for 1-2y turnover.
- Zoned schools: Hazelgreen Elem School (math 8% / reading 27%, grade F, #1,136 of 2,056 statewide, top 55%, 274 students, 0% FRL); Prairie Jr High School (math 14% / reading 35%, grade F, #332 of 665 statewide, top 55%, 336 students, 0% FRL); Dd Eisenhower High Sch (Campus) (math 10% / reading 13%, grade F, #520 of 693 statewide, top 75%, 1,841 students, 0% FRL).
- Market conditions: 47 active listings in the ZIP; 2 comparable units currently listed for rent nearby; 6,272 units permitted in Cook County in 2024 (4,658 in 5+ unit buildings).
Forward outlook
- Local home prices are declining (-3.0%/yr); year-one equity from $892 of loan paydown is wiped out by about $4k of value loss. Plan a longer hold.
Negotiation context
- It's been on market 67 days — a 6% lower offer ($121k) is reasonable based on typical stale-listing flexibility.
- 12 sale attempts since 18y ago; this cycle's ask has dropped $16k (11%) from the opening price — seller is motivated, your offer sets the floor, not the list.
- Current owner paid $29k; list at $129k implies a 345% gain — meaningful room to come down on a strong offer.
Risks & watch-outs
- Watch-outs: HOA is 27% of rent.
Questions for the listing agent
- What do current leases actually rent for vs. the listed asking? Can we see a recent rent roll and the last 12 months of T-12 income?
- It's been on market 67 days. Have you received any prior offers? Is the seller open to a 17% concession, seller financing, or rate buy-down credit?
- Built in 1968 — when were the roof, HVAC, electrical panel, plumbing, and water heater last replaced?
- What does the HOA fee cover, when was the last increase, and are there any pending special assessments or reserve-fund shortfalls?
- Any open or pending special assessments — roof, HVAC, plumbing, elevator, façade? What's the per-unit balance and payoff schedule, and is the seller paying it off at close or rolling it to the buyer?
- Why hasn't it sold? Are there any deal-killer items the seller is aware of (foundation, flood, title, zoning, code violations)?
- Is there a deadline driving the sale (1031 exchange, divorce, estate, relocation)? That informs how much negotiation room exists.
- Schools are D-rated, which usually means shorter tenancies and higher turnover. Who's the typical renter profile here, and what's been the actual vacancy rate?
- Crime grade is D in this area — have there been break-ins, vandalism, or insurance claims at this property in the last 3 years? What carrier currently insures it and at what premium?
- The area grade is low — what's the realistic commute time and amenity access for the typical tenant pool here? Any planned neighborhood developments (good or bad) we should know about?
- What's the average days-on-market for RENTAL listings here right now (not sales)? A rising rental-DOM trend means longer vacancies and softer asking-rent achievability than the comps imply.
- What's the recent tenant-quality profile in this submarket — average credit score on applications, eviction rate, late-payment / NSF rate, and stable-employment percentage? A property-management company in the area should have these aggregated.
- How much new apartment / multifamily construction is in the pipeline within 1–3 miles? Heavy new supply (>2% of stock underway) typically softens rents 12–24 months out; light construction supports rent growth.
Investment metrics
- 1% rule
- 1.22% ✓
- Cap rate
- 5.12%
- Cash-on-cash
- -4.20%
- DSCR
- 0.81
- GRM
- 6.8
CMA / ARV
- ARV (median comp)
- $162,327
- List price
- $129,000
- Delta
- -20.53%
- Verdict
- UNDERPRICED
- Comps
- 20 within 1.0 mi
Projected returns pro-forma
-3.0% appreciation · 3.0% rent growth · sell at horizon
- IRR
- -23.0%
- Equity multiple
- 0.21×
- Total profit
- $-28,631
- Equity at exit
- $19,234
- IRR
- -16.7%
- Equity multiple
- 0.06×
- Total profit
- $-33,994
- Equity at exit
- $11,154
Cash invested: $36,120 (down + closing). Projections, not guarantees.
Landlord ↔ Tenant lean methodology
- Overall (STATE)
- 43 Moderately Tenant-Leaning
- State Illinois
- 43 Moderately Tenant-Leaning · D+7
- County
- — inherits STATE
- City
- — inherits STATE
ZIP-level market 60803
- Home prices YoY
- -32.3%
- Active inventory
- 47
- Price-to-rent
- 6.8×
Monthly cashflow live
- Estimated rent
- $1,578 medium interval (Pro) →
- Mortgage (P&I)
- −$676
- Tax from tax record
- −$221 /mo · $2,652/yr
- Insurance
- −$54
- HOA
- −$422
- Vacancy / Maint / Mgmt
- −$331
- Net cashflow
- $-126
Break-even live
Sensitivity live
| Price | -10% $-53 | -5% $-90 | +0% $-126 | +5% $-163 | +10% $-199 |
|---|---|---|---|---|---|
| Rent | -10% $-251 | -5% $-189 | +0% $-126 | +5% $-64 | +10% $-2 |
| Rate | -1.0pp $-61 | -0.5pp $-94 | base $-126 | +0.5pp $-160 | +1.0pp $-194 |
UW: 25.0% down · 7.5% · 30yr · 1.5% tax · 5.0% vac · 8.0% maint · 8.0% mgmt
Financing live
Cash to close
- Down payment
- $32,250
- Closing costs
- $3,870
- Reserves months
- —
- Total cash needed
- —
Loan-product check · same deal, 3 products live
Conventional
25% down · 7.5% · 30yr
- Down + closing
- —
- Monthly P&I
- —
- Monthly cashflow
- —
- DSCR
- —
- Eligible?
- —
Personal DTI + credit; lowest rate.
DSCR
20% down · 8.5% · 30yr
- Down + closing
- —
- Monthly P&I
- —
- Monthly cashflow
- —
- DSCR
- —
- Eligible?
- —
No personal income docs; deal must DSCR.
Hard money
10% down · 12.0% · 12mo
- Down + closing
- —
- Monthly P&I
- —
- Monthly cashflow
- —
- DSCR
- —
- Eligible?
- —
Short-term bridge; refi at stabilization.
Rent comps 2 comps
| Address | Beds | Baths | Sqft | Rent | $/sqft | DOM | Units | Dist |
|---|---|---|---|---|---|---|---|---|
| 5723 129th St Crestwood, IL | 2.0 | 1.0 | 950 | $1,600 | $1.68 | 0d | 1 | 0.45mi |
| 10410 S Moody Ave Palos Heights, IL | 2.0 | 1.0 | 1000 | $1,600 | $1.60 | 5d | 1 | 0.85mi |
HOA detail condo
- Monthly dues
- $422 · $5,064/yr
- Likely covers
- watertrashexterior maint.
- Assessments
- None detected in remarks — confirm with the listing agent.
Listing history 50 events
-
2026-06-21days on market $129,000 Active 67 DOM
-
2026-06-18days on market $129,000 Active 64 DOM
-
2026-06-17days on market $129,000 Active 63 DOM
-
2026-06-16days on market $129,000 Active 62 DOM
-
2026-06-15days on market $129,000 Active 61 DOM
-
2026-06-13days on market $129,000 Active 59 DOM
-
2026-06-09days on market $129,000 Active 55 DOM
-
2026-06-08days on market $129,000 Active 54 DOM
-
2026-06-07days on market $129,000 Active 53 DOM
-
2026-06-04days on market $129,000 Active 50 DOM
-
2026-06-03days on market $129,000 Active 49 DOM
-
2026-06-02days on market $129,000 Active 48 DOM
-
2026-06-01days on market $129,000 Active 47 DOM
-
2026-05-31days on market $129,000 Active 46 DOM
-
2026-05-14price $129,000 263-char remark
Show marketing remark (263 chars)
Fully Remodeled 2 bedrooms, one bath, on the FIRST floor, freshly Painted, Appliances with a dishwasher, Microwave, Spacious living Room, to outdoor balcony, laundry room 5 feet's away. Fees covers, heat, water, Trash. and all exterior maintenance. FHA. is OK.
-
2026-05-06price $139,000 263-char remark
Show marketing remark (263 chars)
Fully Remodeled 2 bedrooms, one bath, on the FIRST floor, freshly Painted, Appliances with a dishwasher, Microwave, Spacious living Room, to outdoor balcony, laundry room 5 feet's away. Fees covers, heat, water, Trash. and all exterior maintenance. FHA. is OK.
-
2026-04-15$145,000 Active 263-char remark
Show marketing remark (263 chars)
Fully Remodeled 2 bedrooms, one bath, on the FIRST floor, freshly Painted, Appliances with a dishwasher, Microwave, Spacious living Room, to outdoor balcony, laundry room 5 feet's away. Fees covers, heat, water, Trash. and all exterior maintenance. FHA. is OK.
-
2025-12-27historical
-
2025-12-17price
-
2025-09-12price
-
2025-08-31Active
-
2022-12-05historical
-
2022-08-24price
-
2022-08-05price
-
2022-07-20Active
-
2019-12-12historical
-
2019-09-12New
-
2015-03-24historical
-
2014-10-29price
-
2014-08-17price Price Change
-
2014-05-07status Active
-
2014-04-23historical
-
2014-04-16New
-
2013-10-16soldstatus $29,000 Closed Sale
-
2013-04-22status Pending
-
2013-03-12historical Contingent
-
2013-02-18$29,000 New
-
2013-02-12historical
-
2012-11-08New
-
2012-04-10historical
-
2011-09-28price Price Change
-
2011-07-02price Price Change
-
2011-07-02New
-
2011-06-29historical
-
2010-07-20price Price Change
-
2010-01-31price Price Change
-
2010-01-22New
-
2009-09-01historical
-
2009-07-12price
-
2009-07-07price Price Change
ⓘ Source: listings_history table (triggers on properties + properties_extension) + one-shot
backfill from property_details.listing_events for pre-trigger history.
Tax reassessment forecast IL · Partial reset (capped growth)
- Current annual tax
- $2,652 · $221/mo
- Projected year-2 tax
- $2,790 · $233/mo
- Expected delta
- +$138/yr (+$11/mo · 5.2%)
ⓘ Screening estimate from a state-policy table — verify with the county assessor before closing.
Climate risk First Street
- Flood 3/10 Moderate FEMA zone X (unshaded) · 20% chance over 30 yrs
- Wildfire 1/10 Low
- Heat 3/10 Moderate 7 d/yr ≥101°F today · 15 d/yr by 30 yrs out
- Wind 2/10 Low
- Air quality 3/10 Moderate 4 unhealthy d/yr today · 4 by 30 yrs out
Nearby sold comps map
Loading sold comps map…
Walkable amenities ~0.75 mi
Loading nearby amenities…
Taxation est. · year 1
- Rental income
- $18,941
- − Mortgage interest
- −$7,226
- − Property taxes
- −$2,652
- − Insurance
- −$645
- − Repairs & maintenance
- −$1,515
- − Management
- −$1,515
- − HOA
- −$5,064
- − Depreciation
- −$3,753
- Taxable loss
- −$3,430
- Est. tax savings @ 24.0%
- +$823
- After-tax cash flow
- $-693/yr
For passive investors: Depreciation is non-cash, so a rental often shows a tax loss while cash-flowing — sheltering income. Rental losses are passive: they offset passive income freely, and up to $25,000/yr can offset ordinary (W-2) income if you actively participate and your MAGI is under $100k (phasing out to $0 by $150k); unused losses carry forward. On sale, claimed depreciation is recaptured at up to 25%, and gains may owe capital-gains tax (a 1031 exchange can defer both). Figures are a year-1 estimate at your 24.0% rate — not tax advice; consult a CPA.
Schools (NCES district)
- District
- Chsd 218
- NCES district ID
- 1706540
- Math proficiency
- 14% ▼ -4.00%
- Reading proficiency
- 20% ▼ -1.00%
- Median HH income
- $57,166
- Composite
- 16.09/100
- National rank
- #9235
- State rank
- #454 of 620 in IL
Livability — Alsip
- Score
- 77/100
- State rank
- #166
- US rank
- #3042
Category grades
Schools grade is shown separately in the Schools card above.
Census & demographics
- Census place
- Alsip, IL
- County
- Cook County · 4,486,803 people
- City population
- 22,106
- Metro
- Chicago-Naperville-Elgin, IL-IN-WI
- Population (ZIP)
- 22,106
- Household income
- $67,014
- Rent vs Own
- Severe rent burden
- 683.0
Population outlook (Cook County) Hauer SSP2
- Today (2025)
- 5,347,519 people
- By 2030
- 5,357,703 · +0.2%
- By 2040
- 5,324,924 · -0.4%
- By 2050
- 5,230,762 · -2.2%
- By 2075
- 4,785,735 · -10.5%
- By 2100
- 4,188,836 · -21.7%
Race, ethnicity, and origin ACS 2023
- Neighborhood character
- Diverse neighborhood (Simpson 0.67)
- Race & ethnicity
- White 47% Hispanic / Latino 28% Black 19% Two or more races 11% Asian 2% Native American 1%
- Hispanic origin (detail)
- Mexican 25% Puerto Rican 1%
- Common ancestry
- Romanian 10% Iranian 1% Lithuanian 1%
- Foreign-born
- 10% · Canada, Vietnam
- Languages at home
- 77% English-only · Spanish 19% Russian/Polish/Slavic 1% Arabic 1%
Political lean MEDSL · Cook
- 2024 margin
- Solid D (+42.0) · D 70.4% · R 28.4% · Other 1.2%
- 2008→2024 swing
- -11.4pp toward R · 2008: 53.4pp · 2024: 42.0pp
- All cycles
- 2024: D+42.0 2020: D+50.3 2016: D+53.0 2012: D+49.4 2008: D+53.4
Not yet ingested
- Civics
- —
Market trends
- HPI YoY
- ▼ -110.48%
- Current HPI
- 231.175
- Rent YoY
- —
- Metro
- Chicago-Naperville-Elgin, IL-IN-WI
- State GDP YoY
- ▲ 1.59%
- F500 in state
- 60
Industry mix (Fortune 500 HQ in IL)
| Industry | F500 HQs | Revenue |
|---|---|---|
| Insurance | 4 | $201B |
|
||
| Consumer Goods | 4 | $87B |
|
||
| Industrial Machinery | 3 | $64B |
|
||
| Healthcare | 2 | $55B |
|
||
| Retail / Pharmacy | 1 | $148B |
|
||
| Agriculture / Food | 1 | $86B |
|
||
Price history
+344.8% since first listed39 events — show timeline
- 2026-05-14 Price Changed $129,000 MRED as Distributed by MLS Grid
- 2026-05-06 Price Changed $139,000 MRED as Distributed by MLS Grid
- 2026-04-15 Listed $145,000 MRED as Distributed by MLS Grid
- 2025-12-27 Listing Removed — MRED as Distributed by MLS Grid
- 2025-12-17 Price Changed — MRED as Distributed by MLS Grid
- 2025-09-12 Price Changed — MRED as Distributed by MLS Grid
- 2025-08-31 Listed — MRED as Distributed by MLS Grid
- 2022-12-05 Listing Removed — MRED as Distributed by MLS Grid
- 2022-08-24 Price Changed — MRED as Distributed by MLS Grid
- 2022-08-05 Price Changed — MRED as Distributed by MLS Grid
- 2022-07-20 Listed — MRED as Distributed by MLS Grid
- 2019-12-12 Listing Removed — MRED as Distributed by MLS Grid
- 2019-09-12 Listed — MRED as Distributed by MLS Grid
- 2015-03-24 Listing Removed — MRED as Distributed by MLS Grid
- 2014-10-29 Price Changed — MRED as Distributed by MLS Grid
- 2014-08-17 Price Changed — MRED as Distributed by MLS Grid
- 2014-05-07 Relisted — MRED as Distributed by MLS Grid
- 2014-04-23 Listing Removed — MRED as Distributed by MLS Grid
- 2014-04-16 Listed — MRED as Distributed by MLS Grid
- 2013-10-16 Sold (MLS) $29,000 MRED as Distributed by MLS Grid
- 2013-04-22 Pending — MRED as Distributed by MLS Grid
- 2013-03-12 Contingent — MRED as Distributed by MLS Grid
- 2013-02-18 Listed $29,000 MRED as Distributed by MLS Grid
- 2013-02-12 Listing Removed — MRED as Distributed by MLS Grid
- 2012-11-08 Listed — MRED as Distributed by MLS Grid
- 2012-04-10 Listing Removed — MRED as Distributed by MLS Grid
- 2011-09-28 Price Changed — MRED as Distributed by MLS Grid
- 2011-07-02 Price Changed — MRED as Distributed by MLS Grid
- 2011-07-02 Listed — MRED as Distributed by MLS Grid
- 2011-06-29 Listing Removed — MRED as Distributed by MLS Grid
- 2010-07-20 Price Changed — MRED as Distributed by MLS Grid
- 2010-01-31 Price Changed — MRED as Distributed by MLS Grid
- 2010-01-22 Listed — MRED as Distributed by MLS Grid
- 2009-09-01 Listing Removed — MRED as Distributed by MLS Grid
- 2009-07-12 Price Changed — MRED as Distributed by MLS Grid
- 2009-07-07 Price Changed — MRED as Distributed by MLS Grid
- 2009-02-23 Listed — MRED as Distributed by MLS Grid
- 2009-02-10 Listing Removed — MRED as Distributed by MLS Grid
- 2008-03-23 Listed — MRED as Distributed by MLS Grid
Property tax history
+4.8%/yrLatest (2023): $2,652 · +159.2% YoY. Source: county tax records.
Cash-flow waterfall
monthlySold comps — $/sqft
last 12 mo · ≤1 miLoading sold comps…