 🌊 Lakefront
2935 NE 163rd St Unit 3P · North Miami Beach, FL
Flood risk 9/10 · Severe
- FEMA flood zone
- AE
- Chance of flooding over 30 yrs
- 0.99%
- Est. flood insurance / yr
- $1,737 – $8,500
Fire risk 1/10 · Minimal
- Est. fire insurance / yr
- $947 – $1,759
Heat risk 10/10 · Severe
- Hot days now (above 103°F)
- 7 days/yr
- Hot days in 30 yrs
- 27 days/yr
Wind risk 10/10 · Severe
- Chance of severe wind over 30 yrs
- 99.0%
Air-quality risk 2/10 · Minimal
- Unhealthy air days now
- 1 days/yr
- Unhealthy air days in 30 yrs
- 2 days/yr
Risk factors via First Street. Map © Google.
Why this score? — see what drove the B+ grade
The composite is a weighted blend of 9 inputs, each scored 0–100. Each bar is that input's sub-score; the figure is the points it added to the 100-point composite (weight × sub-score).
- Cash flow +30.0/30.0
- 1% rule +10.0/10.0
- DSCR +10.0/10.0
- ARV discount +7.5/15.0
- Appreciation +5.3/10.0
- Schools +4.2/10.0
- Livability +4.1/5.0
- Rent growth +2.7/5.0
- Condition / age +2.5/5.0
$197,000
🖨 Deal sheet (PDF) 📄 Offer letter ✓ Due diligence
Listing remarks
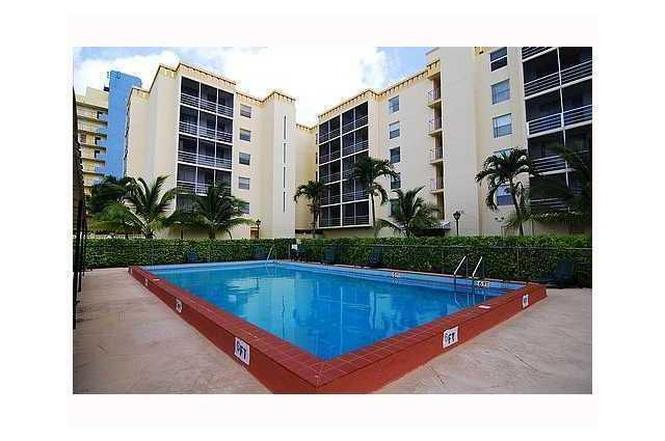
Spacious 1 bedroom apartment with pool and covered parking, providing convenience and protection for your vehicle in a prime North Miami Beach location. Features brand-new appliances. Enjoy a perfect balance of tranquility and accessibility just minutes from Oleta River State Park, Sunny Isles Beach, Aventura MAll, restaurants, shopping, and everyday services.
Key facts
- Covered parking
- Aventura mall
- Sunny isles beach
Tags
Property features AI
Finance
- Other: Annual tax listed (refer to official docs for amount)
- Financial info: Lease considered; No pets allowed
- HOA & community: Monthly association fee; Association includes common area maintenance, building maintenance, trash, and water; Association amenities: clubhouse, laundry facilities, pool
Exterior
- Parking: Detached covered garage with 1 space
- Security: Intercom
- Utilities: Water included in association fee; Municipal sewer; Electric service
- Home design: Attached property; 5-story building; Entry on level 3
- Construction: Block construction; Resale property
- Exterior features: Balcony; Screened balcony; Storm/security shutters; Association pool
Interior
- Kitchen: Dishwasher; Electric range; Microwave; Refrigerator
- Bedrooms: Bedroom on main level
- Flooring: Ceramic tile
- Bathrooms: 1 full bathroom; 1 half bathroom
- Heating & cooling: Central heating; Central air conditioning
- Interior features: Blinds on windows; Closet cabinetry; Bedroom located on main level
- Laundry & utility: Common area laundry; Electric water heater
Neighborhood map
What this means for you Summary
Snapshot
- This is a 1-bed/1.0-bath condo listed at $197k.
Deal economics
- At list price, monthly cash flow is $468 ($6k/yr) — positive.
- The deal already cash-flows at list — no discount required.
- Meets the 1% rule at list price ($3k rent vs $197k).
- Recommended offer: $173k (12.0% below list) — sets the bar for market timing.
- Cap rate 11.7% vs local median 5.2% in North Miami Beach — top-decile yield for the area; either an underpriced asset or a hidden risk that comps aren't pricing in. Stress-test before assuming the spread holds.
Location & tenants
- Location reads 82/100 on livability (#71 in FL, #1,177 nationally) — a professional / high-income tenant draw. Strengths: commute A+, housing A+, health & safety A+; Watch: employment D+, crime F.
- Miami-Dade (suburban): math 45% / reading 54% proficiency, ranked #40 of 73 in FL (top 55%) — families likely to look elsewhere, expect single-tenant / working-renter base with shorter leases; 64% free/reduced lunch — lower-income household profile, screen leases tightly.
- Zoned schools: Ojus Elementary School (math 56% / reading 59%, grade C+, #764 of 2,144 statewide, top 36%, 776 students, 63% FRL); Highland Oaks Middle School (math 28% / reading 51%, grade F, #373 of 571 statewide, top 66%, 774 students, 50% FRL); Alonzo & Tracy Mourning Senior High School (math 38% / reading 50%, grade F, #244 of 667 statewide, top 37%, 1,597 students, 48% FRL).
- Market conditions: Rents flat; 1879 active listings in the ZIP; 10,051 units permitted in Miami-Dade County in 2024 (7,758 in 5+ unit buildings).
Forward outlook
- In year one you build about $2k of equity ($1k loan paydown + $1k appreciation (0.5% local appreciation)).
- Miami-Dade County population projected at +28% by 2050 — long-run rental-demand tailwind backs the buy-and-hold thesis.
- At projected returns (0.5% appreciation + 0.9% rent growth), your $55k cash investment doubles in ~7 years — after that, you're playing with house money.
Negotiation context
- It's been on market 176 days — a 12% lower offer ($173k) is reasonable based on typical stale-listing flexibility.
- 12 sale attempts since 10y ago; this cycle's ask is 12212% above the opening price — seller raised mid-cycle; expect resistance to lowballs.
- Current owner paid $77k; list at $197k implies a 156% gain — meaningful room to come down on a strong offer.
Risks & watch-outs
- Watch-outs: flood insurance adds $427/mo.
- Climate carrying-cost: in FEMA flood zone AE (mandatory federal flood insurance); severe wind risk, 99% chance of damaging wind over 30y; extreme-heat days projected 7→27/yr by 2055 (HVAC capex compounding) — expect insurance premiums to compound above CPI over the hold.
Questions for the listing agent
- It's been on market 176 days. Have you received any prior offers? Is the seller open to a 12% concession, seller financing, or rate buy-down credit?
- Built in 1973 — when were the roof, HVAC, electrical panel, plumbing, and water heater last replaced?
- What's the actual annual flood-insurance premium (NFIP or private), and is the property in a SFHA with mandatory coverage?
- What does the HOA fee cover, when was the last increase, and are there any pending special assessments or reserve-fund shortfalls?
- Any open or pending special assessments — roof, HVAC, plumbing, elevator, façade? What's the per-unit balance and payoff schedule, and is the seller paying it off at close or rolling it to the buyer?
- Why hasn't it sold? Are there any deal-killer items the seller is aware of (foundation, flood, title, zoning, code violations)?
- Is there a deadline driving the sale (1031 exchange, divorce, estate, relocation)? That informs how much negotiation room exists.
- Crime grade is F in this area — have there been break-ins, vandalism, or insurance claims at this property in the last 3 years? What carrier currently insures it and at what premium?
- This sits on a lake — are riparian / water-frontage rights deeded with the parcel? Any dock permits, shoreline easements, or HOA water-use restrictions?
- What's the documented flood / surge / shoreline-erosion history here (FEMA AND non-FEMA — e.g., storm surge, creek backup, septic-field saturation)?
- Any water-quality or seasonal algae-bloom issues that affect tenant satisfaction or short-term-rental demand?
- What's the average days-on-market for RENTAL listings here right now (not sales)? A rising rental-DOM trend means longer vacancies and softer asking-rent achievability than the comps imply.
- What's the recent tenant-quality profile in this submarket — average credit score on applications, eviction rate, late-payment / NSF rate, and stable-employment percentage? A property-management company in the area should have these aggregated.
- How much new apartment / multifamily construction is in the pipeline within 1–3 miles? Heavy new supply (>2% of stock underway) typically softens rents 12–24 months out; light construction supports rent growth.
Investment metrics
- 1% rule
- 1.74% ✓
- Cap rate
- 11.74%
- Cash-on-cash
- 19.47%
- DSCR
- 1.87
- GRM
- 4.8
CMA / ARV
No comps found within radius.
Projected returns pro-forma
0.53% appreciation · 0.94% rent growth · sell at horizon
- IRR
- 8.5%
- Equity multiple
- 1.41×
- Total profit
- $22,614
- Equity at exit
- $62,448
- IRR
- 11.0%
- Equity multiple
- 2.17×
- Total profit
- $64,583
- Equity at exit
- $79,390
Cash invested: $55,160 (down + closing). Projections, not guarantees.
Landlord ↔ Tenant lean methodology
- Overall (STATE)
- 87 Strongly Landlord-Friendly
- State Florida
- 87 Strongly Landlord-Friendly · R+3
- County
- — inherits STATE
- City
- — inherits STATE
ZIP-level market 33160
- Home prices YoY
- 0.2%
- Rents YoY
- 0.9%
- Active inventory
- 1879
- Price-to-rent
- 4.8×
Monthly cashflow live
- Estimated rent
- $3,437 medium interval (Pro) →
- Mortgage (P&I)
- −$1,033
- Tax from tax record
- −$262 /mo · $3,148/yr
- Insurance
- −$82
- Flood insurance flood zone
- −$427 /mo · $5,118/yr
- HOA
- −$443
- Vacancy / Maint / Mgmt
- −$722
- Net cashflow
- $468
Break-even live
Sensitivity live
| Price | -10% $580 | -5% $524 | +0% $468 | +5% $413 | +10% $357 |
|---|---|---|---|---|---|
| Rent | -10% $197 | -5% $333 | +0% $468 | +5% $604 | +10% $740 |
| Rate | -1.0pp $568 | -0.5pp $518 | base $468 | +0.5pp $417 | +1.0pp $365 |
UW: 25.0% down · 7.5% · 30yr · 1.5% tax · 5.0% vac · 8.0% maint · 8.0% mgmt
Financing live
Cash to close
- Down payment
- $49,250
- Closing costs
- $5,910
- Reserves months
- —
- Total cash needed
- —
Loan-product check · same deal, 3 products live
Conventional
25% down · 7.5% · 30yr
- Down + closing
- —
- Monthly P&I
- —
- Monthly cashflow
- —
- DSCR
- —
- Eligible?
- —
Personal DTI + credit; lowest rate.
DSCR
20% down · 8.5% · 30yr
- Down + closing
- —
- Monthly P&I
- —
- Monthly cashflow
- —
- DSCR
- —
- Eligible?
- —
No personal income docs; deal must DSCR.
Hard money
10% down · 12.0% · 12mo
- Down + closing
- —
- Monthly P&I
- —
- Monthly cashflow
- —
- DSCR
- —
- Eligible?
- —
Short-term bridge; refi at stabilization.
HOA detail condo
- Monthly dues
- $443 · $5,316/yr
- Likely covers
- pool
- Assessments
- None detected in remarks — confirm with the listing agent.
Listing history 40 events
-
2026-06-16days on market $197,000 Active 176 DOM
-
2026-06-15days on market $197,000 Active 175 DOM
-
2026-06-13days on market $197,000 Active 173 DOM
-
2026-06-09days on market $197,000 Active 169 DOM
-
2026-06-08days on market $197,000 Active 168 DOM
-
2026-06-07days on market $197,000 Active 167 DOM
-
2026-06-04days on market $197,000 Active 164 DOM
-
2026-06-03days on market $197,000 Active 163 DOM
-
2026-06-02days on market $197,000 Active 162 DOM
-
2026-06-01days on market $197,000 Active 161 DOM
-
2026-05-31days on market $197,000 Active 160 DOM
-
2026-02-04historical $1,600
-
2025-12-23$1,600
-
2025-12-22$197,000 Active
-
2025-12-01historical $1,700
-
2025-12-01historical
-
2025-10-14price $1,700
-
2025-08-26$1,900
-
2025-08-25historical $1,900
-
2025-08-25$197,000 Active
-
2025-08-14price $197,000
-
2025-08-05price $215,000
-
2025-06-28$1,900
-
2025-06-09$220,000 Active
-
2025-05-13historical $1,650
-
2025-01-16$1,650
-
2023-12-27historical $1,750
-
2023-11-17$1,750
-
2023-11-03historical $1,750
-
2023-10-29$1,750
-
2020-07-01historical
-
2019-07-16$155,000 Active
-
2018-03-15historical
-
2017-09-16$155,000 Active
-
2016-06-06historical
-
2016-02-10price $162,000
-
2016-01-20$165,000 Active
-
2013-04-24soldstatus $77,000 Sold
-
1993-09-17soldstatus $34,000
-
1973-11-01soldstatus $24,800
ⓘ Source: listings_history table (triggers on properties + properties_extension) + one-shot
backfill from property_details.listing_events for pre-trigger history.
Tax reassessment forecast FL · Resets to sale price
- Current annual tax
- $3,148 · $262/mo
- Projected year-2 tax
- $3,148 · $262/mo
- Expected delta
- $0/yr ($0/mo · -0.0%)
ⓘ Screening estimate from a state-policy table — verify with the county assessor before closing.
Climate risk First Street
- Flood 9/10 Extreme FEMA zone AE · 99% chance over 30 yrs
- Wildfire 1/10 Low
- Heat 10/10 Extreme 7 d/yr ≥103°F today · 27 d/yr by 30 yrs out
- Wind 10/10 Extreme 99% chance of damaging wind over 30 yrs
- Air quality 2/10 Low 1 unhealthy d/yr today · 2 by 30 yrs out
Nearby sold comps map
Loading sold comps map…
Walkable amenities ~0.75 mi
Loading nearby amenities…
Taxation est. · year 1
- Rental income
- $41,247
- − Mortgage interest
- −$11,035
- − Property taxes
- −$3,148
- − Insurance
- −$6,104
- − Repairs & maintenance
- −$3,300
- − Management
- −$3,300
- − HOA
- −$5,316
- − Depreciation
- −$5,731
- Taxable income
- $3,314
- Est. tax owed @ 24.0%
- −$795
- After-tax cash flow
- $4,825/yr
For passive investors: Depreciation is non-cash, so a rental often shows a tax loss while cash-flowing — sheltering income. Rental losses are passive: they offset passive income freely, and up to $25,000/yr can offset ordinary (W-2) income if you actively participate and your MAGI is under $100k (phasing out to $0 by $150k); unused losses carry forward. On sale, claimed depreciation is recaptured at up to 25%, and gains may owe capital-gains tax (a 1031 exchange can defer both). Figures are a year-1 estimate at your 24.0% rate — not tax advice; consult a CPA.
Schools (NCES district)
- District
- Miami-Dade
- NCES district ID
- 1200390
- Math proficiency
- 45% ▼ -16.00%
- Reading proficiency
- 54% ▼ -5.00%
- Median HH income
- $43,928
- Composite
- 41.76/100
- National rank
- #3397
- State rank
- #40 of 73 in FL
Livability — North Miami Beach
- Score
- 82/100
- State rank
- #71
- US rank
- #1177
Category grades
Schools grade is shown separately in the Schools card above.
Census & demographics
- Census place
- North Miami Beach, FL
- County
- Miami-Dade County · 2,697,751 people
- City population
- 34,147
- Metro
- Miami-Fort Lauderdale-Pompano Beach, FL
- Population (ZIP)
- 43,718
- Household income
- $67,040
- Rent vs Own
- Severe rent burden
- 3106.0
Population outlook (Miami-Dade County) Hauer SSP2
- Today (2025)
- 3,126,439 people
- By 2030
- 3,325,765 · +6.4%
- By 2040
- 3,697,561 · +18.3%
- By 2050
- 4,012,134 · +28.3%
- By 2075
- 4,605,612 · +47.3%
- By 2100
- 4,866,598 · +55.7%
Race, ethnicity, and origin ACS 2023
- Neighborhood character
- Diverse neighborhood (Simpson 0.59)
- Race & ethnicity
- Hispanic / Latino 46% White 44% Two or more races 27% Black 4% Asian 2%
- Hispanic origin (detail)
- Mexican 1% Puerto Rican 3% Cuban 8% Dominican 1% Salvadoran 4%
- Common ancestry
- Scotch-Irish 8% Hispanic 3% Subsaharan African 3%
- Foreign-born
- 61% · Canada, Jamaica, Dominican Republic
- Languages at home
- 29% English-only · Spanish 45% Russian/Polish/Slavic 12% Other Indo-European 5%
Political lean MEDSL · Miami-Dade
- 2024 margin
- R (+11.4) · D 43.9% · R 55.4%
- 2008→2024 swing
- -27.6pp toward R · 2008: 16.1pp · 2024: -11.4pp
- All cycles
- 2024: R+11.4 2020: D+7.3 2016: D+29.6 2012: D+23.7 2008: D+16.1
Not yet ingested
- Civics
- —
Market trends
- HPI YoY
- ▲ 0.53%
- Current HPI
- 284.9293
- Rent YoY
- ▲ 0.94%
- Metro
- Miami-Fort Lauderdale-Pompano Beach, FL
- State GDP YoY
- ▲ 3.28%
- F500 in state
- 36
Industry mix (Fortune 500 HQ in FL)
| Industry | F500 HQs | Revenue |
|---|---|---|
| Industrial Technology | 2 | $29B |
|
||
| Insurance | 2 | $17B |
|
||
| Retail | 1 | $60B |
|
||
| Technology Distribution | 1 | $58B |
|
||
| Homebuilding | 1 | $35B |
|
||
| Technology Manufacturing | 1 | $35B |
|
||
Price history
-93.5% since first listed29 events — show timeline
- 2026-02-04 Rental Removed $1,600 MARMLS
- 2025-12-23 Listed for Rent $1,600 MARMLS
- 2025-12-22 Listed $197,000 MARMLS
- 2025-12-01 Rental Removed $1,700 MARMLS
- 2025-12-01 Listing Removed — MARMLS
- 2025-10-14 Price Changed $1,700 MARMLS
- 2025-08-26 Listed for Rent $1,900 MARMLS
- 2025-08-25 Rental Removed $1,900 MARMLS
- 2025-08-25 Listed $197,000 MARMLS
- 2025-08-14 Price Changed $197,000 MARMLS
- 2025-08-05 Price Changed $215,000 MARMLS
- 2025-06-28 Listed for Rent $1,900 MARMLS
- 2025-06-09 Listed $220,000 MARMLS
- 2025-05-13 Rental Removed $1,650 MARMLS
- 2025-01-16 Listed for Rent $1,650 MARMLS
- 2023-12-27 Rental Removed $1,750 MARMLS
- 2023-11-17 Listed for Rent $1,750 MARMLS
- 2023-11-03 Rental Removed $1,750 MARMLS
- 2023-10-29 Listed for Rent $1,750 MARMLS
- 2020-07-01 Listing Removed — MARMLS
- 2019-07-16 Listed $155,000 MARMLS
- 2018-03-15 Listing Removed — MARMLS
- 2017-09-16 Listed $155,000 MARMLS
- 2016-06-06 Listing Removed — MARMLS
- 2016-02-10 Price Changed $162,000 MARMLS
- 2016-01-20 Listed $165,000 MARMLS
- 2013-04-24 Sold (MLS) $77,000 MARMLS
- 1993-09-17 Sold (Public Records) $34,000 Public Records
- 1973-11-01 Sold (Public Records) $24,800 Public Records
Property tax history
+8.9%/yrLatest (2025): $3,148 · -6.6% YoY. Source: county tax records.
Cash-flow waterfall
monthlySold comps — $/sqft
last 12 mo · ≤1 miLoading sold comps…