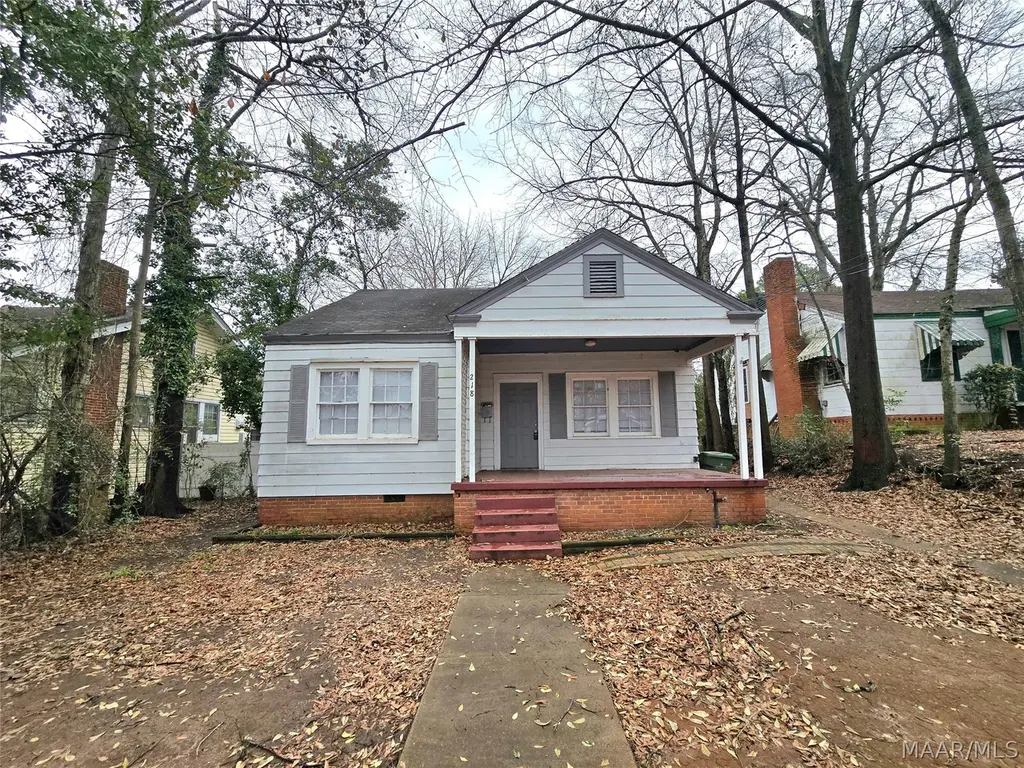
218 N Lewis St · Montgomery, AL
Flood risk 1/10 · Minimal
- FEMA flood zone
- X (unshaded)
- Chance of flooding over 30 yrs
- 0.0%
- Est. flood insurance / yr
- $507 – $1,088
Fire risk 3/10 · Minor
- Est. fire insurance / yr
- $916 – $1,700
Heat risk 7/10 · Major
- Hot days now (above 107°F)
- 7 days/yr
- Hot days in 30 yrs
- 19 days/yr
Wind risk 8/10 · Major
- Chance of severe wind over 30 yrs
- 80.0%
Air-quality risk 3/10 · Minor
- Unhealthy air days now
- 4 days/yr
- Unhealthy air days in 30 yrs
- 4 days/yr
Risk factors via First Street. Map © Google.
Why this score? — see what drove the C- grade
The composite is a weighted blend of 9 inputs, each scored 0–100. Each bar is that input's sub-score; the figure is the points it added to the 100-point composite (weight × sub-score).
- Cash flow +26.1/30.0
- DSCR +8.8/10.0
- 1% rule +6.0/10.0
- Rent growth +3.8/5.0
- Livability +3.2/5.0
- Condition / age +2.5/5.0
- Schools +1.7/10.0
- ARV discount +0.0/15.0
- Appreciation +0.0/10.0
$84,000
🖨 Deal sheet (PDF) 📄 Offer letter ✓ Due diligence
Listing remarks MLS
A Great Value-Add Opportunity Near Downtown Montgomery. Investors??? Ready. .. Set. .. GO! Nearly 1000 Sq Ft Of Advantageous Hardwoods Will Navigate You Throughout This Well-Maintained 2 Bedroom/1 Bath Floorplan. Presenting A Large Living Room That's Ideal For Family Gatherings-And A Feature Rich Kitchen And Dining Space For Convenience And Purposeful Dining! This Charming Cottage Is A Definitive Staple In The Historic District And A Perfect Fit For You! Schedule Your Showing Today- Please Verify Any Pertinent Info. Conveniently Located Near Thriving Downtown Montgomery. * * This Property Can Also Be Purchased Along With 122 S Capitol Pkwy, 404 S Capitol Pkwy, 2106 Capitol Ave, 2134 Winona Ave, 2040 Mckinely Ave, And 690 Ponce De Leon Ave-All Or In Part At A Total Portfolio Package Price Of $800,000. * *
Key facts
- Hardwoods
- Large living room
- Feature rich kitchen
Tags
Neighborhood map
What this means for you Summary
Snapshot
- This is a 2-bed/1.0-bath single-family listed at $84k.
Deal economics
- At list price, monthly cash flow is $212 ($3k/yr) — positive.
- The deal already cash-flows at list — no discount required.
- Meets the 1% rule at list price ($921 rent vs $84k).
- Recommended offer: $74k (12.0% below list) — sets the bar for market timing.
- Cap rate 9.3% vs local median 6.0% in Montgomery — top-decile yield for the area; either an underpriced asset or a hidden risk that comps aren't pricing in. Stress-test before assuming the spread holds.
Location & tenants
- Location reads 65/100 on livability (#138 in AL) — a middle-class / working-renter tenant base. Strengths: cost of living A+, housing A+; Watch: employment D, crime F, amenities D-.
- Montgomery County (urban): math 9% / reading 31% proficiency, ranked #106 of 129 in AL (top 82%) — low school quality limits family demand, transient renter base, plan for 1-2y turnover; 70% free/reduced lunch — lower-income household profile, screen leases tightly.
- Zoned schools: Morningview Elementary School (math 0% / reading 15%, grade F, #598 of 627 statewide, top 96%, 448 students, 86% FRL); Capitol Heights Middle School (math 0% / reading 15%, grade F, #241 of 257 statewide, top 95%, 655 students, 97% FRL); Lee High School (math 2% / reading 8%, grade F, #276 of 305 statewide, top 95%, 1,374 students, 86% FRL) — zoned schools average 89% FRL vs 70% district-wide (19 pts higher); higher-poverty schools than district average — tighter screening recommended.
- Zoned-school proficiency averages 7% at this address vs 20% district-wide (-13 pts) — the specific schools serving this property underperform the Montgomery County average; the district grade overstates school quality for this exact location.
- Market conditions: Rents rising fast (+5.0%/yr); 67 active listings in the ZIP; 36 comparable units currently listed for rent nearby; rentals lingering (median 45d on market — plan ~5-8 weeks vacancy on turnover, expect pricing pressure); 67% of comp listings sitting > 30 days — soft ceiling on asking rent; lower-income renter base — watch delinquency; 460 units permitted in Montgomery County in 2024 (37 in 5+ unit buildings).
Forward outlook
- Local home prices are declining (-3.0%/yr); year-one equity from $581 of loan paydown is wiped out by about $3k of value loss. Plan a longer hold.
- Montgomery County population projected to shrink 8% by 2050 — rents likely to lag national; underwrite the cash flow, not the appreciation.
- At projected returns (-3.0% appreciation + 5.0% rent growth), your $24k cash investment doubles in ~9 years — after that, you're playing with house money.
Negotiation context
- It's been on market 124 days — a 12% lower offer ($74k) is reasonable based on typical stale-listing flexibility.
- 7 sale attempts since 23y ago; this cycle's ask has dropped $5k (6%) from the opening price — seller is motivated, your offer sets the floor, not the list.
Risks & watch-outs
- Watch-outs: built in 1930 — expect roof / HVAC / electrical / plumbing capex.
- Climate carrying-cost: severe wind risk, 80% chance of damaging wind over 30y; extreme-heat days projected 7→19/yr by 2055 (HVAC capex compounding) — expect insurance premiums to compound above CPI over the hold.
Questions for the listing agent
- It's been on market 124 days. Have you received any prior offers? Is the seller open to a 12% concession, seller financing, or rate buy-down credit?
- Built in 1930 — when were the roof, HVAC, electrical panel, plumbing, and water heater last replaced?
- Why hasn't it sold? Are there any deal-killer items the seller is aware of (foundation, flood, title, zoning, code violations)?
- Is there a deadline driving the sale (1031 exchange, divorce, estate, relocation)? That informs how much negotiation room exists.
- Crime grade is F in this area — have there been break-ins, vandalism, or insurance claims at this property in the last 3 years? What carrier currently insures it and at what premium?
- What's the average days-on-market for RENTAL listings here right now (not sales)? A rising rental-DOM trend means longer vacancies and softer asking-rent achievability than the comps imply.
- What's the recent tenant-quality profile in this submarket — average credit score on applications, eviction rate, late-payment / NSF rate, and stable-employment percentage? A property-management company in the area should have these aggregated.
- How much new for-sale + rental construction is in the pipeline within 1–3 miles? Heavy new supply typically softens prices + rents 12–24 months out; constrained supply supports both.
Investment metrics
- 1% rule
- 1.10% ✓
- Cap rate
- 9.32%
- Cash-on-cash
- 10.82%
- DSCR
- 1.48
- GRM
- 7.6
CMA / ARV
- ARV (median comp)
- $56,833
- List price
- $84,000
- Delta
- 47.80%
- Verdict
- OVERPRICED
- Comps
- 20 within 1.0 mi
Show comp detail 3 sales within ~0.75 mi
| Address | Dist | Beds/Ba | Sqft | Sold | Price | $/sf | Match |
|---|---|---|---|---|---|---|---|
| 2216 Mccarter Ave | 0.69mi | 2/1.0 | 937 (+9%) | 16mo | $77,000 | $82 | 39 |
| 344 Arthur St | 0.63mi | 3/1.0 (+1) | 933 (+9%) | 22mo | $50,000 | $54 | 33 |
| 2010 Greenville St | 0.71mi | 3/1.0 (+1) | 800 (-7%) | 23mo | $55,000 | $69 | 32 |
Match score weights: distance 35% · size 25% · config 20% · recency 20%. Top-matched comps best support the ARV.
Projected returns pro-forma
-3.0% appreciation · 5.05% rent growth · sell at horizon
- IRR
- 2.0%
- Equity multiple
- 1.08×
- Total profit
- $1,810
- Equity at exit
- $12,525
- IRR
- 13.3%
- Equity multiple
- 2.15×
- Total profit
- $27,160
- Equity at exit
- $7,263
Cash invested: $23,520 (down + closing). Projections, not guarantees.
Landlord ↔ Tenant lean methodology
- Overall (STATE)
- 90 Strongly Landlord-Friendly
- State Alabama
- 90 Strongly Landlord-Friendly · R+15
- County
- — inherits STATE
- City
- — inherits STATE
ZIP-level market 36107
- Home prices YoY
- -10.9%
- Rents YoY
- 5.0%
- Active inventory
- 67
- Price-to-rent
- 7.6×
Monthly cashflow live
- Estimated rent
- $921 high interval (Pro) →
- Mortgage (P&I)
- −$441
- Tax from tax record
- −$40 /mo · $478/yr
- Insurance
- −$35
- HOA
- −$0
- Vacancy / Maint / Mgmt
- −$193
- Net cashflow
- $212
Break-even live
Sensitivity live
| Price | -10% $260 | -5% $236 | +0% $212 | +5% $188 | +10% $165 |
|---|---|---|---|---|---|
| Rent | -10% $139 | -5% $176 | +0% $212 | +5% $248 | +10% $285 |
| Rate | -1.0pp $254 | -0.5pp $233 | base $212 | +0.5pp $190 | +1.0pp $168 |
UW: 25.0% down · 7.5% · 30yr · 1.5% tax · 5.0% vac · 8.0% maint · 8.0% mgmt
Financing live
Cash to close
- Down payment
- $21,000
- Closing costs
- $2,520
- Reserves months
- —
- Total cash needed
- —
Loan-product check · same deal, 3 products live
Conventional
25% down · 7.5% · 30yr
- Down + closing
- —
- Monthly P&I
- —
- Monthly cashflow
- —
- DSCR
- —
- Eligible?
- —
Personal DTI + credit; lowest rate.
DSCR
20% down · 8.5% · 30yr
- Down + closing
- —
- Monthly P&I
- —
- Monthly cashflow
- —
- DSCR
- —
- Eligible?
- —
No personal income docs; deal must DSCR.
Hard money
10% down · 12.0% · 12mo
- Down + closing
- —
- Monthly P&I
- —
- Monthly cashflow
- —
- DSCR
- —
- Eligible?
- —
Short-term bridge; refi at stabilization.
Rent comps 36 comps
| Address | Beds | Baths | Sqft | Rent | $/sqft | DOM | Units | Dist |
|---|---|---|---|---|---|---|---|---|
| 116 N Lewis St Montgomery, AL | 1.0 | 1.0 | 690 | $875 | $1.27 | 45d | 1 | 0.05mi |
| 1530 Saint Charles Ave Unit B Montgomery, AL | 1.0 | 1.0 | 725 | $775 | $1.07 | 45d | 1 | 0.14mi |
| 1510 Yancey Ave Unit B Montgomery, AL | 1.0 | 1.0 | 650 | $725 | $1.12 | 45d | 1 | 0.14mi |
| 1517 Madison Ave Montgomery, AL | 1.0 | 1.0 | 1044 | $650 | $0.62 | 45d | 1 | 0.19mi |
| 1517 Madison Ave Montgomery, AL | 1.0 | 1.0 | 1044 | $650 | $0.62 | 22d | 1 | 0.19mi |
| 1415 Madison Ave Apt E Montgomery, AL | 2.0 | 1.0 | 825 | $1,095 | $1.33 | 15d | 1 | 0.25mi |
| 424 N California St Apt D Montgomery, AL | 2.0 | 1.0 | 850 | $778 | $0.92 | 22d | 1 | 0.33mi |
| 1827 Capitol Ave Montgomery, AL | 2.0 | 1.0 | 1068 | $1,600 | $1.50 | 45d | 1 | 0.34mi |
| 1827 Capitol Ave Montgomery, AL | 2.0 | 1.0 | 1068 | $1,600 | $1.50 | 15d | 1 | 0.34mi |
| 517 N Florida St Unit B Montgomery, AL | 2.0 | 1.0 | 900 | $750 | $0.83 | 45d | 1 | 0.41mi |
| 2023 Windsor Ave Montgomery, AL | 2.0 | 1.0 | 889 | $895 | $1.01 | 45d | 1 | 0.47mi |
| 329 S Capitol Pkwy Apt A Montgomery, AL | 1.0 | 1.0 | 800 | $645 | $0.81 | 45d | 1 | 0.51mi |
| 2121 Winona Ave Unit 2123 Montgomery, AL | 1.0 | 1.5 | 828 | $995 | $1.20 | 15d | 1 | 0.52mi |
| 2122 Windsor Ave Montgomery, AL | 2.0 | 1.0 | 1052 | $725 | $0.69 | 45d | 1 | 0.55mi |
| 2229 Madison Ave Montgomery, AL | 2.0 | 1.0 | 1100 | $625 | $0.57 | 45d | 1 | 0.66mi |
| 2241 Saint Charles Ave Unit 2247 Montgomery, AL | 1.0 | 1.0 | 915 | $1,475 | $1.61 | 45d | 1 | 0.67mi |
| 1834 Highland Ave Unit A Montgomery, AL | 1.0 | 1.0 | 980 | $1,250 | $1.28 | 45d | 1 | 0.78mi |
| 2405 Palmetto St Unit B Montgomery, AL | 1.0 | 1.0 | 550 | $750 | $1.36 | 15d | 1 | 0.84mi |
| 2006 Harmon St Unit 3 Montgomery, AL | 3.0 | 1.0 | 800 | $500 | $0.62 | 45d | 1 | 0.93mi |
| 2503 Skyline Ave Montgomery, AL | 3.0 | 1.0 | 1015 | $1,150 | $1.13 | 45d | 1 | 0.94mi |
| 2302 Plum St Montgomery, AL | 1.0 | 1.0 | 656 | $700 | $1.07 | 15d | 1 | 0.94mi |
| 2000 Cherry St Montgomery, AL | 2.0 | 1.0 | 1106 | $950 | $0.86 | 45d | 1 | 0.94mi |
| 2300 Plum St Unit 2302 Montgomery, AL | 1.0 | 1.0 | 656 | $700 | $1.07 | 15d | 1 | 0.95mi |
| 319 Olivia Ct Montgomery, AL | 2.0 | 1.0 | 850 | $700 | $0.82 | 22d | 1 | 1.10mi |
| 7 Calhoun Rd Unit B Montgomery, AL | 2.0 | 1.0 | 961 | $850 | $0.88 | 45d | 1 | 1.10mi |
| 122 Oak Forest Dr Montgomery, AL | 3.0 | 1.0 | 1092 | $975 | $0.89 | 22d | 1 | 1.17mi |
| 301 Bradley Dr Montgomery, AL | 2.0 | 1.0 | 841 | $935 | $1.11 | 15d | 1 | 1.20mi |
| 311 Bradley Dr Montgomery, AL | 3.0 | 1.0 | 1104 | $825 | $0.75 | 45d | 1 | 1.22mi |
| 80 Turner Pl Unit 14 Montgomery, AL | 2.0 | 1.0 | 620 | $750 | $1.21 | 45d | 1 | 1.25mi |
| 1324 Federal Dr Montgomery, AL | 2.0 | 1.0 | 1000 | $1,100 | $1.10 | 45d | 1 | 1.25mi |
| 215 N Court St Unit 06 Montgomery, AL | 1.0 | 1.0 | 695 | $1,315 | $1.89 | 45d | 1 | 1.37mi |
| 215 N Court St Unit 04 Montgomery, AL | 1.0 | 1.0 | 927 | $1,570 | $1.69 | 45d | 1 | 1.37mi |
| 1732 West St Unit 1732 A Montgomery, AL | 1.0 | 1.0 | 715 | $1,375 | $1.92 | 45d | 1 | 1.44mi |
| 1817 Texas Ct Montgomery, AL | 3.0 | 1.0 | 925 | $1,050 | $1.14 | 22d | 1 | 1.46mi |
| 2056 Midway St Montgomery, AL | 3.0 | 1.0 | 1110 | $985 | $0.89 | 45d | 1 | 1.48mi |
| 2076 Midway St Montgomery, AL | 3.0 | 1.0 | 1068 | $1,000 | $0.94 | 45d | 1 | 1.50mi |
Listing history 26 events
-
2026-06-21days on market $84,000 Active 124 DOM
-
2026-06-18days on market $84,000 Active 121 DOM
-
2026-06-17days on market $84,000 Active 120 DOM
-
2026-06-16days on market $84,000 Active 119 DOM
-
2026-06-15days on market $84,000 Active 118 DOM
-
2026-06-14days on market $84,000 Active 116 DOM
-
2026-06-13pricedays on market $84,000 Active 115 DOM
-
2026-06-10days on market $89,000 Active 113 DOM
-
2026-06-09days on market $89,000 Active 112 DOM
-
2026-06-08days on market $89,000 Active 111 DOM
-
2026-06-07days on market $89,000 Active 110 DOM
-
2026-06-03days on market $89,000 Active 106 DOM
-
2026-06-02days on market $89,000 Active 105 DOM
-
2026-06-01days on market $89,000 Active 104 DOM
-
2026-05-31days on market $89,000 Active 103 DOM
-
2026-05-30days on market $89,000 Active 102 DOM
-
2026-02-21historical $875
-
2026-02-17$89,000 Active 817-char remark
Show marketing remark (817 chars)
A Great Value-Add Opportunity Near Downtown Montgomery. Investors??? Ready. .. Set. .. GO! Nearly 1000 Sq Ft Of Advantageous Hardwoods Will Navigate You Throughout This Well-Maintained 2 Bedroom/1 Bath Floorplan. Presenting A Large Living Room That's Ideal For Family Gatherings-And A Feature Rich Kitchen And Dining Space For Convenience And Purposeful Dining! This Charming Cottage Is A Definitive Staple In The Historic District And A Perfect Fit For You! Schedule Your Showing Today- Please Verify Any Pertinent Info. Conveniently Located Near Thriving Downtown Montgomery. * * This Property Can Also Be Purchased Along With 122 S Capitol Pkwy, 404 S Capitol Pkwy, 2106 Capitol Ave, 2134 Winona Ave, 2040 Mckinely Ave, And 690 Ponce De Leon Ave-All Or In Part At A Total Portfolio Package Price Of $800,000. * *
-
2026-01-25$875
-
2025-01-25historical $875
-
2024-12-31$875
-
2024-08-19historical $850
-
2024-08-03$850
-
2013-09-26$73,000
-
2008-04-23$78,860
-
2003-08-05$49,900
ⓘ Source: listings_history table (triggers on properties + properties_extension) + one-shot
backfill from property_details.listing_events for pre-trigger history.
Tax reassessment forecast AL · Resets to sale price
- Current annual tax
- $478 · $40/mo
- Projected year-2 tax
- $478 · $40/mo
- Expected delta
- $0/yr ($0/mo · 0.0%)
ⓘ Screening estimate from a state-policy table — verify with the county assessor before closing.
Climate risk First Street
- Flood 1/10 Low FEMA zone X (unshaded) · 0% chance over 30 yrs
- Wildfire 3/10 Moderate
- Heat 7/10 Severe 7 d/yr ≥107°F today · 19 d/yr by 30 yrs out
- Wind 8/10 Severe 80% chance of damaging wind over 30 yrs
- Air quality 3/10 Moderate 4 unhealthy d/yr today · 4 by 30 yrs out
Nearby sold comps map
Loading sold comps map…
Walkable amenities ~0.75 mi
Loading nearby amenities…
Taxation est. · year 1
- Rental income
- $11,050
- − Mortgage interest
- −$4,705
- − Property taxes
- −$478
- − Insurance
- −$420
- − Repairs & maintenance
- −$884
- − Management
- −$884
- − Depreciation
- −$2,444
- Taxable income
- $1,235
- Est. tax owed @ 24.0%
- −$296
- After-tax cash flow
- $2,249/yr
For passive investors: Depreciation is non-cash, so a rental often shows a tax loss while cash-flowing — sheltering income. Rental losses are passive: they offset passive income freely, and up to $25,000/yr can offset ordinary (W-2) income if you actively participate and your MAGI is under $100k (phasing out to $0 by $150k); unused losses carry forward. On sale, claimed depreciation is recaptured at up to 25%, and gains may owe capital-gains tax (a 1031 exchange can defer both). Figures are a year-1 estimate at your 24.0% rate — not tax advice; consult a CPA.
Schools (NCES district)
- District
- Montgomery County
- NCES district ID
- 0102430
- Math proficiency
- 9% ▼ -21.00%
- Reading proficiency
- 31% ▼ -1.00%
- Median HH income
- $43,902
- Composite
- 17.24/100
- National rank
- #9093
- State rank
- #106 of 129 in AL
Livability — Montgomery
- Score
- 65/100
- State rank
- #138
- US rank
- #13416
Category grades
Schools grade is shown separately in the Schools card above.
Census & demographics
- Census place
- Montgomery, AL
- County
- Montgomery County · 190,016 people
- City population
- 175,913
- Metro
- Montgomery, AL
- Population (ZIP)
- 8,001
- Household income
- $32,492
- Rent vs Own
- Severe rent burden
- 642.0
Population outlook (Montgomery County) Hauer SSP2
- Today (2025)
- 224,008 people
- By 2030
- 221,460 · -1.1%
- By 2040
- 214,179 · -4.4%
- By 2050
- 204,912 · -8.5%
- By 2075
- 177,821 · -20.6%
- By 2100
- 145,134 · -35.2%
Race, ethnicity, and origin ACS 2023
- Neighborhood character
- Diverse neighborhood (Simpson 0.69)
- Race & ethnicity
- Black 43% White 27% Hispanic / Latino 23% Two or more races 20%
- Hispanic origin (detail)
- Mexican 8% Cuban 3%
- Common ancestry
- Slovak 1% Iranian 1% Serbian 1%
- Foreign-born
- 11% · Canada
- Languages at home
- 83% English-only · Spanish 13%
Political lean MEDSL · Montgomery
- 2024 margin
- Solid D (+30.7) · D 64.8% · R 34.1% · Other 1.1%
- 2008→2024 swing
- +11.5pp toward D · 2008: 19.2pp · 2024: 30.7pp
- All cycles
- 2024: D+30.7 2020: D+31.5 2016: D+26.2 2012: D+24.3 2008: D+19.2
Not yet ingested
- Civics
- —
Market trends
- HPI YoY
- ▼ -18.16%
- Current HPI
- 147.8065
- Rent YoY
- ▲ 5.05%
- Metro
- Montgomery, AL
- State GDP YoY
- ▲ 2.94%
- F500 in state
- 4
Industry mix (Fortune 500 HQ in AL)
| Industry | F500 HQs | Revenue |
|---|---|---|
| Financial Services | 1 | $8B |
|
||
| Healthcare | 1 | $5B |
|
||
Price history
+78.4% since first listed10 events — show timeline
- 2026-02-21 Rental Removed $875 SHOWMOJO
- 2026-02-17 Listed $89,000 MAAR
- 2026-01-25 Listed for Rent $875 SHOWMOJO
- 2025-01-25 Rental Removed $875 SHOWMOJO
- 2024-12-31 Listed for Rent $875 SHOWMOJO
- 2024-08-19 Rental Removed $850 SHOWMOJO
- 2024-08-03 Listed for Rent $850 SHOWMOJO
- 2013-09-26 Listed $73,000 MAAR
- 2008-04-23 Listed $78,860 MAAR
- 2003-08-05 Listed $49,900 MAAR
Property tax history
+5.1%/yrLatest (2025): $478 · -16.3% YoY. Source: county tax records.
Cash-flow waterfall
monthlySold comps — $/sqft
last 12 mo · ≤1 miLoading sold comps…