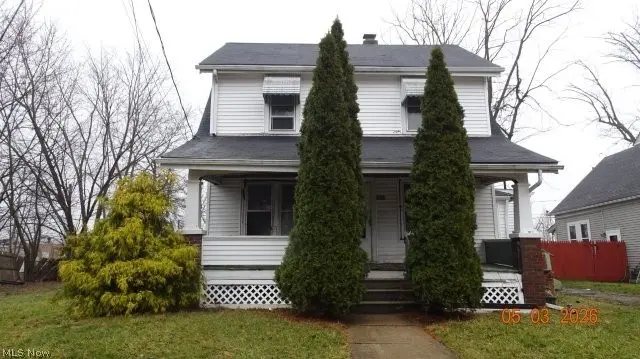
2353 Livingston · Lorain, OH
Flood risk 3/10 · Minor
- FEMA flood zone
- X (unshaded)
- Chance of flooding over 30 yrs
- 0.1%
- Est. flood insurance / yr
- $473 – $860
Fire risk 1/10 · Minimal
- Est. fire insurance / yr
- $713 – $1,323
Heat risk 3/10 · Minor
- Hot days now (above 97°F)
- 7 days/yr
- Hot days in 30 yrs
- 16 days/yr
Wind risk 1/10 · Minimal
- Chance of severe wind over 30 yrs
- —
Air-quality risk 3/10 · Minor
- Unhealthy air days now
- 3 days/yr
- Unhealthy air days in 30 yrs
- 4 days/yr
Risk factors via First Street. Map © Google.
Why this score? — see what drove the B- grade
The composite is a weighted blend of 9 inputs, each scored 0–100. Each bar is that input's sub-score; the figure is the points it added to the 100-point composite (weight × sub-score).
- Cash flow +30.0/30.0
- 1% rule +10.0/10.0
- DSCR +10.0/10.0
- ARV discount +7.5/15.0
- Rent growth +3.5/5.0
- Livability +3.4/5.0
- Condition / age +2.5/5.0
- Schools +1.6/10.0
- Appreciation +0.0/10.0
$49,900
🖨 Deal sheet (PDF) 📄 Offer letter ✓ Due diligence
Listing remarks MLS
Each Has Own Furnace * Separate Entrance For Bsmt * Owner Only Pays Garbage & Water Quiet Dead-end St * Frt Apt/3br-bk Apt/2br
Key facts
- 6,098 sq ft lot
- Parking
- Built 1923
Neighborhood map
What this means for you Summary
Snapshot
- This is a 5-bed/2.0-bath single-family listed at $50k.
Deal economics
- At list price, monthly cash flow is $938 ($11k/yr) — positive.
- The deal already cash-flows at list — no discount required.
- Meets the 1% rule at list price ($2k rent vs $50k).
- Recommended offer: $47k (6.0% below list) — sets the bar for market timing.
- Cap rate 28.9% vs local median 5.9% in Lorain — top-decile yield for the area; either an underpriced asset or a hidden risk that comps aren't pricing in. Stress-test before assuming the spread holds.
Location & tenants
- Location reads 67/100 on livability (#595 in OH) — a middle-class / working-renter tenant base. Strengths: cost of living A+, housing A+; Watch: schools C-, amenities D, health & safety D.
- Lorain City (suburban): math 13% / reading 26% proficiency, ranked #633 of 656 in OH (top 96%) — low school quality limits family demand, transient renter base, plan for 1-2y turnover; 80% free/reduced lunch — lower-income household profile, screen leases tightly.
- Market conditions: Rents rising fast (+4.1%/yr); 129 active listings in the ZIP; 9 comparable units currently listed for rent nearby; rentals at typical pace (median 24d on market — plan ~3-4 weeks tenant-placement turnaround); 44% of comp listings sitting > 30 days — soft ceiling on asking rent; 1,098 units permitted in Lorain County in 2024 (20 in 5+ unit buildings).
- At $1,706/mo this rent would consume 45% of the median local household income ($45k/yr) (locally 1423% of renters already pay >50% of income on rent) — very limited rent-growth headroom before tenants either downsize or default.
Forward outlook
- Local home prices are declining (-3.0%/yr); year-one equity from $345 of loan paydown is wiped out by about $1k of value loss. Plan a longer hold.
- At projected returns (-3.0% appreciation + 4.1% rent growth), your $14k cash investment doubles in ~2 years — after that, you're playing with house money.
Negotiation context
- It's been on market 81 days — a 6% lower offer ($47k) is reasonable based on typical stale-listing flexibility.
- 3 sale attempts since 33y ago with the ask held roughly flat each time — persistent listings suggest the price (not the market) is what's stuck; bring a comps-based counter.
Risks & watch-outs
- Watch-outs: property tax is 3.1% of price; built in 1923 — expect roof / HVAC / electrical / plumbing capex.
Questions for the listing agent
- It's been on market 81 days. Have you received any prior offers? Is the seller open to a 6% concession, seller financing, or rate buy-down credit?
- Built in 1923 — when were the roof, HVAC, electrical panel, plumbing, and water heater last replaced?
- Property tax is high relative to price — has the assessment been appealed recently, and will the sale trigger a re-assessment?
- Why hasn't it sold? Are there any deal-killer items the seller is aware of (foundation, flood, title, zoning, code violations)?
- Is there a deadline driving the sale (1031 exchange, divorce, estate, relocation)? That informs how much negotiation room exists.
- Crime grade is F in this area — have there been break-ins, vandalism, or insurance claims at this property in the last 3 years? What carrier currently insures it and at what premium?
- What's the average days-on-market for RENTAL listings here right now (not sales)? A rising rental-DOM trend means longer vacancies and softer asking-rent achievability than the comps imply.
- What's the recent tenant-quality profile in this submarket — average credit score on applications, eviction rate, late-payment / NSF rate, and stable-employment percentage? A property-management company in the area should have these aggregated.
- How much new for-sale + rental construction is in the pipeline within 1–3 miles? Heavy new supply typically softens prices + rents 12–24 months out; constrained supply supports both.
Investment metrics
- 1% rule
- 3.42% ✓
- Cap rate
- 28.86%
- Cash-on-cash
- 80.60%
- DSCR
- 4.59
- GRM
- 2.4
CMA / ARV
- ARV (median comp)
- $121,375
- List price
- $49,900
- Delta
- -58.89%
- Verdict
- UNDERPRICED
- Comps
- 20 within 1.0 mi
Show comp detail 6 sales within ~0.75 mi
| Address | Dist | Beds/Ba | Sqft | Sold | Price | $/sf | Match |
|---|---|---|---|---|---|---|---|
| 1853 Garden Ave | 0.39mi | 6/2.0 (+1) | 2,056 (+4%) | 10mo | $55,000 | $27 | 62 |
| 413 W 28th St | 0.35mi | 4/2.0 (-1) | 2,036 (+3%) | 19mo | $158,000 | $78 | 58 |
| 512 W 24th St | 0.26mi | 4/1.0 (-1) | 1,920 (-3%) | 19mo | $140,000 | $73 | 58 |
| 2910 Park Dr | 0.57mi | 4/2.0 (-1) | 1,929 (-3%) | 22mo | $175,500 | $91 | 46 |
| 1504 Lexington Ave | 0.57mi | 5/2.0 | 2,246 (+13%) | 11mo | $160,000 | $71 | 42 |
| 3404 Broadway | 0.67mi | 4/2.5 (-1) | 2,092 (+6%) | 16mo | $160,000 | $76 | 40 |
Match score weights: distance 35% · size 25% · config 20% · recency 20%. Top-matched comps best support the ARV.
Projected returns pro-forma
-3.0% appreciation · 4.09% rent growth · sell at horizon
- IRR
- 82.1%
- Equity multiple
- 4.84×
- Total profit
- $53,643
- Equity at exit
- $7,440
- IRR
- 85.8%
- Equity multiple
- 10.44×
- Total profit
- $131,878
- Equity at exit
- $4,314
Cash invested: $13,972 (down + closing). Projections, not guarantees.
Landlord ↔ Tenant lean methodology
- Overall (STATE)
- 73 Landlord-Friendly
- State Ohio
- 73 Landlord-Friendly · R+6
- County
- — inherits STATE
- City
- — inherits STATE
ZIP-level market 44052
- Home prices YoY
- -28.1%
- Rents YoY
- 4.1%
- Active inventory
- 129
- Price-to-rent
- 2.4×
Monthly cashflow live
- Estimated rent
- $1,706 high interval (Pro) →
- Mortgage (P&I)
- −$262
- Tax from tax record
- −$127 /mo · $1,522/yr
- Insurance
- −$21
- HOA
- −$0
- Vacancy / Maint / Mgmt
- −$358
- Net cashflow
- $938
Break-even live
Sensitivity live
| Price | -10% $967 | -5% $953 | +0% $938 | +5% $924 | +10% $910 |
|---|---|---|---|---|---|
| Rent | -10% $804 | -5% $871 | +0% $938 | +5% $1,006 | +10% $1,073 |
| Rate | -1.0pp $964 | -0.5pp $951 | base $938 | +0.5pp $926 | +1.0pp $912 |
UW: 25.0% down · 7.5% · 30yr · 1.5% tax · 5.0% vac · 8.0% maint · 8.0% mgmt
Financing live
Cash to close
- Down payment
- $12,475
- Closing costs
- $1,497
- Reserves months
- —
- Total cash needed
- —
Loan-product check · same deal, 3 products live
Conventional
25% down · 7.5% · 30yr
- Down + closing
- —
- Monthly P&I
- —
- Monthly cashflow
- —
- DSCR
- —
- Eligible?
- —
Personal DTI + credit; lowest rate.
DSCR
20% down · 8.5% · 30yr
- Down + closing
- —
- Monthly P&I
- —
- Monthly cashflow
- —
- DSCR
- —
- Eligible?
- —
No personal income docs; deal must DSCR.
Hard money
10% down · 12.0% · 12mo
- Down + closing
- —
- Monthly P&I
- —
- Monthly cashflow
- —
- DSCR
- —
- Eligible?
- —
Short-term bridge; refi at stabilization.
Rent comps 9 comps
| Address | Beds | Baths | Sqft | Rent | $/sqft | DOM | Units | Dist |
|---|---|---|---|---|---|---|---|---|
| 704 W 21st St Lorain, OH | 4.0 | 1.0 | 1410 | $1,450 | $1.03 | 24d | 1 | 0.40mi |
| 200 E 31st St Lorain, OH | 5.0 | 2.0 | 1562 | $1,550 | $0.99 | 2d | 1 | 0.50mi |
| 930 W 18th St Lorain, OH | 4.0 | 1.0 | 1344 | $1,450 | $1.08 | 44d | 1 | 0.68mi |
| 640 W 13th St Lorain, OH | 6.0 | 2.0 | 1920 | $2,041 | $1.06 | 4d | 1 | 0.71mi |
| 1037 Washington Ave Lorain, OH | 4.0 | 2.0 | 1567 | $1,600 | $1.02 | 17d | 1 | 0.93mi |
| 760 W 9th St Lorain, OH | 4.0 | 2.0 | 1987 | $1,600 | $0.81 | 44d | 1 | 1.00mi |
| 1220 W 19th St Lorain, OH | 4.0 | 1.0 | 1492 | $1,550 | $1.04 | 24d | 1 | 1.03mi |
| 1322 Brownell Ave Lorain, OH | 4.0 | 1.0 | 1571 | $1,570 | $1.00 | 44d | 1 | 1.20mi |
| 1413 W 12th St Lorain, OH | 4.0 | 1.5 | 1725 | $1,700 | $0.99 | 44d | 1 | 1.35mi |
Listing history 12 events
-
2026-06-07statusdays on market $49,900 Pending 81 DOM
-
2026-06-03days on market $49,900 Active 79 DOM
-
2026-06-02days on market $49,900 Active 78 DOM
-
2026-06-01days on market $49,900 Active 77 DOM
-
2026-05-31days on market $49,900 Active 76 DOM
-
2026-05-01status Active
-
2026-04-21historical Contingent
-
2026-03-12$49,900 Active
-
2004-10-05soldstatus $62,275
-
1993-09-17soldstatus $39,000 132-char remark
Show marketing remark (132 chars)
Each Has Own Furnace * Separate Entrance For Bsmt * Owner Only Pays Garbage & Water Quiet Dead-end St * Frt Apt/3br-bk Apt/2br
-
1993-09-16soldstatus $39,000
-
1993-05-29$42,900 132-char remark
Show marketing remark (132 chars)
Each Has Own Furnace * Separate Entrance For Bsmt * Owner Only Pays Garbage & Water Quiet Dead-end St * Frt Apt/3br-bk Apt/2br
ⓘ Source: listings_history table (triggers on properties + properties_extension) + one-shot
backfill from property_details.listing_events for pre-trigger history.
Tax reassessment forecast OH · Partial reset (capped growth)
- Current annual tax
- $1,522 · $127/mo
- Projected year-2 tax
- $1,522 · $127/mo
- Expected delta
- $0/yr ($0/mo · 0.0%)
ⓘ Screening estimate from a state-policy table — verify with the county assessor before closing.
Climate risk First Street
- Flood 3/10 Moderate FEMA zone X (unshaded) · 10% chance over 30 yrs
- Wildfire 1/10 Low
- Heat 3/10 Moderate 7 d/yr ≥97°F today · 16 d/yr by 30 yrs out
- Wind 1/10 Low
- Air quality 3/10 Moderate 3 unhealthy d/yr today · 4 by 30 yrs out
Nearby sold comps map
Loading sold comps map…
Walkable amenities ~0.75 mi
Loading nearby amenities…
Taxation est. · year 1
- Rental income
- $20,473
- − Mortgage interest
- −$2,795
- − Property taxes
- −$1,522
- − Insurance
- −$250
- − Repairs & maintenance
- −$1,638
- − Management
- −$1,638
- − Depreciation
- −$1,452
- Taxable income
- $11,179
- Est. tax owed @ 24.0%
- −$2,683
- After-tax cash flow
- $8,579/yr
For passive investors: Depreciation is non-cash, so a rental often shows a tax loss while cash-flowing — sheltering income. Rental losses are passive: they offset passive income freely, and up to $25,000/yr can offset ordinary (W-2) income if you actively participate and your MAGI is under $100k (phasing out to $0 by $150k); unused losses carry forward. On sale, claimed depreciation is recaptured at up to 25%, and gains may owe capital-gains tax (a 1031 exchange can defer both). Figures are a year-1 estimate at your 24.0% rate — not tax advice; consult a CPA.
Schools (NCES district)
- District
- Lorain City
- NCES district ID
- 3904426
- Math proficiency
- 13% ▼ -24.00%
- Reading proficiency
- 26% ▼ -10.00%
- Median HH income
- $32,823
- Composite
- 15.81/100
- National rank
- #9266
- State rank
- #633 of 656 in OH
Livability — Lorain
- Score
- 67/100
- State rank
- #595
- US rank
- #10183
Category grades
Schools grade is shown separately in the Schools card above.
Census & demographics
- Census place
- Lorain, OH
- County
- Lorain County · 219,437 people
- City population
- 69,409
- Metro
- Cleveland-Elyria, OH
- Population (ZIP)
- 28,282
- Household income
- $45,023
- Rent vs Own
- Severe rent burden
- 1423.0
Population outlook (Lorain County) Hauer SSP2
- Today (2025)
- 314,924 people
- By 2030
- 317,546 · +0.8%
- By 2040
- 317,962 · +1.0%
- By 2050
- 312,872 · -0.7%
- By 2075
- 301,806 · -4.2%
- By 2100
- 278,271 · -11.6%
Race, ethnicity, and origin ACS 2023
- Neighborhood character
- Diverse neighborhood (Simpson 0.66)
- Race & ethnicity
- White 49% Hispanic / Latino 24% Black 21% Two or more races 16%
- Hispanic origin (detail)
- Mexican 5% Puerto Rican 17%
- Common ancestry
- Romanian 6% Lithuanian 1% Iranian 1%
- Foreign-born
- 3% · Canada, Vietnam
- Languages at home
- 84% English-only · Spanish 14%
Political lean MEDSL · Lorain
- 2024 margin
- Lean R (+5.7) · D 46.7% · R 52.4%
- 2008→2024 swing
- -23.6pp toward R · 2008: 17.9pp · 2024: -5.7pp
- All cycles
- 2024: R+5.7 2020: R+2.5 2016: R+0.3 2012: D+14.4 2008: D+17.9
Not yet ingested
- Civics
- —
Market trends
- HPI YoY
- ▼ -73.23%
- Current HPI
- 186.9657
- Rent YoY
- ▲ 4.09%
- Metro
- Cleveland-Elyria, OH
- State GDP YoY
- ▲ 1.98%
- F500 in state
- 48
Industry mix (Fortune 500 HQ in OH)
| Industry | F500 HQs | Revenue |
|---|---|---|
| Insurance | 3 | $145B |
|
||
| Industrial Machinery | 3 | $49B |
|
||
| Financial Services | 3 | $24B |
|
||
| Consumer Goods | 2 | $93B |
|
||
| Aerospace / Defense | 2 | $47B |
|
||
| Utilities | 2 | $33B |
|
||
Price history
+16.3% since first listed7 events — show timeline
- 2026-05-01 Relisted — MLSNOW
- 2026-04-21 Contingent — MLSNOW
- 2026-03-12 Listed $49,900 MLSNOW
- 2004-10-05 Sold (Public Records) $62,275 Public Records
- 1993-09-17 Sold (MLS) $39,000 MLSNOW
- 1993-09-16 Sold (Public Records) $39,000 Public Records
- 1993-05-29 Listed $42,900 MLSNOW
Property tax history
+1.3%/yrLatest (2025): $1,522 · -4.9% YoY. Source: county tax records.
Cash-flow waterfall
monthlySold comps — $/sqft
last 12 mo · ≤1 miLoading sold comps…