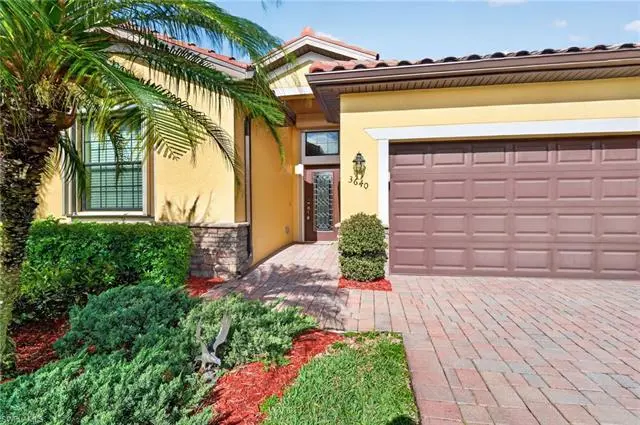
3640 Treasure Cove Cir · Winding Cypress, FL
Flood risk 8/10 · Major
- FEMA flood zone
- AE
- Chance of flooding over 30 yrs
- 0.99%
- Est. flood insurance / yr
- $1,737 – $8,500
Fire risk 4/10 · Minor
- Est. fire insurance / yr
- $947 – $1,759
Heat risk 10/10 · Severe
- Hot days now (above 108°F)
- 7 days/yr
- Hot days in 30 yrs
- 30 days/yr
Wind risk 10/10 · Severe
- Chance of severe wind over 30 yrs
- 99.0%
Air-quality risk 3/10 · Minor
- Unhealthy air days now
- 3 days/yr
- Unhealthy air days in 30 yrs
- 3 days/yr
Risk factors via First Street. Map © Google.
Why this score? — see what drove the B- grade
The composite is a weighted blend of 9 inputs, each scored 0–100. Each bar is that input's sub-score; the figure is the points it added to the 100-point composite (weight × sub-score).
- Cash flow +25.4/30.0
- DSCR +8.4/10.0
- ARV discount +7.5/15.0
- 1% rule +6.3/10.0
- Schools +5.0/10.0
- Appreciation +4.3/10.0
- Rent growth +3.3/5.0
- Livability +2.5/5.0
- Condition / age +2.5/5.0
$575,000
🖨 Deal sheet 📄 Offer letter ✓ Due diligence
Listing remarks
STUNNING "COPPER COVE" UPGRADED ($100,000+/-) FURNISHED 3 BEDROOM, DEN, 3 BATH, 2 CAR GARAGE FAMILY HOME. This is a ABSOLUTE must-see home that blends AFFORDABILITY, VALUE, comfort, privacy, and Southwest Florida style in the desirable LOW HOA FEE Community. This HOME features a highly desirable split-bedroom floor plan offering 3 bedrooms, den and 3 full bathrooms, including two MASTER BEDROOMS, each with its own private en-suite—ideal for multi-generational living, DUAL OWNERSHIP, guests or a great seasonal retreat. VAULTED CEILINGS, crown molding throughout, tile flooring in all main areas, lots of glass windows and 8' sliders, makes the home LIGHT-BRIGHT-SUNNY year round
Key facts
- Level 5 granite tops
- Wood cabinetry
- Granite countertops
Tags
Property features AI
Finance
- Other: Part of a community with 217 units; building contains a single unit and the development has one floor; Possession at closing
- HOA & community: Mandatory HOA; Quarterly master HOA fee; Professional management; Community amenities include bike and jog path, sidewalks, streetlights and underground utilities; Maintenance covered: cable, internet/Wi‑Fi, irrigation water, lawn/land maintenance, legal/accounting, manager, reserves, street lights and street maintenance; Total annual recurring fees listed
Exterior
- Parking: Attached 2-car garage
- Security: Gated community; Electric and manual shutters
- Utilities: Central water; Central sewer; Cable available
- Home design: Single-family residence; One-story ranch; Corner property; West rear exposure; Residential property in Copper Cove Preserve
- Construction: Built in 2014; Concrete block construction; Stucco exterior; Tile roof; Single-hung, sliding and transom windows
- Exterior features: Patio; Pond/ lake view; Irrigation from lake/canal; Corner lot; Irregular-shaped lot; Lakefront/pond setting
Interior
- Kitchen: Island; Walk-in pantry; Cooktop (electric); Dishwasher; Disposal; Microwave; Self-cleaning oven; Refrigerator/freezer; Refrigerator with icemaker; Breakfast bar; Dining area open to family room
- Bedrooms: 3 bedrooms plus den; First-floor bedroom; Master bedroom on ground level; Split bedroom plan; Two master suites
- Flooring: Brick; Carpet; Tile
- Bathrooms: 3 full bathrooms; Master baths with dual sinks; Master baths with separate tub and shower; Combo tub and shower
- Heating & cooling: Central electric heat; Central electric air conditioning; Ceiling fans
- Interior features: Built-in cabinets; Cable prewire; High-speed internet available; Pantry; Smoke detectors; Walk-in closet; Window coverings; Den (study); Great room; Guest bath; Guest room; Screened lanai/porch
- Laundry & utility: Laundry in residence; Washer; Dryer; Auto garage door
Neighborhood map
What this means for you Summary
Snapshot
- This is a 3-bed/3.0-bath single-family listed at $575k.
Deal economics
- At list price, monthly cash flow is $903 ($11k/yr) — positive.
- The deal already cash-flows at list — no discount required.
- Meets the 1% rule at list price ($7k rent vs $575k).
- Recommended offer: $558k (3.0% below list) — sets the bar for market timing.
Location & tenants
- Location reads: area grade B — affects rentability + tenant quality, not the cash-flow math above.
- Collier (suburban): math 60% / reading 56% proficiency, ranked #16 of 73 in FL (top 22%) — acceptable for families but not a draw, mixed tenant base, ~2y average lease.
- Market conditions: Rents rising (+3.2%/yr); 900 active listings in the ZIP; 40 comparable units currently listed for rent nearby; rentals at typical pace (median 24d on market — plan ~3-4 weeks tenant-placement turnaround); solid renter incomes; 3,520 units permitted in Collier County in 2024 (959 in 5+ unit buildings).
- At $6,510/mo this rent would consume 87% of the median local household income ($89k/yr) (locally 550% of renters already pay >50% of income on rent) — very limited rent-growth headroom before tenants either downsize or default.
Forward outlook
- Local home prices are declining (-1.5%/yr); year-one equity from $4k of loan paydown is wiped out by about $9k of value loss. Plan a longer hold.
- Collier County population projected at +30% by 2050 — long-run rental-demand tailwind backs the buy-and-hold thesis.
- At projected returns (-1.5% appreciation + 3.2% rent growth), your $161k cash investment doubles in ~10 years — after that, you're playing with house money.
Negotiation context
- It's been on market 45 days — a 3% lower offer ($558k) is reasonable based on typical stale-listing flexibility.
- 7 sale attempts since 12y ago with the ask held roughly flat each time — persistent listings suggest the price (not the market) is what's stuck; bring a comps-based counter.
- Current owner paid $286k; list at $575k implies a 101% gain — meaningful room to come down on a strong offer.
Risks & watch-outs
- Watch-outs: flood insurance adds $427/mo.
- Climate carrying-cost: in FEMA flood zone AE (mandatory federal flood insurance); severe wind risk, 99% chance of damaging wind over 30y; extreme-heat days projected 7→30/yr by 2055 (HVAC capex compounding) — expect insurance premiums to compound above CPI over the hold.
Questions for the listing agent
- It's been on market 45 days. Have you received any prior offers? Is the seller open to a 3% concession, seller financing, or rate buy-down credit?
- What's the actual annual flood-insurance premium (NFIP or private), and is the property in a SFHA with mandatory coverage?
- What does the HOA fee cover, when was the last increase, and are there any pending special assessments or reserve-fund shortfalls?
- Is there a deadline driving the sale (1031 exchange, divorce, estate, relocation)? That informs how much negotiation room exists.
- What's the average days-on-market for RENTAL listings here right now (not sales)? A rising rental-DOM trend means longer vacancies and softer asking-rent achievability than the comps imply.
- What's the recent tenant-quality profile in this submarket — average credit score on applications, eviction rate, late-payment / NSF rate, and stable-employment percentage? A property-management company in the area should have these aggregated.
- How much new for-sale + rental construction is in the pipeline within 1–3 miles? Heavy new supply typically softens prices + rents 12–24 months out; constrained supply supports both.
Investment metrics
- 1% rule
- 1.13% ✓
- Cap rate
- 9.07%
- Cash-on-cash
- 9.91%
- DSCR
- 1.44
- GRM
- 7.4
CMA / ARV
No comps found within radius.
Projected returns pro-forma
-1.48% appreciation · 3.21% rent growth · sell at horizon
- IRR
- 0.5%
- Equity multiple
- 1.02×
- Total profit
- $3,510
- Equity at exit
- $125,645
- IRR
- 8.0%
- Equity multiple
- 1.73×
- Total profit
- $118,245
- Equity at exit
- $121,031
Cash invested: $161,000 (down + closing). Projections, not guarantees.
Landlord ↔ Tenant lean methodology
- Overall (STATE)
- 87 Strongly Landlord-Friendly
- State Florida
- 87 Strongly Landlord-Friendly · R+3
- County
- — inherits STATE
- City
- — inherits STATE
ZIP-level market 34114
- Home prices YoY
- -0.6%
- Rents YoY
- 3.2%
- Active inventory
- 900
- Price-to-rent
- 7.4×
Monthly cashflow live
- Estimated rent
- $6,510 high interval (Pro) →
- Mortgage (P&I)
- −$3,015
- Tax from tax record
- −$255 /mo · $3,064/yr
- Insurance
- −$240
- Flood insurance flood zone
- −$427 /mo · $5,118/yr
- HOA
- −$303
- Vacancy / Maint / Mgmt
- −$1,367
- Net cashflow
- $903
Break-even live
UW: 25.0% down · 7.5% · 30yr · 1.5% tax · 5.0% vac · 8.0% maint · 8.0% mgmt
Financing live
Cash to close
- Down payment
- $143,750
- Closing costs
- $17,250
- Reserves months
- —
- Total cash needed
- —
Loan-product check · same deal, 3 products live
Conventional
25% down · 7.5% · 30yr
- Down + closing
- —
- Monthly P&I
- —
- Monthly cashflow
- —
- DSCR
- —
- Eligible?
- —
Personal DTI + credit; lowest rate.
DSCR
20% down · 8.5% · 30yr
- Down + closing
- —
- Monthly P&I
- —
- Monthly cashflow
- —
- DSCR
- —
- Eligible?
- —
No personal income docs; deal must DSCR.
Hard money
10% down · 12.0% · 12mo
- Down + closing
- —
- Monthly P&I
- —
- Monthly cashflow
- —
- DSCR
- —
- Eligible?
- —
Short-term bridge; refi at stabilization.
Rent comps 40 comps
| Address | Beds | Baths | Sqft | Rent | $/sqft | DOM | Units | Dist |
|---|---|---|---|---|---|---|---|---|
| 3837 Ruby Way Naples, FL | 4.0 | 3.0 | 2293 | $9,500 | $4.14 | 23d | 1 | 0.23mi |
| 3955 Deer Crossing Ct #103 Naples, FL | 3.0 | 2.0 | 1812 | $7,500 | $4.14 | 23d | 1 | 0.46mi |
| 3975 Deer Crossing Ct #201 Naples, FL | 3.0 | 2.0 | 2101 | $7,500 | $3.57 | 23d | 1 | 0.48mi |
| 3940 Deer Crossing Ct Unit 4-203 Naples, FL | 3.0 | 2.0 | 2166 | $7,500 | $3.46 | 23d | 1 | 0.50mi |
| 3985 Deer Crossing Ct #201 Naples, FL | 3.0 | 2.0 | 1981 | $5,795 | $2.93 | 23d | 1 | 0.50mi |
| 3930 Deer Crossing Ct #103 Naples, FL | 3.0 | 2.0 | 1950 | $2,530 | $1.30 | 14d | 1 | 0.51mi |
| 3960 Deer Crossing Ct Unit 6-204 Naples, FL | 3.0 | 2.0 | 2329 | $8,500 | $3.65 | 23d | 1 | 0.51mi |
| 9515 Campanile Cir Naples, FL | 3.0 | 3.0 | 2318 | $20,000 | $8.63 | 23d | 1 | 0.56mi |
| 3860 Cotton Green Path Dr Naples, FL | 4.0 | 3.0 | 2300 | $12,000 | $5.22 | 23d | 1 | 0.60mi |
| 9571 Mussorie Ct Naples, FL | 3.0 | 3.5 | 2117 | $12,500 | $5.90 | 23d | 1 | 0.60mi |
| 847 Enbrook Loop Naples, FL | 2.0 | 2.0 | 1503 | $2,950 | $1.96 | 23d | 1 | 0.63mi |
| 1157 Enbrook Loop Naples, FL | 2.0 | 2.0 | 1503 | $3,000 | $2.00 | 23d | 1 | 0.63mi |
| 842 Enbrook Loop Naples, FL | 2.0 | 2.0 | 1503 | $2,800 | $1.86 | 23d | 1 | 0.64mi |
| 9224 Campanile Cir Unit 203 Naples, FL | 3.0 | 3.0 | 2512 | $6,495 | $2.59 | 14d | 1 | 0.66mi |
| 9242 Tesoro Ln Unit 1-102 Naples, FL | 3.0 | 3.0 | 2237 | $3,000 | $1.34 | 23d | 1 | 0.67mi |
| 4529 Cardinal Cove Ln #7 Naples, FL | 2.0 | 2.0 | 1539 | $6,500 | $4.22 | 23d | 1 | 0.67mi |
| 1212 Enbrook Loop Naples, FL | 2.0 | 2.0 | 1496 | $2,850 | $1.91 | 23d | 1 | 0.68mi |
| 9205 Museo Cir Unit 201 Naples, FL | 4.0 | 3.0 | 3000 | $10,000 | $3.33 | 14d | 1 | 0.68mi |
| 9243 Tesoro Ln Unit 2 Naples, FL | 3.0 | 3.0 | 2100 | $6,500 | $3.10 | 14d | 1 | 0.68mi |
| 4685 Hawks Nest Way #103 Naples, FL | 2.0 | 2.0 | 1440 | $6,500 | $4.51 | 14d | 1 | 0.70mi |
| 7673 Mulberry Ln Naples, FL | 4.0 | 3.0 | 2575 | $18,000 | $6.99 | 14d | 1 | 0.70mi |
| 9209 Museo Cir Unit 102 Naples, FL | 3.0 | 3.0 | 2502 | $7,200 | $2.88 | 14d | 1 | 0.72mi |
| 9239 Tesoro Ln Unit 3-203 Naples, FL | 3.0 | 3.0 | 2300 | $8,000 | $3.48 | 23d | 1 | 0.72mi |
| 9630 Campanile Cir Naples, FL | 3.0 | 3.0 | 2283 | $15,000 | $6.57 | 23d | 1 | 0.73mi |
| 1078 Rolling Brook Ln Naples, FL | 2.0 | 2.0 | 1503 | $2,750 | $1.83 | 21d | 1 | 0.75mi |
| 1276 Enbrook Loop Naples, FL | 2.0 | 2.0 | 1503 | $5,000 | $3.33 | 23d | 1 | 0.75mi |
| 4680 Hawks Nest Way Unit D-103 Naples, FL | 2.0 | 2.0 | 1414 | $3,000 | $2.12 | 14d | 1 | 0.76mi |
| 1973 Yellowfin Cir Naples, FL | 4.0 | 3.0 | 2894 | $9,800 | $3.39 | 23d | 1 | 0.76mi |
| 9255 Museo #103 Naples, FL | 3.0 | 3.0 | 2100 | $9,000 | $4.29 | 23d | 1 | 0.76mi |
| 4650 Hawks Nest Way Unit M202 Naples, FL | 3.0 | 2.0 | 1840 | $9,600 | $5.22 | 14d | 1 | 0.77mi |
| 2057 Yellowfin Cir Naples, FL | 3.0 | 3.0 | 2080 | $7,800 | $3.75 | 23d | 1 | 0.78mi |
| 1937 Yellowfin Cir Naples, FL | 3.0 | 2.0 | 2214 | $3,830 | $1.73 | 21d | 1 | 0.80mi |
| 1171 Tranquil Brook Dr Naples, FL | 2.0 | 2.0 | 1503 | $4,500 | $2.99 | 14d | 1 | 0.81mi |
| 2235 Yellowfin Cir Naples, FL | 2.0 | 2.0 | 1500 | $2,795 | $1.86 | 23d | 1 | 0.85mi |
| 9259 Museo Cir #102 Naples, FL | 3.0 | 3.0 | 2100 | $4,150 | $1.98 | 23d | 1 | 0.85mi |
| 9267 Museo Cir Unit 204 Naples, FL | 3.0 | 3.5 | 2100 | $5,200 | $2.48 | 23d | 1 | 0.86mi |
| 2244 Yellowfin Cir Naples, FL | 3.0 | 2.0 | 1655 | $3,300 | $1.99 | 14d | 1 | 0.88mi |
| 9006 Cascada Way #101 Naples, FL | 3.0 | 2.0 | 2408 | $7,950 | $3.30 | 23d | 1 | 0.88mi |
| 2147 Yellowfin Cir Naples, FL | 4.0 | 3.0 | 2615 | $11,000 | $4.21 | 23d | 1 | 0.88mi |
| 2122 Yellowfin Cir Naples, FL | 4.0 | 3.0 | 2200 | $3,200 | $1.45 | 14d | 1 | 0.90mi |
HOA detail
- Monthly dues
- $303 · $3,636/yr
Listing history 32 events
-
2026-06-18days on market $575,000 Active 45 DOM
-
2026-06-17days on market $575,000 Active 44 DOM
-
2026-06-16days on market $575,000 Active 43 DOM
-
2026-06-15days on market $575,000 Active 42 DOM
-
2026-06-14days on market $575,000 Active 40 DOM
-
2026-06-10days on market $575,000 Active 37 DOM
-
2026-06-09days on market $575,000 Active 36 DOM
-
2026-06-08days on market $575,000 Active 35 DOM
-
2026-06-07days on market $575,000 Active 34 DOM
-
2026-06-03days on market $575,000 Active 30 DOM
-
2026-06-02days on market $575,000 Active 29 DOM
-
2026-06-01days on market $575,000 Active 28 DOM
-
2026-05-31days on market $575,000 Active 27 DOM
-
2026-05-30days on market $575,000 Active 26 DOM
-
2026-05-04$575,000 Active
-
2026-03-26historical
-
2026-03-17price $569,900
-
2026-01-24price $579,900
-
2026-01-23$549,900 Active
-
2026-01-20historical
-
2025-12-10$599,900 Active
-
2025-05-10historical
-
2025-03-21price $599,900
-
2025-02-17price $629,900
-
2025-01-11$649,900 Active
-
2024-05-16historical
-
2024-03-20$669,900 Active
-
2015-08-05historical
-
2015-04-02$339,900 Active
-
2014-09-25soldstatus $286,200
-
2014-09-25price $292,785
-
2014-04-30$286,200
ⓘ Source: listings_history table (triggers on properties + properties_extension) + one-shot
backfill from property_details.listing_events for pre-trigger history.
Tax reassessment forecast FL · Resets to sale price
- Current annual tax
- $3,064 · $255/mo
- Projected year-2 tax
- $4,772 · $398/mo
- Expected delta
- +$1,708/yr (+$142/mo · 55.7%)
ⓘ Screening estimate from a state-policy table — verify with the county assessor before closing.
Climate risk First Street
- Flood 8/10 Severe FEMA zone AE · 99% chance over 30 yrs
- Wildfire 4/10 Moderate
- Heat 10/10 Extreme 7 d/yr ≥108°F today · 30 d/yr by 30 yrs out
- Wind 10/10 Extreme 99% chance of damaging wind over 30 yrs
- Air quality 3/10 Moderate 3 unhealthy d/yr today · 3 by 30 yrs out
Nearby sold comps map
Loading sold comps map…
Walkable amenities ~0.75 mi
Loading nearby amenities…
Taxation est. · year 1
- Rental income
- $78,123
- − Mortgage interest
- −$32,209
- − Property taxes
- −$3,064
- − Insurance
- −$7,994
- − Repairs & maintenance
- −$6,250
- − Management
- −$6,250
- − HOA
- −$3,636
- − Depreciation
- −$16,727
- Taxable income
- $1,993
- Est. tax owed @ 24.0%
- −$478
- After-tax cash flow
- $10,361/yr
For passive investors: Depreciation is non-cash, so a rental often shows a tax loss while cash-flowing — sheltering income. Rental losses are passive: they offset passive income freely, and up to $25,000/yr can offset ordinary (W-2) income if you actively participate and your MAGI is under $100k (phasing out to $0 by $150k); unused losses carry forward. On sale, claimed depreciation is recaptured at up to 25%, and gains may owe capital-gains tax (a 1031 exchange can defer both). Figures are a year-1 estimate at your 24.0% rate — not tax advice; consult a CPA.
Schools (NCES district)
- District
- Collier
- NCES district ID
- 1200330
- Math proficiency
- 60% ▼ -4.00%
- Reading proficiency
- 56% ▼ -2.00%
- Median HH income
- $58,275
- Composite
- 50.23/100
- National rank
- #1892
- State rank
- #16 of 73 in FL
Livability — Winding Cypress
No livability data for this city. (Only ~50 U.S. cities are tracked.)
Census & demographics
- County
- Collier County · 396,295 people
- Metro
- Naples-Marco Island, FL
- Population (ZIP)
- 23,559
- Household income
- $89,334
- Rent vs Own
- Severe rent burden
- 550.0
Population outlook (Collier County) Hauer SSP2
- Today (2025)
- 420,858 people
- By 2030
- 450,054 · +6.9%
- By 2040
- 502,232 · +19.3%
- By 2050
- 544,932 · +29.5%
- By 2075
- 627,203 · +49.0%
- By 2100
- 659,015 · +56.6%
Race, ethnicity, and origin ACS 2023
- Neighborhood character
- Predominantly White (72%)
- Race & ethnicity
- White 72% Hispanic / Latino 17% Two or more races 13% Black 7%
- Hispanic origin (detail)
- Mexican 7% Puerto Rican 1% Cuban 3%
- Common ancestry
- Hispanic 5% Romanian 4% Lithuanian 1%
- Foreign-born
- 21% · Canada, Jamaica
- Languages at home
- 75% English-only · Spanish 15% French/Haitian/Cajun 5% Other Indo-European 4%
Political lean MEDSL · Collier
- 2024 margin
- Solid R (+33.1) · D 33.1% · R 66.2%
- 2008→2024 swing
- -10.6pp toward R · 2008: -22.5pp · 2024: -33.1pp
- All cycles
- 2024: R+33.1 2020: R+24.7 2016: R+26.0 2012: R+30.1 2008: R+22.5
Not yet ingested
- Civics
- —
Market trends
- HPI YoY
- ▼ -1.48%
- Current HPI
- 266.5545
- Rent YoY
- ▲ 3.21%
- Metro
- Naples-Marco Island, FL
- State GDP YoY
- ▲ 3.28%
- F500 in state
- 36
Industry mix (Fortune 500 HQ in FL)
| Industry | F500 HQs | Revenue |
|---|---|---|
| Industrial Technology | 2 | $29B |
|
||
| Insurance | 2 | $17B |
|
||
| Retail | 1 | $60B |
|
||
| Technology Distribution | 1 | $58B |
|
||
| Homebuilding | 1 | $35B |
|
||
| Technology Manufacturing | 1 | $35B |
|
||
Price history
+100.9% since first listed18 events — show timeline
- 2026-05-04 Listed $575,000 NAPLESMLS
- 2026-03-26 Listing Removed — NAPLESMLS
- 2026-03-17 Price Changed $569,900 NAPLESMLS
- 2026-01-24 Price Changed $579,900 NAPLESMLS
- 2026-01-23 Listed $549,900 NAPLESMLS
- 2026-01-20 Listing Removed — NAPLESMLS
- 2025-12-10 Listed $599,900 NAPLESMLS
- 2025-05-10 Listing Removed — NAPLESMLS
- 2025-03-21 Price Changed $599,900 NAPLESMLS
- 2025-02-17 Price Changed $629,900 NAPLESMLS
- 2025-01-11 Listed $649,900 NAPLESMLS
- 2024-05-16 Listing Removed — NAPLESMLS
- 2024-03-20 Listed $669,900 NAPLESMLS
- 2015-08-05 Listing Removed — NAPLESMLS
- 2015-04-02 Listed $339,900 NAPLESMLS
- 2014-09-25 Price Changed $292,785 NAPLESMLS
- 2014-09-25 Sold (MLS) $286,200 NAPLESMLS
- 2014-04-30 Listed $286,200 NAPLESMLS
Property tax history
+32.6%/yrLatest (2025): $3,064 · +7.0% YoY. Source: county tax records.
Cash-flow waterfall
monthlySold comps — $/sqft
last 12 mo · ≤1 miLoading sold comps…