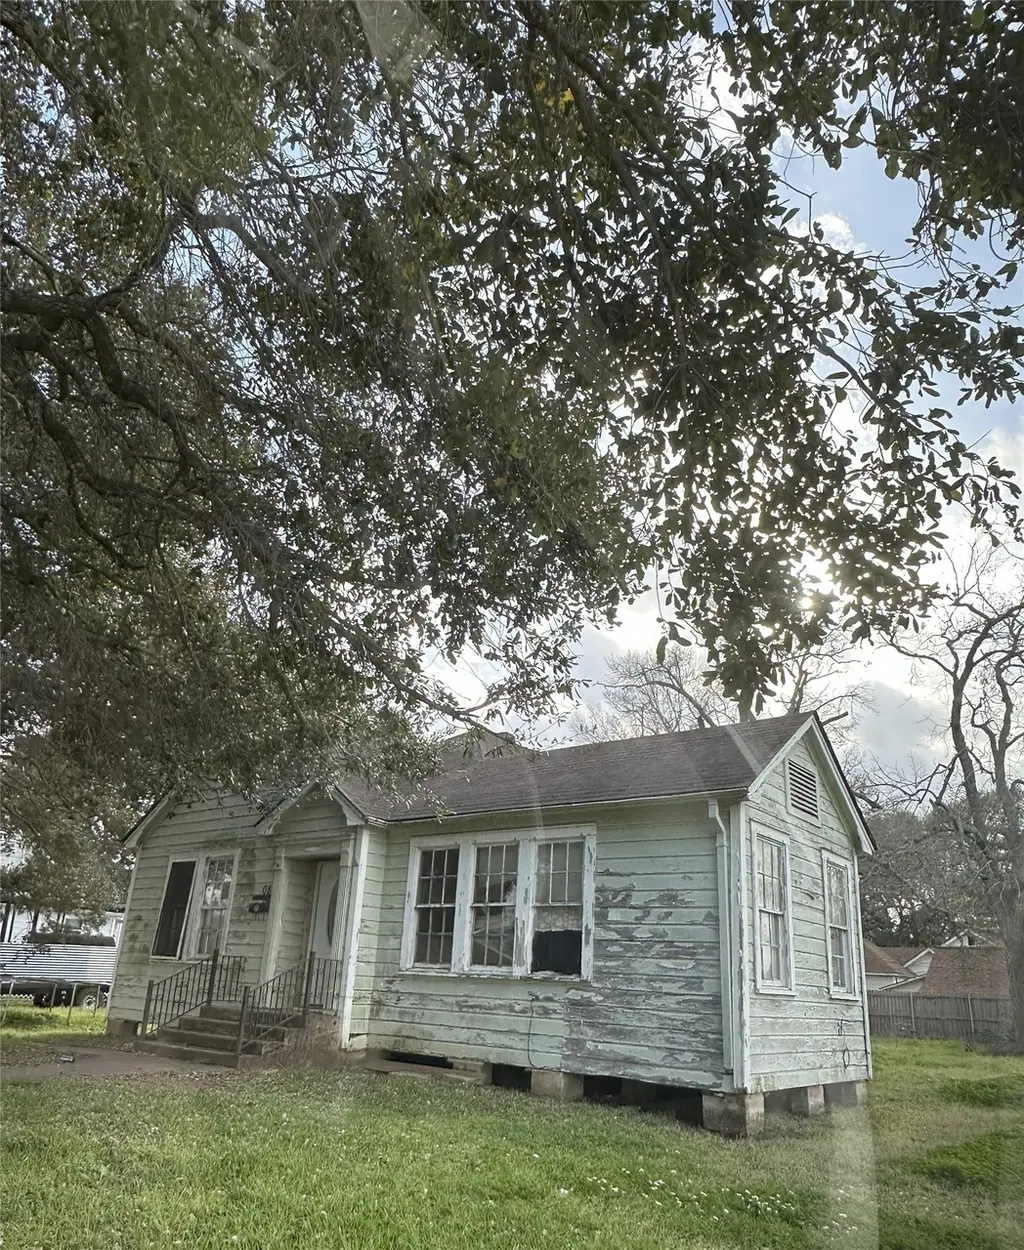
1108 Macarthur St · Rosenberg, TX
Flood risk 4/10 · Minor
- FEMA flood zone
- X (unshaded)
- Chance of flooding over 30 yrs
- 0.2%
- Est. flood insurance / yr
- $507 – $1,088
Fire risk 2/10 · Minimal
- Est. fire insurance / yr
- $1,222 – $2,270
Heat risk 9/10 · Severe
- Hot days now (above 110°F)
- 7 days/yr
- Hot days in 30 yrs
- 23 days/yr
Wind risk 9/10 · Severe
- Chance of severe wind over 30 yrs
- 99.0%
Air-quality risk 2/10 · Minimal
- Unhealthy air days now
- 1 days/yr
- Unhealthy air days in 30 yrs
- 1 days/yr
Risk factors via First Street. Map © Google.
Why this score? — see what drove the C- grade
The composite is a weighted blend of 9 inputs, each scored 0–100. Each bar is that input's sub-score; the figure is the points it added to the 100-point composite (weight × sub-score).
- ARV discount +15.0/15.0
- Cash flow +14.5/30.0
- Schools +4.6/10.0
- 1% rule +4.4/10.0
- DSCR +4.4/10.0
- Livability +3.1/5.0
- Condition / age +2.5/5.0
- Rent growth +2.3/5.0
- Appreciation +0.0/10.0
$185,000
🖨 Deal sheet (PDF) 📄 Offer letter ✓ Due diligence
Listing remarks MLS
Step into this charming 3-bedroom, 1-bath gem with ENDLESS POTENTIAL! The standout feature? A HUGE master bedroom that’s ready to become your cozy retreat. Picture this: Transform it into a stunning farmhouse-style haven with modern touches—think shiplap walls, antique original solid wood doors, and that perfect rustic vibe! It’s a true canvas for your vision. Priced to sell for the handy homeowner. Don’t miss out—schedule your showing TODAY!
Key facts
- 0.28 acre lot
- Built 1954
- Listed 231 days
Neighborhood map
What this means for you Summary
Snapshot
- This is a 3-bed/2.0-bath single-family listed at $185k.
Deal economics
- At list price, monthly cash flow is $40 ($483/yr) — positive.
- The deal already cash-flows at list — no discount required.
- To meet the 1% rule (rent ≥ 1% of price), the offer needs to be $175k (5.6% below list).
- Recommended offer: $163k (12.0% below list) — sets the bar for market timing.
- Cap rate 6.6% vs local median 3.4% in Rosenberg — top-decile yield for the area; either an underpriced asset or a hidden risk that comps aren't pricing in. Stress-test before assuming the spread holds.
Location & tenants
- Location reads 62/100 on livability (#922 in TX) — a middle-class / working-renter tenant base. Strengths: cost of living A+, housing A+, crime B; Watch: amenities F, commute F, health & safety F.
- Lamar CISD (suburban): math 50% / reading 53% proficiency, ranked #116 of 826 in TX (top 14%) — acceptable for families but not a draw, mixed tenant base, ~2y average lease.
- Zoned schools: Travis El (math 21% / reading 27%, grade F, #3,221 of 4,322 statewide, top 75%, 426 students, 91% FRL); George J H (math 27% / reading 28%, grade F, #1,156 of 1,662 statewide, top 71%, 1,173 students, 81% FRL); B F Terry H S (math 34% / reading 41%, grade F, #888 of 1,632 statewide, top 55%, 1,739 students, 74% FRL) — zoned schools average 82% FRL vs 43% district-wide (39 pts higher); higher-poverty schools than district average — tighter screening recommended.
- Zoned-school proficiency averages 30% at this address vs 52% district-wide (-22 pts) — the specific schools serving this property underperform the Lamar CISD average; the district grade overstates school quality for this exact location.
- Market conditions: Rents soft (-1.0%/yr); 727 active listings in the ZIP; 15 comparable units currently listed for rent nearby; rentals at typical pace (median 27d on market — plan ~3-4 weeks tenant-placement turnaround); 47% of comp listings sitting > 30 days — soft ceiling on asking rent; 12,093 units permitted in Fort Bend County in 2024 (815 in 5+ unit buildings).
Forward outlook
- Local home prices are declining (-3.0%/yr); year-one equity from $1k of loan paydown is wiped out by about $6k of value loss. Plan a longer hold.
- Fort Bend County population projected at +75% by 2050 — long-run rental-demand tailwind backs the buy-and-hold thesis.
Negotiation context
- It's been on market 232 days — a 12% lower offer ($163k) is reasonable based on typical stale-listing flexibility.
Risks & watch-outs
- Watch-outs: built in 1954 — expect roof / HVAC / electrical / plumbing capex.
- Climate carrying-cost: severe wind risk, 99% chance of damaging wind over 30y; extreme-heat days projected 7→23/yr by 2055 (HVAC capex compounding) — expect insurance premiums to compound above CPI over the hold.
Questions for the listing agent
- It's been on market 232 days. Have you received any prior offers? Is the seller open to a 12% concession, seller financing, or rate buy-down credit?
- Built in 1954 — when were the roof, HVAC, electrical panel, plumbing, and water heater last replaced?
- Why hasn't it sold? Are there any deal-killer items the seller is aware of (foundation, flood, title, zoning, code violations)?
- Is there a deadline driving the sale (1031 exchange, divorce, estate, relocation)? That informs how much negotiation room exists.
- Schools are D-rated, which usually means shorter tenancies and higher turnover. Who's the typical renter profile here, and what's been the actual vacancy rate?
- What's the average days-on-market for RENTAL listings here right now (not sales)? A rising rental-DOM trend means longer vacancies and softer asking-rent achievability than the comps imply.
- What's the recent tenant-quality profile in this submarket — average credit score on applications, eviction rate, late-payment / NSF rate, and stable-employment percentage? A property-management company in the area should have these aggregated.
- How much new for-sale + rental construction is in the pipeline within 1–3 miles? Heavy new supply typically softens prices + rents 12–24 months out; constrained supply supports both.
Investment metrics
- 1% rule
- 0.94% ✗
- Cap rate
- 6.55%
- Cash-on-cash
- 0.93%
- DSCR
- 1.04
- GRM
- 8.8
CMA / ARV
- ARV (median comp)
- $232,462
- List price
- $185,000
- Delta
- -20.42%
- Verdict
- UNDERPRICED
- Comps
- 20 within 1.0 mi
Show comp detail 12 sales within ~0.75 mi
| Address | Dist | Beds/Ba | Sqft | Sold | Price | $/sf | Match |
|---|---|---|---|---|---|---|---|
| 2601 Avenue G | 0.19mi | 3/2.0 | 1,680 (-2%) | 17mo | $248,000 | $148 | 74 |
| 2717 Parrott Ave | 0.46mi | 3/2.0 | 1,662 (-3%) | 1mo | $259,900 | $156 | 73 |
| 1110 Alamo St | 0.13mi | 3/2.0 | 1,640 (-4%) | 18mo | $250,000 | $152 | 72 |
| 2501 Avenue G | 0.21mi | 4/1.0 (+1) | 1,658 (-3%) | 8mo | $134,900 | $81 | 70 |
| 1117 Austin St | 0.22mi | 3/2.0 | 1,540 (-10%) | 9mo | $214,900 | $140 | 66 |
| 2712 Parrott Ave | 0.49mi | 3/2.0 | 1,631 (-4%) | 13mo | $249,900 | $153 | 59 |
| 2000 Hamilton St | 0.69mi | 3/2.0 | 1,611 (-6%) | 1mo | $250,000 | $155 | 58 |
| 1425 Damon St | 0.39mi | 3/1.0 | 1,555 (-9%) | 15mo | $215,000 | $138 | 50 |
| 2510 Avenue F | 0.24mi | 4/2.0 (+1) | 1,514 (-11%) | 18mo | $245,000 | $162 | 50 |
| 1314 2nd St | 0.54mi | 3/2.0 | 1,472 (-14%) | 5mo | $250,000 | $170 | 48 |
| 2609 Parrott Ave | 0.49mi | 3/2.0 | 1,930 (+13%) | 9mo | $299,900 | $155 | 48 |
| 1909 Grant St | 0.62mi | 3/2.0 | 1,505 (-12%) | 12mo | $246,000 | $163 | 41 |
Match score weights: distance 35% · size 25% · config 20% · recency 20%. Top-matched comps best support the ARV.
Projected returns pro-forma
-3.0% appreciation · 0.0% rent growth · sell at horizon
- IRR
- -18.4%
- Equity multiple
- 0.37×
- Total profit
- $-32,465
- Equity at exit
- $27,584
- IRR
- -18.5%
- Equity multiple
- 0.14×
- Total profit
- $-44,482
- Equity at exit
- $15,995
Cash invested: $51,800 (down + closing). Projections, not guarantees.
Landlord ↔ Tenant lean methodology
- Overall (STATE)
- 87 Strongly Landlord-Friendly
- State Texas
- 87 Strongly Landlord-Friendly · R+5
- County
- — inherits STATE
- City
- — inherits STATE
ZIP-level market 77471
- Home prices YoY
- -19.3%
- Rents YoY
- -1.0%
- Active inventory
- 727
- Price-to-rent
- 8.8×
Monthly cashflow live
- Estimated rent
- $1,746 high interval (Pro) →
- Mortgage (P&I)
- −$970
- Tax from tax record
- −$292 /mo · $3,502/yr
- Insurance
- −$77
- HOA
- −$0
- Lot rent
- −$0
- Vacancy / Maint / Mgmt
- −$367
- Net cashflow
- $40
Break-even live
Sensitivity live
| Price | -10% $145 | -5% $93 | +0% $40 | +5% $-12 | +10% $-64 |
|---|---|---|---|---|---|
| Rent | -10% $-98 | -5% $-29 | +0% $40 | +5% $109 | +10% $178 |
| Rate | -1.0pp $133 | -0.5pp $87 | base $40 | +0.5pp $-8 | +1.0pp $-56 |
UW: 25.0% down · 7.5% · 30yr · 1.5% tax · 5.0% vac · 8.0% maint · 8.0% mgmt
Financing live
Cash to close
- Down payment
- $46,250
- Closing costs
- $5,550
- Reserves months
- —
- Total cash needed
- —
Loan-product check · same deal, 3 products live
Conventional
25% down · 7.5% · 30yr
- Down + closing
- —
- Monthly P&I
- —
- Monthly cashflow
- —
- DSCR
- —
- Eligible?
- —
Personal DTI + credit; lowest rate.
DSCR
20% down · 8.5% · 30yr
- Down + closing
- —
- Monthly P&I
- —
- Monthly cashflow
- —
- DSCR
- —
- Eligible?
- —
No personal income docs; deal must DSCR.
Hard money
10% down · 12.0% · 12mo
- Down + closing
- —
- Monthly P&I
- —
- Monthly cashflow
- —
- DSCR
- —
- Eligible?
- —
Short-term bridge; refi at stabilization.
Rent comps 15 comps
| Address | Beds | Baths | Sqft | Rent | $/sqft | DOM | Units | Dist |
|---|---|---|---|---|---|---|---|---|
| 1202 3rd St Rosenberg, TX | 3.0 | 2.0 | 1400 | $1,575 | $1.12 | 1d | 1 | 0.42mi |
| 1202 3rd St Rosenberg, TX | 3.0 | 2.0 | 1400 | $1,575 | $1.12 | 26d | 1 | 0.42mi |
| 2009 Tremont Ct Rosenberg, TX | 3.0 | 1.5 | 1425 | $1,701 | $1.19 | 24d | 1 | 0.63mi |
| 1200 Carlisle St Rosenberg, TX | 2.0 | 1.0 | 1826 | $1,650 | $0.90 | 46d | 1 | 0.68mi |
| 3412 Avenue R Unit R Rosenberg, TX | 3.0 | 2.0 | 1467 | $1,775 | $1.21 | 46d | 1 | 0.79mi |
| 2020 Ward St Rosenberg, TX | 3.0 | 2.0 | 1748 | $1,850 | $1.06 | 46d | 1 | 0.80mi |
| 3828 Avenue N Rosenberg, TX | 3.0 | 2.0 | 1238 | $1,650 | $1.33 | 46d | 1 | 0.89mi |
| 3828 Avenue N Rosenberg, TX | 3.0 | 2.0 | 1238 | $1,650 | $1.33 | 1d | 1 | 0.89mi |
| 2122 Hackberry Bank Ln Rosenberg, TX | 3.0 | 2.0 | 1620 | $1,799 | $1.11 | 6d | 1 | 0.93mi |
| 4114 Brumbelow St Rosenberg, TX | 3.0 | 2.0 | 1234 | $1,700 | $1.38 | 7d | 1 | 1.18mi |
| 909 Klare Ave Rosenberg, TX | 3.0 | 2.0 | 1836 | $1,895 | $1.03 | 46d | 1 | 1.23mi |
| 1615 Junker St Rosenberg, TX | 3.0 | 2.0 | 1174 | $1,750 | $1.49 | 46d | 1 | 1.27mi |
| 4720 Reading Rd Rosenberg, TX | 2.0–3.0 | 1.0–2.0 | 930 | $1,422 | $1.53 | 4d | 15 | 1.42mi |
| 4932 Vancouver Blvd Richmond, TX | 3.0 | 2.0 | 1321 | $3,500 | $2.65 | 15d | 1 | 1.44mi |
| 4726 Reading Rd Rosenberg, TX | 3.0 | 2.0 | 1060 | $1,275 | $1.20 | 46d | 1 | 1.45mi |
Listing history 20 events
-
2026-06-22days on market $185,000 Active 232 DOM
-
2026-06-21days on market $185,000 Active 231 DOM
-
2026-06-18days on market $185,000 Active 228 DOM
-
2026-06-17days on market $185,000 Active 227 DOM
-
2026-06-16days on market $185,000 Active 226 DOM
-
2026-06-15days on market $185,000 Active 225 DOM
-
2026-06-13days on market $185,000 Active 223 DOM
-
2026-06-10days on market $185,000 Active 219 DOM
-
2026-06-08days on market $185,000 Active 218 DOM
-
2026-06-07days on market $185,000 Active 217 DOM
-
2026-06-04days on market $185,000 Active 214 DOM
-
2026-06-03days on market $185,000 Active 213 DOM
-
2026-06-02days on market $185,000 Active 212 DOM
-
2026-06-01days on market $185,000 Active 211 DOM
-
2026-05-31days on market $185,000 Active 210 DOM
-
2026-05-12price $185,000 478-char remark
Show marketing remark (478 chars)
Step into this charming 3-bedroom, 1-bath gem with ENDLESS POTENTIAL! The standout feature? A HUGE master bedroom that’s ready to become your cozy retreat. Picture this: Transform it into a stunning farmhouse-style haven with modern touches—think shiplap walls, antique original solid wood doors, and that perfect rustic vibe! It’s a true canvas for your vision. Priced to sell for the handy homeowner. Don’t miss out—schedule your showing TODAY!
-
2025-11-02$195,000 Active 478-char remark
Show marketing remark (478 chars)
Step into this charming 3-bedroom, 1-bath gem with ENDLESS POTENTIAL! The standout feature? A HUGE master bedroom that’s ready to become your cozy retreat. Picture this: Transform it into a stunning farmhouse-style haven with modern touches—think shiplap walls, antique original solid wood doors, and that perfect rustic vibe! It’s a true canvas for your vision. Priced to sell for the handy homeowner. Don’t miss out—schedule your showing TODAY!
-
2024-11-22soldstatus
-
2002-10-02soldstatus
-
2000-09-25soldstatus
ⓘ Source: listings_history table (triggers on properties + properties_extension) + one-shot
backfill from property_details.listing_events for pre-trigger history.
Tax reassessment forecast TX · Resets to sale price
- Current annual tax
- $3,502 · $292/mo
- Projected year-2 tax
- $3,502 · $292/mo
- Expected delta
- $0/yr ($0/mo · 0.0%)
ⓘ Screening estimate from a state-policy table — verify with the county assessor before closing.
Climate risk First Street
- Flood 4/10 Moderate FEMA zone X (unshaded) · 20% chance over 30 yrs
- Wildfire 2/10 Low
- Heat 9/10 Extreme 7 d/yr ≥110°F today · 23 d/yr by 30 yrs out
- Wind 9/10 Extreme 99% chance of damaging wind over 30 yrs
- Air quality 2/10 Low 1 unhealthy d/yr today · 1 by 30 yrs out
Nearby sold comps map
Loading sold comps map…
Walkable amenities ~0.75 mi
Loading nearby amenities…
Taxation est. · year 1
- Rental income
- $20,952
- − Mortgage interest
- −$10,363
- − Property taxes
- −$3,502
- − Insurance
- −$925
- − Repairs & maintenance
- −$1,676
- − Management
- −$1,676
- − Depreciation
- −$5,382
- Taxable loss
- −$2,572
- Est. tax savings @ 24.0%
- +$617
- After-tax cash flow
- $1,101/yr
For passive investors: Depreciation is non-cash, so a rental often shows a tax loss while cash-flowing — sheltering income. Rental losses are passive: they offset passive income freely, and up to $25,000/yr can offset ordinary (W-2) income if you actively participate and your MAGI is under $100k (phasing out to $0 by $150k); unused losses carry forward. On sale, claimed depreciation is recaptured at up to 25%, and gains may owe capital-gains tax (a 1031 exchange can defer both). Figures are a year-1 estimate at your 24.0% rate — not tax advice; consult a CPA.
Schools (NCES district)
- District
- Lamar CISD
- NCES district ID
- 4826580
- Math proficiency
- 50% ▼ -12.00%
- Reading proficiency
- 53% ▼ -4.00%
- Median HH income
- $75,213
- Composite
- 46.43/100
- National rank
- #2452
- State rank
- #116 of 826 in TX
Livability — Rosenberg
- Score
- 62/100
- State rank
- #922
- US rank
- #16414
Category grades
Schools grade is shown separately in the Schools card above.
Census & demographics
- Census place
- Rosenberg, TX
- County
- Fort Bend County · 836,777 people
- City population
- 115,151
- Metro
- Houston-The Woodlands-Sugar Land, TX
- Population (ZIP)
- 45,325
- Household income
- $73,186
- Rent vs Own
- Severe rent burden
- 1688.0
Population outlook (Fort Bend County) Hauer SSP2
- Today (2025)
- 1,004,526 people
- By 2030
- 1,153,104 · +14.8%
- By 2040
- 1,453,718 · +44.7%
- By 2050
- 1,753,781 · +74.6%
- By 2075
- 2,455,772 · +144.5%
- By 2100
- 2,930,528 · +191.7%
Race, ethnicity, and origin ACS 2023
- Neighborhood character
- Diverse neighborhood (Simpson 0.61)
- Race & ethnicity
- Hispanic / Latino 56% White 23% Two or more races 21% Black 12% Asian 7%
- Hispanic origin (detail)
- Mexican 46%
- Common ancestry
- Romanian 1% Lithuanian 1% Slovak 1%
- Foreign-born
- 18% · Canada, China, Vietnam
- Languages at home
- 57% English-only · Spanish 35% Tagalog/Filipino 2% Other Indo-European 1%
Political lean MEDSL · Fort Bend
- 2024 margin
- Toss-up / Even · D 49.5% · R 47.9% · Other 2.6%
- 2008→2024 swing
- +4.0pp toward D · 2008: -2.4pp · 2024: 1.6pp
- All cycles
- 2024: D+1.6 2020: D+10.6 2016: D+6.6 2012: R+6.8 2008: R+2.4
Not yet ingested
- Civics
- —
Market trends
- HPI YoY
- ▼ -74.06%
- Current HPI
- 309.5425
- Rent YoY
- ▼ -0.97%
- Metro
- Houston-The Woodlands-Sugar Land, TX
- State GDP YoY
- ▲ 3.95%
- F500 in state
- 110
Industry mix (Fortune 500 HQ in TX)
| Industry | F500 HQs | Revenue |
|---|---|---|
| Energy | 16 | $1,198B |
|
||
| Technology | 5 | $198B |
|
||
| Engineering / Construction | 4 | $72B |
|
||
| Energy Services | 3 | $60B |
|
||
| Utilities | 3 | $41B |
|
||
| Healthcare | 2 | $330B |
|
||
Price history
-5.1% since first listed5 events — show timeline
- 2026-05-12 Price Changed $185,000 HARMLS
- 2025-11-02 Listed $195,000 HARMLS
- 2024-11-22 Sold (Public Records) — Public Records
- 2002-10-02 Sold (Public Records) — Public Records
- 2000-09-25 Sold (Public Records) — Public Records
Property tax history
+3.2%/yrLatest (2025): $3,502 · -12.8% YoY. Source: county tax records.
Cash-flow waterfall
monthlySold comps — $/sqft
last 12 mo · ≤1 miLoading sold comps…