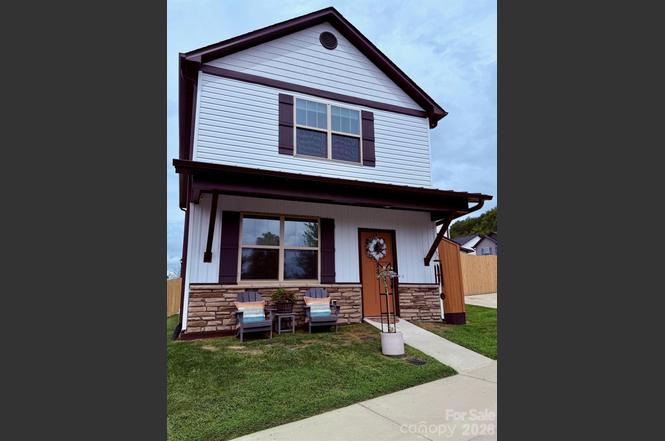
526 Cardwell Ln · Fletcher, NC
Flood risk 1/10 · Minimal
- FEMA flood zone
- X (unshaded)
- Chance of flooding over 30 yrs
- 0.0%
- Est. flood insurance / yr
- $507 – $1,088
Fire risk 3/10 · Minor
- Est. fire insurance / yr
- $906 – $1,684
Heat risk 4/10 · Minor
- Hot days now (above 96°F)
- 7 days/yr
- Hot days in 30 yrs
- 20 days/yr
Wind risk 2/10 · Minimal
- Chance of severe wind over 30 yrs
- —
Air-quality risk 3/10 · Minor
- Unhealthy air days now
- 2 days/yr
- Unhealthy air days in 30 yrs
- 3 days/yr
Risk factors via First Street. Map © Google.
Why this score? — see what drove the D grade
The composite is a weighted blend of 9 inputs, each scored 0–100. Each bar is that input's sub-score; the figure is the points it added to the 100-point composite (weight × sub-score).
- Cash flow +12.2/30.0
- ARV discount +11.6/15.0
- Schools +4.2/10.0
- DSCR +3.6/10.0
- Livability +3.5/5.0
- Rent growth +2.5/5.0
- Condition / age +2.5/5.0
- 1% rule +2.4/10.0
- Appreciation +0.0/10.0
$369,750
🖨 Deal sheet 📄 Offer letter ✓ Due diligence
Listing remarks
Beyond builder grade and thoughtfully updated, this 4-bedroom 2.5 bath home offers a perfect blend of comfort, functionality, and style along with beautiful mountain views. From the moment you step inside, you will notice the attention to detail and the many upgrades that elevate this home beyond standard new construction. The entryway is both welcoming and functional, featuring a custom hall tree that creates an ideal drop zone for shoes, bags, and coats. Craftsman style doors and trim run throughout the entire home, adding warmth and character from the moment you walk in. From there, the main level opens into a bright, easy flowing layout that works well for both daily living and gatherin
Key facts
- Many upgrades
- Thoughtfully updated
- Mountain views
Tags
Property features AI
Finance
- HOA & community: HOA with mandatory annual fee of $399; Community features include picnic area, sidewalks, street lights, and walking trails
Exterior
- Parking: Driveway
- Utilities: City water; Public sewer
- Home design: Single-family residence; Residential property; Two levels; Site-built construction
- Construction: Stone and vinyl exterior; Metal roof; Slab foundation
- Exterior features: Deck; Fenced yard; Shed(s); Green area
Interior
- Kitchen: Bar fridge; Disposal; Electric oven; Electric range; ENERGY STAR dishwasher; ENERGY STAR refrigerator; Exhaust fan; Filtration system
- Bedrooms: 4 bedrooms total (3 upstairs, 1 main level)
- Flooring: Carpet; Vinyl
- Bathrooms: 2 full bathrooms; 1 half bathroom
- Heating & cooling: Central heating; Central air conditioning
- Interior features: Attic pull-down stairs; Kitchen island; Open floor plan; Pantry; Walk-in closets; Screen doors; Sliding doors; 7 total rooms
- Laundry & utility: Laundry on main level
Neighborhood map
What this means for you Summary
Snapshot
- This is a 4-bed/2.5-bath single-family listed at $370k.
Deal economics
- At list price, monthly cash flow is $-72 ($-869/yr) — negative.
- To cash-flow at today's rent, offer at most $357k (3.5% below list).
- To meet the 1% rule (rent ≥ 1% of price), the offer needs to be $275k (25.8% below list).
- Recommended offer: $275k (25.8% below list) — sets the bar for 1% rule.
- Cap rate 6.1% vs local median 3.9% in Fletcher — top-decile yield for the area; either an underpriced asset or a hidden risk that comps aren't pricing in. Stress-test before assuming the spread holds.
Location & tenants
- Location reads 70/100 on livability (#129 in NC) — a middle-class / working-renter tenant base. Strengths: crime A+, housing A+, employment B+; Watch: amenities F, commute F, health & safety F.
- Henderson County Schools (suburban): math 48% / reading 52% proficiency, ranked #64 of 178 in NC (top 36%) — acceptable for families but not a draw, mixed tenant base, ~2y average lease.
- Market conditions: 208 active listings in the ZIP; 3 comparable units currently listed for rent nearby; rentals at typical pace (median 24d on market — plan ~3-4 weeks tenant-placement turnaround); solid renter incomes; 1,534 units permitted in Henderson County in 2024 (558 in 5+ unit buildings).
- This rent runs 40% of the median local income ($82k/yr) — at the standard rent-burdened threshold; future hikes will face affordability resistance.
Forward outlook
- Local home prices are declining (-3.0%/yr); year-one equity from $3k of loan paydown is wiped out by about $11k of value loss. Plan a longer hold.
- Henderson County population projected at +20% by 2050 — long-run rental-demand tailwind backs the buy-and-hold thesis.
Negotiation context
- It's been on market 134 days — a 12% lower offer ($325k) is reasonable based on typical stale-listing flexibility.
Questions for the listing agent
- What do current leases actually rent for vs. the listed asking? Can we see a recent rent roll and the last 12 months of T-12 income?
- It's been on market 134 days. Have you received any prior offers? Is the seller open to a 26% concession, seller financing, or rate buy-down credit?
- What does the HOA fee cover, when was the last increase, and are there any pending special assessments or reserve-fund shortfalls?
- Why hasn't it sold? Are there any deal-killer items the seller is aware of (foundation, flood, title, zoning, code violations)?
- Is there a deadline driving the sale (1031 exchange, divorce, estate, relocation)? That informs how much negotiation room exists.
- Schools are B-rated — typically a magnet for longer-tenancy family renters. What's the average tenant stay here, and is there a school-zone premium baked into asking?
- The area grade is low — what's the realistic commute time and amenity access for the typical tenant pool here? Any planned neighborhood developments (good or bad) we should know about?
- What's the average days-on-market for RENTAL listings here right now (not sales)? A rising rental-DOM trend means longer vacancies and softer asking-rent achievability than the comps imply.
- What's the recent tenant-quality profile in this submarket — average credit score on applications, eviction rate, late-payment / NSF rate, and stable-employment percentage? A property-management company in the area should have these aggregated.
- How much new for-sale + rental construction is in the pipeline within 1–3 miles? Heavy new supply typically softens prices + rents 12–24 months out; constrained supply supports both.
Investment metrics
- 1% rule
- 0.74% ✗
- Cap rate
- 6.06%
- Cash-on-cash
- -0.84%
- DSCR
- 0.96
- GRM
- 11.2
CMA / ARV
- ARV (on-the-fly)
- $406,560
- Comps found
- 4
Show comp detail 4 sales within ~0.75 mi
| Address | Dist | Beds/Ba | Sqft | Sold | Price | $/sf | Match |
|---|---|---|---|---|---|---|---|
| 526 Cardwell Ln | 0.00mi | 4/2.5 | 1,786 (+2%) | 0mo | $362,500 | $203 | 97 |
| 30 Patti Dr | 0.70mi | 3/2.5 (-1) | 1,795 (+2%) | 1mo | $415,000 | $231 | 58 |
| 280 Fletcher View Dr | 0.54mi | 3/3.0 (-1) | 1,732 (-2%) | 12mo | $399,000 | $230 | 55 |
| 2 Warbler Dr | 0.63mi | 3/2.0 (-1) | 1,734 (-2%) | 15mo | $460,000 | $265 | 49 |
Match score weights: distance 35% · size 25% · config 20% · recency 20%. Top-matched comps best support the ARV.
Projected returns pro-forma
-3.0% appreciation · 3.0% rent growth · sell at horizon
- IRR
- -17.7%
- Equity multiple
- 0.38×
- Total profit
- $-64,677
- Equity at exit
- $55,131
- IRR
- -9.9%
- Equity multiple
- 0.39×
- Total profit
- $-62,872
- Equity at exit
- $31,969
Cash invested: $103,530 (down + closing). Projections, not guarantees.
Landlord ↔ Tenant lean methodology
- Overall (STATE)
- 85 Strongly Landlord-Friendly
- State North Carolina
- 85 Strongly Landlord-Friendly · R+3
- County
- — inherits STATE
- City
- — inherits STATE
ZIP-level market 28732
- Home prices YoY
- -26.8%
- Active inventory
- 208
- Price-to-rent
- 11.2×
Monthly cashflow live
- Estimated rent
- $2,745 medium interval (Pro) →
- Mortgage (P&I)
- −$1,939
- Tax from tax record
- −$115 /mo · $1,380/yr
- Insurance
- −$154
- HOA
- −$33
- Vacancy / Maint / Mgmt
- −$576
- Net cashflow
- $-72
Break-even live
UW: 25.0% down · 7.5% · 30yr · 1.5% tax · 5.0% vac · 8.0% maint · 8.0% mgmt
Financing live
Cash to close
- Down payment
- $92,438
- Closing costs
- $11,092
- Reserves months
- —
- Total cash needed
- —
Loan-product check · same deal, 3 products live
Conventional
25% down · 7.5% · 30yr
- Down + closing
- —
- Monthly P&I
- —
- Monthly cashflow
- —
- DSCR
- —
- Eligible?
- —
Personal DTI + credit; lowest rate.
DSCR
20% down · 8.5% · 30yr
- Down + closing
- —
- Monthly P&I
- —
- Monthly cashflow
- —
- DSCR
- —
- Eligible?
- —
No personal income docs; deal must DSCR.
Hard money
10% down · 12.0% · 12mo
- Down + closing
- —
- Monthly P&I
- —
- Monthly cashflow
- —
- DSCR
- —
- Eligible?
- —
Short-term bridge; refi at stabilization.
Rent comps 3 comps
| Address | Beds | Baths | Sqft | Rent | $/sqft | DOM | Units | Dist |
|---|---|---|---|---|---|---|---|---|
| 93 Foxden Dr Fletcher, NC | 3.0 | 2.0 | 1413 | $2,200 | $1.56 | 23d | 1 | 0.67mi |
| 210 Mud Creek Rd Fletcher, NC | 4.0 | 2.0 | 1477 | $2,595 | $1.76 | 23d | 1 | 1.06mi |
| 1026 Thorncrest Dr Fletcher, NC | 3.0 | 2.0 | 1472 | $2,650 | $1.80 | 13d | 1 | 1.17mi |
HOA detail
- Monthly dues
- $33 · $396/yr
Listing history 6 events
-
2026-05-31status $369,750 Pending 134 DOM
-
2026-05-31days on market $369,750 Active Under Contract 134 DOM
-
2026-05-30days on market $369,750 Active Under Contract 133 DOM
-
2026-05-11historical Active Under Contract
-
2026-04-13price $369,750
-
2026-01-17$375,750 Active
ⓘ Source: listings_history table (triggers on properties + properties_extension) + one-shot
backfill from property_details.listing_events for pre-trigger history.
Tax reassessment forecast NC · Resets to sale price
- Current annual tax
- $1,380 · $115/mo
- Projected year-2 tax
- $3,032 · $253/mo
- Expected delta
- +$1,651/yr (+$138/mo · 119.6%)
ⓘ Screening estimate from a state-policy table — verify with the county assessor before closing.
Climate risk First Street
- Flood 1/10 Low FEMA zone X (unshaded) · 0% chance over 30 yrs
- Wildfire 3/10 Moderate
- Heat 4/10 Moderate 7 d/yr ≥96°F today · 20 d/yr by 30 yrs out
- Wind 2/10 Low
- Air quality 3/10 Moderate 2 unhealthy d/yr today · 3 by 30 yrs out
Nearby sold comps map
Loading sold comps map…
Walkable amenities ~0.75 mi
Loading nearby amenities…
Taxation est. · year 1
- Rental income
- $32,943
- − Mortgage interest
- −$20,712
- − Property taxes
- −$1,380
- − Insurance
- −$1,849
- − Repairs & maintenance
- −$2,635
- − Management
- −$2,635
- − HOA
- −$396
- − Depreciation
- −$10,756
- Taxable loss
- −$7,421
- Est. tax savings @ 24.0%
- +$1,781
- After-tax cash flow
- $913/yr
For passive investors: Depreciation is non-cash, so a rental often shows a tax loss while cash-flowing — sheltering income. Rental losses are passive: they offset passive income freely, and up to $25,000/yr can offset ordinary (W-2) income if you actively participate and your MAGI is under $100k (phasing out to $0 by $150k); unused losses carry forward. On sale, claimed depreciation is recaptured at up to 25%, and gains may owe capital-gains tax (a 1031 exchange can defer both). Figures are a year-1 estimate at your 24.0% rate — not tax advice; consult a CPA.
Schools (NCES district)
- District
- Henderson County Schools
- NCES district ID
- 3702100
- Math proficiency
- 48% ▼ -2.00%
- Reading proficiency
- 52% ▼ -2.00%
- Median HH income
- $47,101
- Composite
- 42.5/100
- National rank
- #3206
- State rank
- #64 of 178 in NC
Livability — Fletcher
- Score
- 70/100
- State rank
- #129
- US rank
- #7485
Category grades
Schools grade is shown separately in the Schools card above.
Census & demographics
- Census place
- Fletcher, NC
- County
- Henderson County · 78,587 people
- City population
- 19,279
- Metro
- Asheville, NC
- Population (ZIP)
- 19,279
- Household income
- $81,852
- Rent vs Own
- Severe rent burden
- 154.0
Population outlook (Henderson County) Hauer SSP2
- Today (2025)
- 124,075 people
- By 2030
- 129,690 · +4.5%
- By 2040
- 139,898 · +12.8%
- By 2050
- 148,298 · +19.5%
- By 2075
- 163,980 · +32.2%
- By 2100
- 166,962 · +34.6%
Race, ethnicity, and origin ACS 2023
- Neighborhood character
- Predominantly White (82%)
- Race & ethnicity
- White 82% Hispanic / Latino 9% Two or more races 5% Black 3% Asian 2%
- Hispanic origin (detail)
- Mexican 4%
- Common ancestry
- Slovak 6% Serbian 4% Lithuanian 3%
- Foreign-born
- 7% · Canada, Vietnam
- Languages at home
- 91% English-only · Spanish 6% Other Indo-European 1% Russian/Polish/Slavic 1%
Political lean MEDSL · Henderson
- 2024 margin
- R (+14.6) · D 42.1% · R 56.7% · Other 1.1%
- 2008→2024 swing
- +6.5pp toward D · 2008: -21.0pp · 2024: -14.6pp
- All cycles
- 2024: R+14.6 2020: R+18.8 2016: R+27.9 2012: R+27.6 2008: R+21.0
Not yet ingested
- Civics
- —
Market trends
- HPI YoY
- ▼ -106.57%
- Current HPI
- 290.4589
- Rent YoY
- —
- Metro
- Asheville, NC
- State GDP YoY
- ▲ 3.28%
- F500 in state
- 26
Industry mix (Fortune 500 HQ in NC)
| Industry | F500 HQs | Revenue |
|---|---|---|
| Financial Services | 2 | $213B |
|
||
| Retail | 2 | $95B |
|
||
| Industrial Conglomerate | 1 | $38B |
|
||
| Metals / Steel | 1 | $35B |
|
||
| Utilities | 1 | $30B |
|
||
| Industrial Machinery | 1 | $19B |
|
||
Price history
-1.6% since first listed3 events — show timeline
- 2026-05-11 Contingent — CANOPYMLS as Distributed by MLS Grid
- 2026-04-13 Price Changed $369,750 CANOPYMLS as Distributed by MLS Grid
- 2026-01-17 Listed $375,750 CANOPYMLS as Distributed by MLS Grid
Property tax history
+52.1%/yrLatest (2025): $1,380 · +0.0% YoY. Source: county tax records.
Cash-flow waterfall
monthlySold comps — $/sqft
last 12 mo · ≤1 miLoading sold comps…