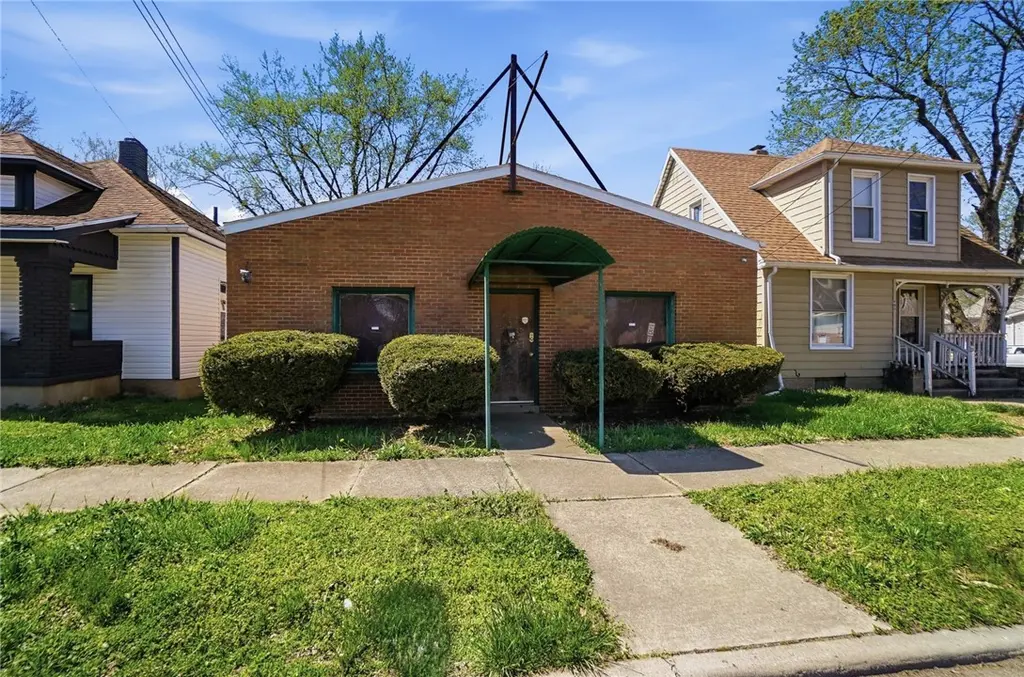
902 Crawford St · Middletown, OH
Flood risk No data
- FEMA flood zone
- —
- Chance of flooding over 30 yrs
- —
- Est. flood insurance / yr
- —
Fire risk No data
- Est. fire insurance / yr
- —
Heat risk No data
- Hot days now (above threshold)
- —
- Hot days in 30 yrs
- —
Wind risk No data
- Chance of severe wind over 30 yrs
- —
Air-quality risk No data
- Unhealthy air days now
- —
- Unhealthy air days in 30 yrs
- —
Risk factors via First Street. Map © Google.
Why this score? — see what drove the F grade
The composite is a weighted blend of 9 inputs, each scored 0–100. Each bar is that input's sub-score; the figure is the points it added to the 100-point composite (weight × sub-score).
- Cash flow +8.2/30.0
- ARV discount +7.5/15.0
- Rent growth +4.1/5.0
- Livability +3.6/5.0
- Condition / age +2.5/5.0
- 1% rule +2.2/10.0
- DSCR +2.2/10.0
- Schools +2.0/10.0
- Appreciation +0.0/10.0
$249,900
🖨 Deal sheet 📄 Offer letter ✓ Due diligence
Listing remarks MLS
Your vision awaits in this 8,000 square foot property. Currently divided as a duplex, the possibilities are endless with large open rooms, custom tile, expansive closets, and an indoor pool/spa. Private parking in rear of building.
Key facts
- Private parking
- Indoor pool spa
- 0.35 acre lot
Tags
Property features AI
Finance
- Financial info: Two total units; Unit 2 currently rents for $500
Exterior
- Parking: Off-street parking; On-street parking
- Utilities: Public water; Public sewer; Natural gas
- Home design: Duplex; Two levels; Slab foundation
- Construction: Block construction; Membrane roof
- Exterior features: Wood windows; Residential zoning
Interior
- Bedrooms: One 1-bedroom unit; One 2-bedroom unit
- Bathrooms: Unit 1 has two full bathrooms and one partial bathroom; Unit 2 has one full bathroom
- Heating & cooling: Forced air heating (gas); Window air conditioning units
- Interior features: No fireplace
Neighborhood map
What this means for you Summary
Snapshot
- This is a 3-bed/3.5-bath single-family listed at $250k.
Deal economics
- At list price, monthly cash flow is $-237 ($-3k/yr) — negative.
- To cash-flow at today's rent, offer at most $208k (16.8% below list).
- To meet the 1% rule (rent ≥ 1% of price), the offer needs to be $180k (28.0% below list).
- Recommended offer: $180k (28.0% below list) — sets the bar for 1% rule.
Location & tenants
- Location reads 72/100 on livability (#389 in OH) — a middle-class / working-renter tenant base. Strengths: cost of living A+, housing A+, health & safety A+; Watch: schools D+, crime D+, amenities D+.
- Middletown City (suburban): math 21% / reading 28% proficiency, ranked #610 of 656 in OH (top 93%) — low school quality limits family demand, transient renter base, plan for 1-2y turnover; 69% free/reduced lunch — lower-income household profile, screen leases tightly.
- Market conditions: Rents rising fast (+6.3%/yr); 203 active listings in the ZIP; 1,163 units permitted in Butler County in 2024 (356 in 5+ unit buildings).
Forward outlook
- Local home prices are declining (-3.0%/yr); year-one equity from $2k of loan paydown is wiped out by about $7k of value loss. Plan a longer hold.
Negotiation context
- It's been on market 37 days — a 3% lower offer ($242k) is reasonable based on typical stale-listing flexibility.
- 2 sale attempts with the ask held roughly flat each time — persistent listings suggest the price (not the market) is what's stuck; bring a comps-based counter.
Risks & watch-outs
- Watch-outs: built in 1920 — expect roof / HVAC / electrical / plumbing capex.
Questions for the listing agent
- What do current leases actually rent for vs. the listed asking? Can we see a recent rent roll and the last 12 months of T-12 income?
- It's been on market 37 days. Have you received any prior offers? Is the seller open to a 28% concession, seller financing, or rate buy-down credit?
- Built in 1920 — when were the roof, HVAC, electrical panel, plumbing, and water heater last replaced?
- Is there a deadline driving the sale (1031 exchange, divorce, estate, relocation)? That informs how much negotiation room exists.
- Schools are D-rated, which usually means shorter tenancies and higher turnover. Who's the typical renter profile here, and what's been the actual vacancy rate?
- Crime grade is D in this area — have there been break-ins, vandalism, or insurance claims at this property in the last 3 years? What carrier currently insures it and at what premium?
- The area grade is low — what's the realistic commute time and amenity access for the typical tenant pool here? Any planned neighborhood developments (good or bad) we should know about?
- What's the average days-on-market for RENTAL listings here right now (not sales)? A rising rental-DOM trend means longer vacancies and softer asking-rent achievability than the comps imply.
- What's the recent tenant-quality profile in this submarket — average credit score on applications, eviction rate, late-payment / NSF rate, and stable-employment percentage? A property-management company in the area should have these aggregated.
- How much new for-sale + rental construction is in the pipeline within 1–3 miles? Heavy new supply typically softens prices + rents 12–24 months out; constrained supply supports both.
Investment metrics
- 1% rule
- 0.72% ✗
- Cap rate
- 5.15%
- Cash-on-cash
- -4.07%
- DSCR
- 0.82
- GRM
- 11.6
CMA / ARV
- ARV (median comp)
- $153,553
- List price
- $249,900
- Delta
- 62.74%
- Verdict
- OVERPRICED
- Comps
- 20 within 1.0 mi
Projected returns pro-forma
-3.0% appreciation · 6.31% rent growth · sell at horizon
- IRR
- -19.7%
- Equity multiple
- 0.29×
- Total profit
- $-49,416
- Equity at exit
- $37,261
- IRR
- -7.0%
- Equity multiple
- 0.50×
- Total profit
- $-35,334
- Equity at exit
- $21,607
Cash invested: $69,972 (down + closing). Projections, not guarantees.
Landlord ↔ Tenant lean methodology
- Overall (STATE)
- 73 Landlord-Friendly
- State Ohio
- 73 Landlord-Friendly · R+6
- County
- — inherits STATE
- City
- — inherits STATE
ZIP-level market 45044
- Rents YoY
- 6.3%
- Active inventory
- 203
- Price-to-rent
- 11.6×
Monthly cashflow live
- Estimated rent
- $1,799 medium interval (Pro) →
- Mortgage (P&I)
- −$1,311
- Tax from tax record
- −$244 /mo · $2,928/yr
- Insurance
- −$104
- HOA
- −$0
- Vacancy / Maint / Mgmt
- −$378
- Net cashflow
- $-237
Break-even live
UW: 25.0% down · 7.5% · 30yr · 1.5% tax · 5.0% vac · 8.0% maint · 8.0% mgmt
Financing live
Cash to close
- Down payment
- $62,475
- Closing costs
- $7,497
- Reserves months
- —
- Total cash needed
- —
Loan-product check · same deal, 3 products live
Conventional
25% down · 7.5% · 30yr
- Down + closing
- —
- Monthly P&I
- —
- Monthly cashflow
- —
- DSCR
- —
- Eligible?
- —
Personal DTI + credit; lowest rate.
DSCR
20% down · 8.5% · 30yr
- Down + closing
- —
- Monthly P&I
- —
- Monthly cashflow
- —
- DSCR
- —
- Eligible?
- —
No personal income docs; deal must DSCR.
Hard money
10% down · 12.0% · 12mo
- Down + closing
- —
- Monthly P&I
- —
- Monthly cashflow
- —
- DSCR
- —
- Eligible?
- —
Short-term bridge; refi at stabilization.
Listing history 14 events
-
2026-06-18days on market $249,900 Active 37 DOM
-
2026-06-17days on market $249,900 Active 36 DOM
-
2026-06-16days on market $249,900 Active 35 DOM
-
2026-06-15days on market $249,900 Active 34 DOM
-
2026-06-13days on market $249,900 Active 32 DOM
-
2026-06-09days on market $249,900 Active 28 DOM
-
2026-06-08days on market $249,900 Active 27 DOM
-
2026-06-07days on market $249,900 Active 26 DOM
-
2026-06-03days on market $249,900 Active 22 DOM
-
2026-06-02days on market $249,900 Active 21 DOM
-
2026-06-01days on market $249,900 Active 20 DOM
-
2026-05-31days on market $249,900 Active 19 DOM
-
2026-05-13$249,900 Active 231-char remark
Show marketing remark (231 chars)
Your vision awaits in this 8,000 square foot property. Currently divided as a duplex, the possibilities are endless with large open rooms, custom tile, expansive closets, and an indoor pool/spa. Private parking in rear of building.
-
2026-05-11$249,900 Active 231-char remark
ⓘ Source: listings_history table (triggers on properties + properties_extension) + one-shot
backfill from property_details.listing_events for pre-trigger history.
Tax reassessment forecast OH · Partial reset (capped growth)
- Current annual tax
- $2,928 · $244/mo
- Projected year-2 tax
- $3,413 · $284/mo
- Expected delta
- +$485/yr (+$40/mo · 16.6%)
ⓘ Screening estimate from a state-policy table — verify with the county assessor before closing.
Nearby sold comps map
Loading sold comps map…
Walkable amenities ~0.75 mi
Loading nearby amenities…
Taxation est. · year 1
- Rental income
- $21,594
- − Mortgage interest
- −$13,998
- − Property taxes
- −$2,928
- − Insurance
- −$1,250
- − Repairs & maintenance
- −$1,727
- − Management
- −$1,727
- − Depreciation
- −$7,270
- Taxable loss
- −$7,307
- Est. tax savings @ 24.0%
- +$1,754
- After-tax cash flow
- $-1,091/yr
For passive investors: Depreciation is non-cash, so a rental often shows a tax loss while cash-flowing — sheltering income. Rental losses are passive: they offset passive income freely, and up to $25,000/yr can offset ordinary (W-2) income if you actively participate and your MAGI is under $100k (phasing out to $0 by $150k); unused losses carry forward. On sale, claimed depreciation is recaptured at up to 25%, and gains may owe capital-gains tax (a 1031 exchange can defer both). Figures are a year-1 estimate at your 24.0% rate — not tax advice; consult a CPA.
Schools (NCES district)
- District
- Middletown City
- NCES district ID
- 3904440
- Math proficiency
- 21% ▼ -17.00%
- Reading proficiency
- 28% ▼ -15.00%
- Median HH income
- $36,650
- Composite
- 20.35/100
- National rank
- #8605
- State rank
- #610 of 656 in OH
Livability — Middletown
- Score
- 72/100
- State rank
- #389
- US rank
- #6338
Category grades
Schools grade is shown separately in the Schools card above.
Census & demographics
- Census place
- Middletown, OH
- County
- Butler County · 381,674 people
- City population
- 96,117
- Metro
- Cincinnati, OH-KY-IN
- Population (ZIP)
- 56,217
- Household income
- $73,732
- Rent vs Own
- Severe rent burden
- 1532.0
Population outlook (Butler County) Hauer SSP2
- Today (2025)
- 387,706 people
- By 2030
- 392,028 · +1.1%
- By 2040
- 395,307 · +2.0%
- By 2050
- 391,116 · +0.9%
- By 2075
- 378,642 · -2.3%
- By 2100
- 343,248 · -11.5%
Race, ethnicity, and origin ACS 2023
- Neighborhood character
- Predominantly White (72%)
- Race & ethnicity
- White 72% Black 12% Two or more races 8% Hispanic / Latino 7% Asian 2%
- Hispanic origin (detail)
- Mexican 2% Dominican 1%
- Common ancestry
- Slovak 2% Italian 2% Romanian 2%
- Foreign-born
- 6% · Canada
- Languages at home
- 92% English-only · Spanish 4% Other Indo-European 1% Tagalog/Filipino 1%
Political lean MEDSL · Butler
- 2024 margin
- Strong R (+26.3) · D 36.4% · R 62.7%
- 2008→2024 swing
- -3.6pp toward R · 2008: -22.6pp · 2024: -26.3pp
- All cycles
- 2024: R+26.3 2020: R+24.0 2016: R+28.3 2012: R+26.2 2008: R+22.6
Not yet ingested
- Civics
- —
Market trends
- HPI YoY
- ▼ -164.07%
- Current HPI
- 219.0479
- Rent YoY
- ▲ 6.31%
- Metro
- Cincinnati, OH-KY-IN
- State GDP YoY
- ▲ 1.98%
- F500 in state
- 48
Industry mix (Fortune 500 HQ in OH)
| Industry | F500 HQs | Revenue |
|---|---|---|
| Insurance | 3 | $145B |
|
||
| Industrial Machinery | 3 | $49B |
|
||
| Financial Services | 3 | $24B |
|
||
| Consumer Goods | 2 | $93B |
|
||
| Aerospace / Defense | 2 | $47B |
|
||
| Utilities | 2 | $33B |
|
||
Price history
+0.0% since first listed2 events — show timeline
- 2026-05-13 Listed $249,900 Dayton MLS
- 2026-05-11 Listed $249,900 Cincy MLS
Property tax history
-8.4%/yrLatest (2023): $2,928 · +25.2% YoY. Source: county tax records.
Cash-flow waterfall
monthlySold comps — $/sqft
last 12 mo · ≤1 miLoading sold comps…