340 Sherman Hill Rd · Afton, NY
Flood risk 1/10 · Minimal
- FEMA flood zone
- —
- Chance of flooding over 30 yrs
- 0.0%
- Est. flood insurance / yr
- —
Fire risk 1/10 · Minimal
- Est. fire insurance / yr
- $691 – $1,283
Heat risk 1/10 · Minimal
- Hot days now (above 89°F)
- 6 days/yr
- Hot days in 30 yrs
- 13 days/yr
Wind risk 2/10 · Minimal
- Chance of severe wind over 30 yrs
- 1.0%
Air-quality risk 2/10 · Minimal
- Unhealthy air days now
- 0 days/yr
- Unhealthy air days in 30 yrs
- 1 days/yr
Risk factors via First Street. Map © Google.
Why this score? — see what drove the C+ grade
The composite is a weighted blend of 9 inputs, each scored 0–100. Each bar is that input's sub-score; the figure is the points it added to the 100-point composite (weight × sub-score).
- Cash flow +22.0/30.0
- Appreciation +10.0/10.0
- ARV discount +7.5/15.0
- DSCR +7.0/10.0
- 1% rule +5.0/10.0
- Schools +4.1/10.0
- Livability +3.1/5.0
- Rent growth +2.5/5.0
- Condition / age +2.5/5.0
$174,900
🖨 Deal sheet (PDF) 📄 Offer letter ✓ Due diligence
Listing remarks
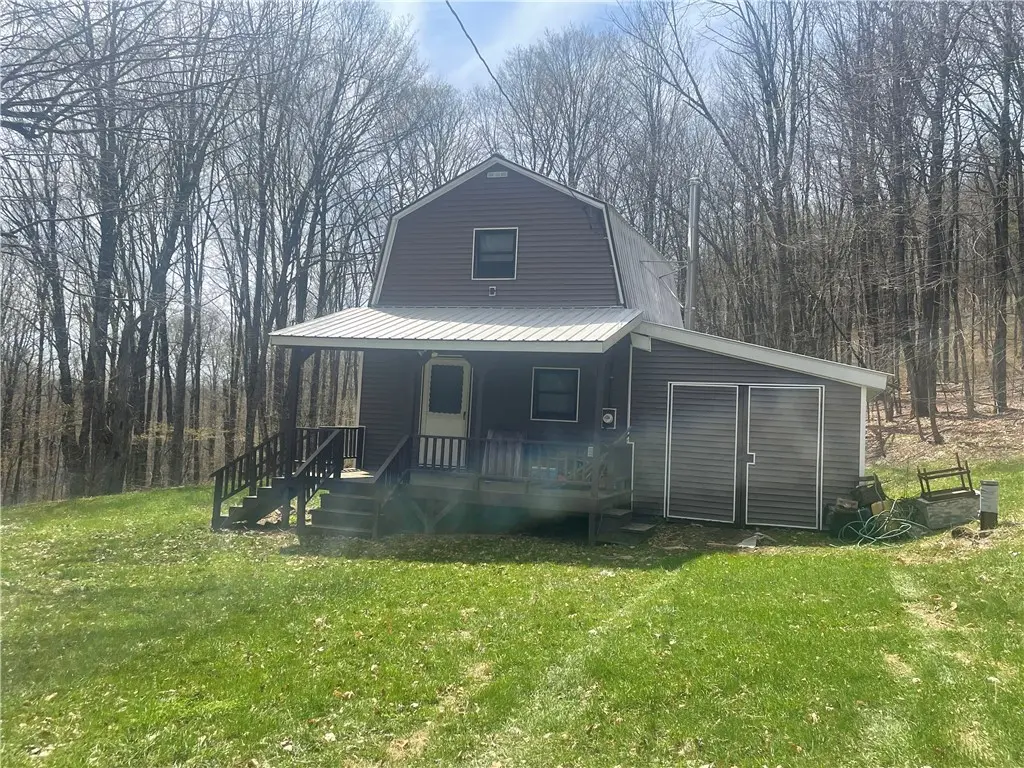
UPSTATE NEW YORK GETAWAY. .. 2 Bedroom, 1.5 Bath Rural Cabin with full electric, well and septic. 2 story with open floor plan. Front covered entrance deck. Woodstove in Living room heats the entire cabin with electric baseboard heat as your back-up. Large lawn on 33 mostly wooded acres. Cabin sits well back from the Town maintained road offering seclusion. State land nearby in addition to Oquaga Creek State Park just down the road a short ride. LISTED UNDER APPRAISED VALUE!!
Key facts
- Large lawn
- State land nearby
- 33 acre lot
Tags
Property features AI
Exterior
- Parking: Attached garage with 1 space
- Utilities: Electricity connected; Well water
- Home design: Two-story house; Existing/previously built property
- Construction: Vinyl siding; Metal roof; Poured foundation; Resale condition
- Exterior features: Deck; Dirt driveway; Rectangular, secluded, wooded rural lot
Interior
- Kitchen: Electric oven; Electric range; Refrigerator
- Bedrooms: One main-level bedroom
- Flooring: Vinyl; Varied flooring
- Bathrooms: One full bathroom; One half bathroom; One main-level bathroom
- Heating & cooling: Electric heating; Baseboard heating; Wood stove/wood heating
- Interior features: Separate/formal living room; Kitchen/family room combo; Living/dining room; Bedroom on main level; Crawl space basement; One fireplace
- Laundry & utility: Electric water heater
Neighborhood map
What this means for you Summary
Snapshot
- This is a 3-bed/1.0-bath single-family listed at $175k.
Deal economics
- At list price, monthly cash flow is $279 ($3k/yr) — positive.
- The deal already cash-flows at list — no discount required.
- To meet the 1% rule (rent ≥ 1% of price), the offer needs to be $174k (0.3% below list).
- Recommended offer: $174k (0.3% below list) — sets the bar for 1% rule.
Location & tenants
- Location reads 62/100 on livability (#876 in NY) — a middle-class / working-renter tenant base. Strengths: cost of living A+, housing A+, crime A-; Watch: health & safety D, amenities F, commute F.
- Bainbridge-Guilford Central School District (rural): math 40% / reading 57% proficiency, ranked #418 of 590 in NY (top 71%) — families likely to look elsewhere, expect single-tenant / working-renter base with shorter leases.
- Zoned schools: Greenlawn Elementary School (math 27% / reading 57%, grade F, #1,361 of 2,108 statewide, top 67%, 277 students, 52% FRL); Bainbridge-Guilford High School (math 57% / reading 57%, grade C, #887 of 1,100 statewide, top 82%, 362 students, 44% FRL).
- Market conditions: 26 active listings in the ZIP; 340 units permitted in Broome County in 2024 (269 in 5+ unit buildings).
Forward outlook
- In year one you build about $19k of equity ($1k loan paydown + $17k appreciation (10.0% local appreciation)).
- Broome County population projected at -13% by 2050 — secular population decline; favor cash flow + early exit over multi-decade hold.
- At projected returns (10.0% appreciation + 3.0% rent growth), your $49k cash investment doubles in ~3 years — after that, you're playing with house money.
- By year 2, paydown + projected appreciation supports a ~$30k cash-out refi (75% LTV) — recoverable capital for the next deal without selling this one.
Negotiation context
- Only 8 days on market — expect competitive offers; lowballing is unlikely to land.
- 2 sale attempts since 2y ago with the ask held roughly flat each time — persistent listings suggest the price (not the market) is what's stuck; bring a comps-based counter.
Risks & watch-outs
- Watch-outs: built in 1958 — expect roof / HVAC / electrical / plumbing capex.
Questions for the listing agent
- Built in 1958 — when were the roof, HVAC, electrical panel, plumbing, and water heater last replaced?
- Is there a deadline driving the sale (1031 exchange, divorce, estate, relocation)? That informs how much negotiation room exists.
- Schools are D-rated, which usually means shorter tenancies and higher turnover. Who's the typical renter profile here, and what's been the actual vacancy rate?
- What's the average days-on-market for RENTAL listings here right now (not sales)? A rising rental-DOM trend means longer vacancies and softer asking-rent achievability than the comps imply.
- What's the recent tenant-quality profile in this submarket — average credit score on applications, eviction rate, late-payment / NSF rate, and stable-employment percentage? A property-management company in the area should have these aggregated.
- How much new for-sale + rental construction is in the pipeline within 1–3 miles? Heavy new supply typically softens prices + rents 12–24 months out; constrained supply supports both.
Investment metrics
- 1% rule
- 1.00% ✗
- Cap rate
- 8.21%
- Cash-on-cash
- 6.84%
- DSCR
- 1.30
- GRM
- 8.4
CMA / ARV
No comps found within radius.
Projected returns pro-forma
10.0% appreciation · 3.0% rent growth · sell at horizon
- IRR
- 29.2%
- Equity multiple
- 3.31×
- Total profit
- $113,001
- Equity at exit
- $157,564
- IRR
- 25.4%
- Equity multiple
- 7.51×
- Total profit
- $318,697
- Equity at exit
- $339,792
Cash invested: $48,972 (down + closing). Projections, not guarantees.
Landlord ↔ Tenant lean methodology
- Overall (STATE)
- 15 Strongly Tenant-Friendly
- State New York
- 15 Strongly Tenant-Friendly · D+10
- County
- — inherits STATE
- City
- — inherits STATE
ZIP-level market 13730
- Home prices YoY
- 3.9%
- Active inventory
- 26
- Price-to-rent
- 8.4×
Monthly cashflow live
- Estimated rent
- $1,743 medium interval (Pro) →
- Mortgage (P&I)
- −$917
- Tax from tax record
- −$108 /mo · $1,291/yr
- Insurance
- −$73
- HOA
- −$0
- Vacancy / Maint / Mgmt
- −$366
- Net cashflow
- $279
Break-even live
Sensitivity live
| Price | -10% $378 | -5% $329 | +0% $279 | +5% $230 | +10% $180 |
|---|---|---|---|---|---|
| Rent | -10% $142 | -5% $210 | +0% $279 | +5% $348 | +10% $417 |
| Rate | -1.0pp $367 | -0.5pp $324 | base $279 | +0.5pp $234 | +1.0pp $188 |
UW: 25.0% down · 7.5% · 30yr · 1.5% tax · 5.0% vac · 8.0% maint · 8.0% mgmt
Financing live
Cash to close
- Down payment
- $43,725
- Closing costs
- $5,247
- Reserves months
- —
- Total cash needed
- —
Loan-product check · same deal, 3 products live
Conventional
25% down · 7.5% · 30yr
- Down + closing
- —
- Monthly P&I
- —
- Monthly cashflow
- —
- DSCR
- —
- Eligible?
- —
Personal DTI + credit; lowest rate.
DSCR
20% down · 8.5% · 30yr
- Down + closing
- —
- Monthly P&I
- —
- Monthly cashflow
- —
- DSCR
- —
- Eligible?
- —
No personal income docs; deal must DSCR.
Hard money
10% down · 12.0% · 12mo
- Down + closing
- —
- Monthly P&I
- —
- Monthly cashflow
- —
- DSCR
- —
- Eligible?
- —
Short-term bridge; refi at stabilization.
Listing history 4 events
-
2026-05-06status Pending 480-char remark
-
2026-04-27$174,900 Active 480-char remark
-
2026-01-01historical
-
2024-04-08$350,000 Active
ⓘ Source: listings_history table (triggers on properties + properties_extension) + one-shot
backfill from property_details.listing_events for pre-trigger history.
Tax reassessment forecast NY · Partial reset (capped growth)
- Current annual tax
- $1,291 · $108/mo
- Projected year-2 tax
- $2,123 · $177/mo
- Expected delta
- +$832/yr (+$69/mo · 64.5%)
ⓘ Screening estimate from a state-policy table — verify with the county assessor before closing.
Climate risk First Street
- Flood 1/10 Low 0% chance over 30 yrs
- Wildfire 1/10 Low
- Heat 1/10 Low 6 d/yr ≥89°F today · 13 d/yr by 30 yrs out
- Wind 2/10 Low 100% chance of damaging wind over 30 yrs
- Air quality 2/10 Low 0 unhealthy d/yr today · 1 by 30 yrs out
Nearby sold comps map
Loading sold comps map…
Walkable amenities ~0.75 mi
Loading nearby amenities…
Taxation est. · year 1
- Rental income
- $20,915
- − Mortgage interest
- −$9,797
- − Property taxes
- −$1,291
- − Insurance
- −$874
- − Repairs & maintenance
- −$1,673
- − Management
- −$1,673
- − Depreciation
- −$5,088
- Taxable income
- $518
- Est. tax owed @ 24.0%
- −$124
- After-tax cash flow
- $3,227/yr
For passive investors: Depreciation is non-cash, so a rental often shows a tax loss while cash-flowing — sheltering income. Rental losses are passive: they offset passive income freely, and up to $25,000/yr can offset ordinary (W-2) income if you actively participate and your MAGI is under $100k (phasing out to $0 by $150k); unused losses carry forward. On sale, claimed depreciation is recaptured at up to 25%, and gains may owe capital-gains tax (a 1031 exchange can defer both). Figures are a year-1 estimate at your 24.0% rate — not tax advice; consult a CPA.
Schools (NCES district)
- District
- Bainbridge-Guilford Central School District
- NCES district ID
- 3603810
- Math proficiency
- 40% ▼ -14.00%
- Reading proficiency
- 57% ▲ 5.00%
- Median HH income
- $48,248
- Composite
- 41.31/100
- National rank
- #3511
- State rank
- #418 of 590 in NY
Livability — Afton
- Score
- 62/100
- State rank
- #876
- US rank
- #16945
Category grades
Schools grade is shown separately in the Schools card above.
Census & demographics
- City population
- 2,763
- Population (ZIP)
- 2,763
Population outlook (Broome County) Hauer SSP2
- Today (2025)
- 187,989 people
- By 2030
- 183,066 · -2.6%
- By 2040
- 172,228 · -8.4%
- By 2050
- 163,161 · -13.2%
- By 2075
- 153,641 · -18.3%
- By 2100
- 140,851 · -25.1%
Race, ethnicity, and origin ACS 2023
- Neighborhood character
- Predominantly White (93%)
- Race & ethnicity
- White 93% Two or more races 4% Hispanic / Latino 2%
- Common ancestry
- Iranian 5% Serbian 3% Romanian 3%
- Foreign-born
- 2% · Canada, China
- Languages at home
- 98% English-only · German/W. Germanic 1% Spanish 1%
Political lean MEDSL · Broome
- 2024 margin
- Toss-up / Even · D 50.2% · R 49.8%
- 2008→2024 swing
- -7.6pp toward R · 2008: 8.0pp · 2024: 0.4pp
- All cycles
- 2024: D+0.4 2020: D+3.5 2016: R+3.7 2012: D+4.6 2008: D+8.0
Not yet ingested
- Civics
- —
Market trends
- HPI YoY
- ▲ 12.25%
- Current HPI
- 325.5182
- Rent YoY
- —
- Metro
- —
- State GDP YoY
- ▲ 2.60%
- F500 in state
- 92
Industry mix (Fortune 500 HQ in NY)
| Industry | F500 HQs | Revenue |
|---|---|---|
| Financial Services | 10 | $950B |
|
||
| Consumer Goods | 9 | $162B |
|
||
| Insurance | 4 | $225B |
|
||
| Telecommunications | 2 | $144B |
|
||
| Pharmaceuticals | 2 | $112B |
|
||
| Media / Entertainment | 2 | $69B |
|
||
Price history
-50.0% since first listed4 events — show timeline
- 2026-05-06 Pending — UNYREIS
- 2026-04-27 Listed $174,900 UNYREIS
- 2026-01-01 Listing Removed — OneKey® MLS as Distributed by MLS Grid
- 2024-04-08 Listed $350,000 OneKey® MLS as Distributed by MLS Grid
Property tax history
-7.9%/yrLatest (2025): $1,291 · +1.2% YoY. Source: county tax records.
Cash-flow waterfall
monthlySold comps — $/sqft
last 12 mo · ≤1 miLoading sold comps…