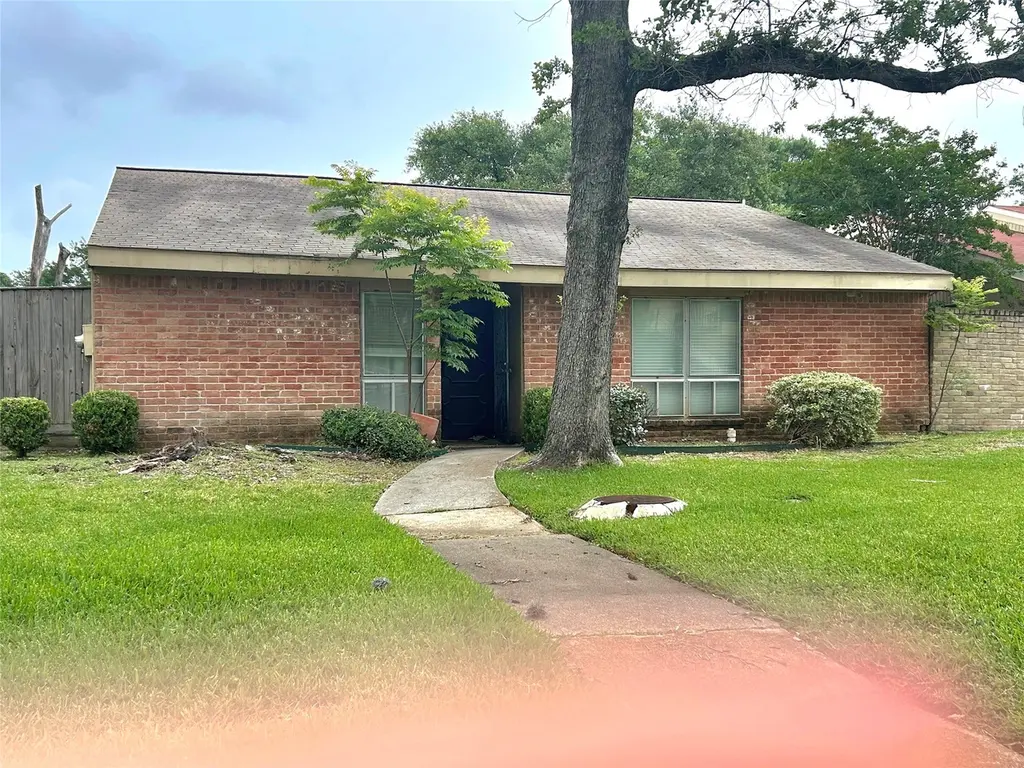
4803 Pebble Brook St · Baytown, TX
Flood risk 4/10 · Minor
- FEMA flood zone
- X (unshaded)
- Chance of flooding over 30 yrs
- 0.22%
- Est. flood insurance / yr
- $507 – $1,088
Fire risk 1/10 · Minimal
- Est. fire insurance / yr
- $1,222 – $2,270
Heat risk 8/10 · Major
- Hot days now (above threshold)
- —
- Hot days in 30 yrs
- —
Wind risk 9/10 · Severe
- Chance of severe wind over 30 yrs
- 99.0%
Air-quality risk 2/10 · Minimal
- Unhealthy air days now
- 1 days/yr
- Unhealthy air days in 30 yrs
- 2 days/yr
Risk factors via First Street. Map © Google.
Why this score? — see what drove the B- grade
The composite is a weighted blend of 9 inputs, each scored 0–100. Each bar is that input's sub-score; the figure is the points it added to the 100-point composite (weight × sub-score).
- Cash flow +30.0/30.0
- 1% rule +10.0/10.0
- DSCR +10.0/10.0
- ARV discount +7.5/15.0
- Livability +3.5/5.0
- Schools +3.2/10.0
- Rent growth +2.9/5.0
- Condition / age +2.5/5.0
- Appreciation +0.0/10.0
$95,900
🖨 Deal sheet 📄 Offer letter ✓ Due diligence
Listing remarks MLS
The search is over! Lovely 2/2/2 w/ hardwood bamboo flooring throughout living areas! Formal living room w/ half vaulted ceiling! The family room is great for entertaining & features a wood burning fireplace! Whip up delicious meals in the kitchen equipped w/ granite counter tops & a serving bar! Retire after a long day to the spacious master suite boasting 2 walk-in closets & master bath w/ tile flooring & dbl sinks! Huge secondary bedroom w/ walk-in closet! Covered tile back patio! Call Now!
Key facts
- 3,497 sq ft lot
- 2 garage spots
- Built 1975
Property features AI
Finance
- HOA & community: Shady Hill association with $800 annual fee
Exterior
- Parking: Attached 2-car garage
- Utilities: Public water; Public sewer
- Home design: Residential property; One-story entry (first floor living areas shown)
- Construction: Built in 1975; Wood siding exterior; Composition roof; Slab foundation
- Exterior features: Asphalt road frontage
Interior
- Kitchen: Electric cooktop; Electric oven; Disposal
- Bedrooms: Bedroom on first floor (16x12); Bedroom on first floor (16x14)
- Bathrooms: 2 full bathrooms
- Heating & cooling: Central heating (electric); Central air conditioning (electric)
- Interior features: Wood-burning fireplace (1); Seller disclosure available
- Laundry & utility: Washer hookup; Electric dryer hookup; Utility room (other level)
Neighborhood map
What this means for you Summary
Snapshot
- This is a 2-bed/2.0-bath single-family listed at $96k.
Deal economics
- At list price, monthly cash flow is $479 ($6k/yr) — positive.
- The deal already cash-flows at list — no discount required.
- Meets the 1% rule at list price ($2k rent vs $96k).
- Recommended offer: $93k (3.0% below list) — sets the bar for market timing.
- Cap rate 12.3% vs local median 4.2% in Baytown — top-decile yield for the area; either an underpriced asset or a hidden risk that comps aren't pricing in. Stress-test before assuming the spread holds.
Location & tenants
- Location reads 69/100 on livability (#412 in TX) — a middle-class / working-renter tenant base. Strengths: cost of living A+, housing A+; Watch: employment D+, crime F, amenities F.
- Goose Creek CISD (urban): math 37% / reading 36% proficiency, ranked #473 of 826 in TX (top 57%) — families likely to look elsewhere, expect single-tenant / working-renter base with shorter leases; 61% free/reduced lunch — lower-income household profile, screen leases tightly.
- Zoned schools: High Point School (12 students, 75% FRL).
- Market conditions: Rents rising (+1.5%/yr); 612 active listings in the ZIP; 6 comparable units currently listed for rent nearby; rentals lingering (median 44d on market — plan ~5-8 weeks vacancy on turnover, expect pricing pressure); 50% of comp listings sitting > 30 days — soft ceiling on asking rent; 29,883 units permitted in Harris County in 2024 (8,621 in 5+ unit buildings).
Forward outlook
- Local home prices are declining (-3.0%/yr); year-one equity from $663 of loan paydown is wiped out by about $3k of value loss. Plan a longer hold.
- Harris County population projected at +47% by 2050 — long-run rental-demand tailwind backs the buy-and-hold thesis.
- At projected returns (-3.0% appreciation + 1.5% rent growth), your $27k cash investment doubles in ~7 years — after that, you're playing with house money.
Negotiation context
- It's been on market 38 days — a 3% lower offer ($93k) is reasonable based on typical stale-listing flexibility.
- 7 sale attempts since 17y ago with the ask held roughly flat each time — persistent listings suggest the price (not the market) is what's stuck; bring a comps-based counter.
Risks & watch-outs
- Watch-outs: property tax is 3.6% of price.
- Climate carrying-cost: severe wind risk, 99% chance of damaging wind over 30y — expect insurance premiums to compound above CPI over the hold.
Questions for the listing agent
- It's been on market 38 days. Have you received any prior offers? Is the seller open to a 3% concession, seller financing, or rate buy-down credit?
- Built in 1975 — when were the roof, HVAC, electrical panel, plumbing, and water heater last replaced?
- Property tax is high relative to price — has the assessment been appealed recently, and will the sale trigger a re-assessment?
- What does the HOA fee cover, when was the last increase, and are there any pending special assessments or reserve-fund shortfalls?
- Is there a deadline driving the sale (1031 exchange, divorce, estate, relocation)? That informs how much negotiation room exists.
- Schools are D-rated, which usually means shorter tenancies and higher turnover. Who's the typical renter profile here, and what's been the actual vacancy rate?
- Crime grade is F in this area — have there been break-ins, vandalism, or insurance claims at this property in the last 3 years? What carrier currently insures it and at what premium?
- What's the average days-on-market for RENTAL listings here right now (not sales)? A rising rental-DOM trend means longer vacancies and softer asking-rent achievability than the comps imply.
- What's the recent tenant-quality profile in this submarket — average credit score on applications, eviction rate, late-payment / NSF rate, and stable-employment percentage? A property-management company in the area should have these aggregated.
- How much new for-sale + rental construction is in the pipeline within 1–3 miles? Heavy new supply typically softens prices + rents 12–24 months out; constrained supply supports both.
Investment metrics
- 1% rule
- 1.81% ✓
- Cap rate
- 12.29%
- Cash-on-cash
- 21.40%
- DSCR
- 1.95
- GRM
- 4.6
CMA / ARV
- ARV (median comp)
- $244,046
- List price
- $95,900
- Delta
- -60.70%
- Verdict
- UNDERPRICED
- Comps
- 20 within 1.0 mi
Show comp detail 12 sales within ~0.75 mi
| Address | Dist | Beds/Ba | Sqft | Sold | Price | $/sf | Match |
|---|---|---|---|---|---|---|---|
| 4800 Oak Hollow St | 0.06mi | 2/2.0 | 1,488 (-6%) | 2mo | $149,999 | $101 | 85 |
| 4809 Forest Ct | 0.10mi | 2/2.0 | 1,449 (-9%) | 7mo | $175,000 | $121 | 75 |
| 4804 Oak Hollow St | 0.06mi | 3/2.5 (+1) | 1,607 (+1%) | 16mo | $165,000 | $103 | 75 |
| 4019 Spurwing Ln | 0.49mi | 3/2.0 (+1) | 1,494 (-6%) | 1mo | $230,000 | $154 | 62 |
| 3910 Egyptian Goose Ct | 0.40mi | 3/2.0 (+1) | 1,568 (-1%) | 17mo | $249,900 | $159 | 60 |
| 2914 Canadian Goose Ln | 0.52mi | 3/2.0 (+1) | 1,603 (+1%) | 14mo | $276,000 | $172 | 57 |
| 4007 Dusky Goose Ln | 0.41mi | 3/2.0 (+1) | 1,477 (-7%) | 10mo | $239,900 | $162 | 56 |
| 3242 Specklebelly Dr | 0.47mi | 3/2.0 (+1) | 1,477 (-7%) | 9mo | $235,000 | $159 | 54 |
| 3926 Hybrid Ct | 0.32mi | 3/2.0 (+1) | 1,770 (+12%) | 9mo | $255,000 | $144 | 53 |
| 4019 Cape Barren Ln | 0.49mi | 3/2.0 (+1) | 1,374 (-14%) | 5mo | $229,999 | $167 | 46 |
| 4517 Coachman Dr | 0.69mi | 3/2.0 (+1) | 1,760 (+11%) | 11mo | $230,000 | $131 | 35 |
| 2810 Specklebelly Dr | 0.68mi | 3/2.0 (+1) | 1,804 (+14%) | 16mo | $300,000 | $166 | 28 |
Match score weights: distance 35% · size 25% · config 20% · recency 20%. Top-matched comps best support the ARV.
Projected returns pro-forma
-3.0% appreciation · 1.48% rent growth · sell at horizon
- IRR
- 12.0%
- Equity multiple
- 1.47×
- Total profit
- $12,515
- Equity at exit
- $14,299
- IRR
- 19.5%
- Equity multiple
- 2.51×
- Total profit
- $40,441
- Equity at exit
- $8,292
Cash invested: $26,852 (down + closing). Projections, not guarantees.
Landlord ↔ Tenant lean methodology
- Overall (STATE)
- 87 Strongly Landlord-Friendly
- State Texas
- 87 Strongly Landlord-Friendly · R+5
- County
- — inherits STATE
- City
- — inherits STATE
ZIP-level market 77521
- Rents YoY
- 1.5%
- Active inventory
- 612
- Price-to-rent
- 4.6×
Monthly cashflow live
- Estimated rent
- $1,738 high interval (Pro) →
- Mortgage (P&I)
- −$503
- Tax from tax record
- −$284 /mo · $3,408/yr
- Insurance
- −$40
- HOA
- −$67
- Vacancy / Maint / Mgmt
- −$365
- Net cashflow
- $479
Break-even live
UW: 25.0% down · 7.5% · 30yr · 1.5% tax · 5.0% vac · 8.0% maint · 8.0% mgmt
Financing live
Cash to close
- Down payment
- $23,975
- Closing costs
- $2,877
- Reserves months
- —
- Total cash needed
- —
Loan-product check · same deal, 3 products live
Conventional
25% down · 7.5% · 30yr
- Down + closing
- —
- Monthly P&I
- —
- Monthly cashflow
- —
- DSCR
- —
- Eligible?
- —
Personal DTI + credit; lowest rate.
DSCR
20% down · 8.5% · 30yr
- Down + closing
- —
- Monthly P&I
- —
- Monthly cashflow
- —
- DSCR
- —
- Eligible?
- —
No personal income docs; deal must DSCR.
Hard money
10% down · 12.0% · 12mo
- Down + closing
- —
- Monthly P&I
- —
- Monthly cashflow
- —
- DSCR
- —
- Eligible?
- —
Short-term bridge; refi at stabilization.
Rent comps 6 comps
| Address | Beds | Baths | Sqft | Rent | $/sqft | DOM | Units | Dist |
|---|---|---|---|---|---|---|---|---|
| 3400 Shady Hill Dr Baytown, TX | 1.0–3.0 | 1.0–2.0 | 1013 | $2,012 | $1.99 | 1d | 21 | 0.09mi |
| 2906 W Baker Rd Unit 901 Baytown, TX | 2.0 | 2.0 | 1067 | $1,185 | $1.11 | 43d | 1 | 0.78mi |
| 3723 Emmett Hutto Blvd Baytown, TX | 2.0 | 2.0 | 1216 | $1,650 | $1.36 | 43d | 1 | 0.89mi |
| 2800 W Baker Rd Baytown, TX | 1.0–3.0 | 1.0–2.0 | 988 | $1,455 | $1.47 | 4d | 28 | 0.93mi |
| 5406 Carousel Cir Baytown, TX | 3.0 | 2.0 | 1592 | $1,761 | $1.11 | 43d | 1 | 0.97mi |
| 5405 Shirley St Baytown, TX | 3.0 | 2.0 | 1630 | $1,703 | $1.04 | 24d | 1 | 1.16mi |
HOA detail
- Monthly dues
- $67 · $804/yr
Listing history 24 events
-
2026-06-17status $95,900 Pending 38 DOM
-
2026-06-17days on market $95,900 Active 38 DOM
-
2026-06-16statusdays on market $95,900 Active 37 DOM
-
2026-06-15days on market $95,900 Pending 36 DOM
-
2026-06-13statusdays on market $95,900 Pending 34 DOM
-
2026-06-10status $95,900 Active 30 DOM
-
2026-06-07days on market $95,900 Pending 30 DOM
-
2026-06-04days on market $95,900 Pending 28 DOM
-
2026-06-03days on market $95,900 Pending 27 DOM
-
2026-06-02days on market $95,900 Pending 26 DOM
-
2026-06-02status $95,900 Pending 25 DOM
-
2026-06-01days on market $95,900 Active 25 DOM
-
2026-05-31days on market $95,900 Active 24 DOM
-
2026-05-05$95,900 Active 276-char remark
-
2016-12-06soldstatus
-
2016-12-05soldstatus Sold 522-char remark
Show marketing remark (522 chars)
The search is over! Lovely 2/2/2 w/ hardwood bamboo flooring throughout living areas! Formal living room w/ half vaulted ceiling! The family room is great for entertaining & features a wood burning fireplace! Whip up delicious meals in the kitchen equipped w/ granite counter tops & a serving bar! Retire after a long day to the spacious master suite boasting 2 walk-in closets & master bath w/ tile flooring & dbl sinks! Huge secondary bedroom w/ walk-in closet! Covered tile back patio! Call Now!
-
2016-11-07status Pending, Continue to Show 522-char remark
Show marketing remark (522 chars)
The search is over! Lovely 2/2/2 w/ hardwood bamboo flooring throughout living areas! Formal living room w/ half vaulted ceiling! The family room is great for entertaining & features a wood burning fireplace! Whip up delicious meals in the kitchen equipped w/ granite counter tops & a serving bar! Retire after a long day to the spacious master suite boasting 2 walk-in closets & master bath w/ tile flooring & dbl sinks! Huge secondary bedroom w/ walk-in closet! Covered tile back patio! Call Now!
-
2016-10-31$79,990 Active 522-char remark
Show marketing remark (522 chars)
The search is over! Lovely 2/2/2 w/ hardwood bamboo flooring throughout living areas! Formal living room w/ half vaulted ceiling! The family room is great for entertaining & features a wood burning fireplace! Whip up delicious meals in the kitchen equipped w/ granite counter tops & a serving bar! Retire after a long day to the spacious master suite boasting 2 walk-in closets & master bath w/ tile flooring & dbl sinks! Huge secondary bedroom w/ walk-in closet! Covered tile back patio! Call Now!
-
2011-07-14historical
-
2010-11-04$78,000
-
2010-06-22historical
-
2009-12-21$79,500
-
2004-11-03soldstatus
-
1992-11-17soldstatus
ⓘ Source: listings_history table (triggers on properties + properties_extension) + one-shot
backfill from property_details.listing_events for pre-trigger history.
Tax reassessment forecast TX · Resets to sale price
- Current annual tax
- $3,408 · $284/mo
- Projected year-2 tax
- $3,408 · $284/mo
- Expected delta
- $0/yr ($0/mo · 0.0%)
ⓘ Screening estimate from a state-policy table — verify with the county assessor before closing.
Climate risk First Street
- Flood 4/10 Moderate FEMA zone X (unshaded) · 22% chance over 30 yrs
- Wildfire 1/10 Low
- Heat 8/10 Severe
- Wind 9/10 Extreme 99% chance of damaging wind over 30 yrs
- Air quality 2/10 Low 1 unhealthy d/yr today · 2 by 30 yrs out
Nearby sold comps map
Loading sold comps map…
Walkable amenities ~0.75 mi
Loading nearby amenities…
Taxation est. · year 1
- Rental income
- $20,853
- − Mortgage interest
- −$5,372
- − Property taxes
- −$3,408
- − Insurance
- −$480
- − Repairs & maintenance
- −$1,668
- − Management
- −$1,668
- − HOA
- −$804
- − Depreciation
- −$2,790
- Taxable income
- $4,663
- Est. tax owed @ 24.0%
- −$1,119
- After-tax cash flow
- $4,628/yr
For passive investors: Depreciation is non-cash, so a rental often shows a tax loss while cash-flowing — sheltering income. Rental losses are passive: they offset passive income freely, and up to $25,000/yr can offset ordinary (W-2) income if you actively participate and your MAGI is under $100k (phasing out to $0 by $150k); unused losses carry forward. On sale, claimed depreciation is recaptured at up to 25%, and gains may owe capital-gains tax (a 1031 exchange can defer both). Figures are a year-1 estimate at your 24.0% rate — not tax advice; consult a CPA.
Schools (NCES district)
- District
- Goose Creek CISD
- NCES district ID
- 4821150
- Math proficiency
- 37% ▼ -11.00%
- Reading proficiency
- 36% ▼ -4.00%
- Median HH income
- $52,468
- Composite
- 31.84/100
- National rank
- #5877
- State rank
- #473 of 826 in TX
Livability — Baytown
- Score
- 69/100
- State rank
- #412
- US rank
- #8494
Category grades
Schools grade is shown separately in the Schools card above.
Census & demographics
- Census place
- Baytown, TX
- County
- Harris County · 4,702,590 people
- City population
- 135,579
- Metro
- Houston-The Woodlands-Sugar Land, TX
- Population (ZIP)
- 69,038
- Household income
- $73,629
- Rent vs Own
- Severe rent burden
- 2121.0
Population outlook (Harris County) Hauer SSP2
- Today (2025)
- 5,571,493 people
- By 2030
- 6,089,821 · +9.3%
- By 2040
- 7,142,806 · +28.2%
- By 2050
- 8,185,864 · +46.9%
- By 2075
- 10,574,329 · +89.8%
- By 2100
- 12,109,958 · +117.4%
Race, ethnicity, and origin ACS 2023
- Neighborhood character
- Diverse neighborhood (Simpson 0.64)
- Race & ethnicity
- Hispanic / Latino 50% White 28% Two or more races 18% Black 17% Asian 3%
- Hispanic origin (detail)
- Mexican 42% Puerto Rican 2%
- Common ancestry
- Lithuanian 2% Slovak 1%
- Foreign-born
- 20% · Canada, Vietnam
- Languages at home
- 59% English-only · Spanish 36% French/Haitian/Cajun 1% Other Asian/Pacific 1%
Political lean MEDSL · Harris
- 2024 margin
- Lean D (+5.5) · D 52.0% · R 46.4% · Other 1.6%
- 2008→2024 swing
- +3.9pp toward D · 2008: 1.6pp · 2024: 5.5pp
- All cycles
- 2024: D+5.5 2020: D+13.3 2016: D+12.4 2012: D+0.1 2008: D+1.6
Not yet ingested
- Civics
- —
Market trends
- HPI YoY
- ▼ -154.80%
- Current HPI
- 246.1892
- Rent YoY
- ▲ 1.48%
- Metro
- Houston-The Woodlands-Sugar Land, TX
- State GDP YoY
- ▲ 3.95%
- F500 in state
- 110
Industry mix (Fortune 500 HQ in TX)
| Industry | F500 HQs | Revenue |
|---|---|---|
| Energy | 16 | $1,198B |
|
||
| Technology | 5 | $198B |
|
||
| Engineering / Construction | 4 | $72B |
|
||
| Energy Services | 3 | $60B |
|
||
| Utilities | 3 | $41B |
|
||
| Healthcare | 2 | $330B |
|
||
Price history
+20.6% since first listed19 events — show timeline
- 2026-06-17 Pending — HARMLS
- 2026-06-16 Relisted — HARMLS
- 2026-06-10 Pending — HARMLS
- 2026-06-09 Relisted — HARMLS
- 2026-06-07 Pending — HARMLS
- 2026-06-01 Pending — HARMLS
- 2026-05-23 Relisted — HARMLS
- 2026-05-22 Pending — HARMLS
- 2026-05-05 Listed $95,900 HARMLS
- 2016-12-06 Sold (Public Records) — Public Records
- 2016-12-05 Sold (MLS) — HARMLS
- 2016-11-07 Pending — HARMLS
- 2016-10-31 Listed $79,990 HARMLS
- 2011-07-14 Listing Removed — HARMLS
- 2010-11-04 Listed $78,000 HARMLS
- 2010-06-22 Listing Removed — HARMLS
- 2009-12-21 Listed $79,500 HARMLS
- 2004-11-03 Sold (Public Records) — Public Records
- 1992-11-17 Sold (Public Records) — Public Records
Property tax history
+2.2%/yrLatest (2025): $3,408 · +3.3% YoY. Source: county tax records.
Cash-flow waterfall
monthlySold comps — $/sqft
last 12 mo · ≤1 miLoading sold comps…