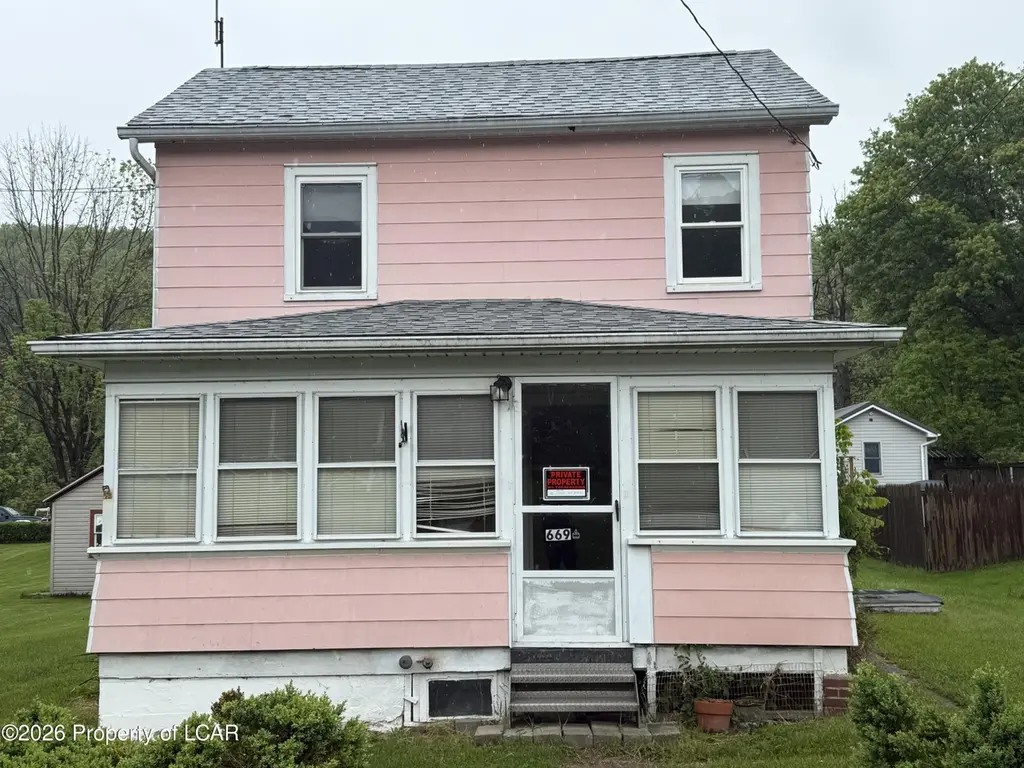
669 Market St · Weston, PA
Flood risk 6/10 · Moderate
- FEMA flood zone
- X (unshaded)
- Chance of flooding over 30 yrs
- 0.71%
- Est. flood insurance / yr
- $507 – $1,088
Fire risk 2/10 · Minimal
- Est. fire insurance / yr
- $511 – $949
Heat risk 3/10 · Minor
- Hot days now (above 92°F)
- 7 days/yr
- Hot days in 30 yrs
- 16 days/yr
Wind risk 3/10 · Minor
- Chance of severe wind over 30 yrs
- 6.0%
Air-quality risk 2/10 · Minimal
- Unhealthy air days now
- 1 days/yr
- Unhealthy air days in 30 yrs
- 2 days/yr
Risk factors via First Street. Map © Google.
Why this score? — see what drove the B+ grade
The composite is a weighted blend of 9 inputs, each scored 0–100. Each bar is that input's sub-score; the figure is the points it added to the 100-point composite (weight × sub-score).
- Cash flow +30.0/30.0
- 1% rule +10.0/10.0
- DSCR +10.0/10.0
- Appreciation +10.0/10.0
- ARV discount +7.5/15.0
- Livability +3.2/5.0
- Rent growth +2.5/5.0
- Condition / age +2.2/5.0
- Schools +2.0/10.0
$129,900
🖨 Deal sheet 📄 Offer letter ✓ Due diligence
Listing remarks
WESTON! Don't miss this charming single-family home featuring 3 beds/1 bath, spacious living/dining room, and a functional kitchen. Enjoy the 1-car garage and expansive patio perfect for entertaining. Sitting on a large lot with plenty of outdoor space. Priced to sell -- this opportunity won't last. Call today!
Key facts
- Functional kitchen
- Large lot
- 1 car garage
Tags
Property features AI
Exterior
- Parking: Detached 1-car garage
- Utilities: Public water; Public sewer
- Home design: Single-family residence; Two levels
- Construction: Aluminum siding
- Exterior features: Asbestos shingle roof
Interior
- Bathrooms: 1 full bathroom
- Heating & cooling: Oil heating; Baseboard heating
- Interior features: 8 total rooms
Neighborhood map
What this means for you Summary
Snapshot
- This is a 2-bed/1.0-bath single-family listed at $130k. Condition is rated fair.
Deal economics
- At list price, monthly cash flow is $1k ($16k/yr) — positive.
- The deal already cash-flows at list — no discount required.
- Meets the 1% rule at list price ($3k rent vs $130k).
- Recommended offer: $128k (1.5% below list) — sets the bar for market timing.
Location & tenants
- Location reads 63/100 on livability (#1,247 in PA) — a middle-class / working-renter tenant base. Strengths: employment A+, cost of living A+; Watch: crime C-, housing D+, amenities F.
- Hazleton Area SD (suburban): math 18% / reading 30% proficiency, ranked #476 of 539 in PA (top 88%) — low school quality limits family demand, transient renter base, plan for 1-2y turnover.
- Market conditions: 30 active listings in the ZIP; 1 comparable units currently listed for rent nearby; 349 units permitted in Luzerne County in 2024 (16 in 5+ unit buildings).
Forward outlook
- In year one you build about $14k of equity ($898 loan paydown + $13k appreciation (10.0% local appreciation)).
- Luzerne County population projected at +4% by 2050 — modest demand growth; plan on rents tracking national, not racing it.
- At projected returns (10.0% appreciation + 3.0% rent growth), your $36k cash investment doubles in ~2 years — after that, you're playing with house money.
- By year 3, paydown + projected appreciation supports a ~$35k cash-out refi (75% LTV) — recoverable capital for the next deal without selling this one.
Negotiation context
- It's been on market 21 days — a 2% lower offer ($128k) is reasonable based on typical stale-listing flexibility.
Risks & watch-outs
- Climate carrying-cost: major flood risk — expect insurance premiums to compound above CPI over the hold.
Questions for the listing agent
- Have any recent inspections been done? Can we get a copy of the seller's disclosures and any deferred-maintenance estimates?
- Is there a deadline driving the sale (1031 exchange, divorce, estate, relocation)? That informs how much negotiation room exists.
- What's the average days-on-market for RENTAL listings here right now (not sales)? A rising rental-DOM trend means longer vacancies and softer asking-rent achievability than the comps imply.
- What's the recent tenant-quality profile in this submarket — average credit score on applications, eviction rate, late-payment / NSF rate, and stable-employment percentage? A property-management company in the area should have these aggregated.
- How much new for-sale + rental construction is in the pipeline within 1–3 miles? Heavy new supply typically softens prices + rents 12–24 months out; constrained supply supports both.
Investment metrics
- 1% rule
- 2.16% ✓
- Cap rate
- 18.43%
- Cash-on-cash
- 43.36%
- DSCR
- 2.93
- GRM
- 3.9
CMA / ARV
No comps found within radius.
Projected returns pro-forma
10.0% appreciation · 3.0% rent growth · sell at horizon
- IRR
- 58.0%
- Equity multiple
- 5.25×
- Total profit
- $154,497
- Equity at exit
- $117,024
- IRR
- 51.5%
- Equity multiple
- 11.70×
- Total profit
- $389,225
- Equity at exit
- $252,367
Cash invested: $36,372 (down + closing). Projections, not guarantees.
Landlord ↔ Tenant lean methodology
- Overall (STATE)
- 62 Landlord-Friendly
- State Pennsylvania
- 62 Landlord-Friendly · EVEN
- County
- — inherits STATE
- City
- — inherits STATE
ZIP-level market 18249
- Home prices YoY
- 21.0%
- Active inventory
- 30
- Price-to-rent
- 3.9×
Monthly cashflow live
- Estimated rent
- $2,800 medium interval (Pro) →
- Mortgage (P&I)
- −$681
- Tax est. 1.5%
- −$162 /mo · $1,948/yr
- Insurance
- −$54
- HOA
- −$0
- Vacancy / Maint / Mgmt
- −$588
- Net cashflow
- $1,314
Break-even live
UW: 25.0% down · 7.5% · 30yr · 1.5% tax · 5.0% vac · 8.0% maint · 8.0% mgmt
Financing live
Cash to close
- Down payment
- $32,475
- Closing costs
- $3,897
- Reserves months
- —
- Total cash needed
- —
Loan-product check · same deal, 3 products live
Conventional
25% down · 7.5% · 30yr
- Down + closing
- —
- Monthly P&I
- —
- Monthly cashflow
- —
- DSCR
- —
- Eligible?
- —
Personal DTI + credit; lowest rate.
DSCR
20% down · 8.5% · 30yr
- Down + closing
- —
- Monthly P&I
- —
- Monthly cashflow
- —
- DSCR
- —
- Eligible?
- —
No personal income docs; deal must DSCR.
Hard money
10% down · 12.0% · 12mo
- Down + closing
- —
- Monthly P&I
- —
- Monthly cashflow
- —
- DSCR
- —
- Eligible?
- —
Short-term bridge; refi at stabilization.
Rent comps 1 comps
| Address | Beds | Baths | Sqft | Rent | $/sqft | DOM | Units | Dist |
|---|---|---|---|---|---|---|---|---|
| 5 Conyngham Dr Hazleton, PA | 3.0 | 3.0 | 1274 | $2,800 | $2.20 | 44d | 1 | 1.38mi |
Listing history 14 events
-
2026-06-19days on market $129,900 Active 21 DOM
-
2026-06-18days on market $129,900 Active 20 DOM
-
2026-06-17days on market $129,900 Active 19 DOM
-
2026-06-16days on market $129,900 Active 18 DOM
-
2026-06-15days on market $129,900 Active 17 DOM
-
2026-06-14days on market $129,900 Active 15 DOM
-
2026-06-12days on market $129,900 Active 14 DOM
-
2026-06-09days on market $129,900 Active 11 DOM
-
2026-06-08days on market $129,900 Active 10 DOM
-
2026-06-07days on market $129,900 Active 9 DOM
-
2026-06-02days on market $129,900 Active 4 DOM
-
2026-06-01days on market $129,900 Active 3 DOM
-
2026-05-31days on market $129,900 Active 2 DOM
-
2026-05-29$129,900 Active
ⓘ Source: listings_history table (triggers on properties + properties_extension) + one-shot
backfill from property_details.listing_events for pre-trigger history.
Climate risk First Street
- Flood 6/10 Major FEMA zone X (unshaded) · 71% chance over 30 yrs
- Wildfire 2/10 Low
- Heat 3/10 Moderate 7 d/yr ≥92°F today · 16 d/yr by 30 yrs out
- Wind 3/10 Moderate 6% chance of damaging wind over 30 yrs
- Air quality 2/10 Low 1 unhealthy d/yr today · 2 by 30 yrs out
Nearby sold comps map
Loading sold comps map…
Walkable amenities ~0.75 mi
Loading nearby amenities…
Taxation est. · year 1
- Rental income
- $33,600
- − Mortgage interest
- −$7,276
- − Property taxes
- −$1,948
- − Insurance
- −$650
- − Repairs & maintenance
- −$2,688
- − Management
- −$2,688
- − Depreciation
- −$3,779
- Taxable income
- $14,571
- Est. tax owed @ 24.0%
- −$3,497
- After-tax cash flow
- $12,275/yr
For passive investors: Depreciation is non-cash, so a rental often shows a tax loss while cash-flowing — sheltering income. Rental losses are passive: they offset passive income freely, and up to $25,000/yr can offset ordinary (W-2) income if you actively participate and your MAGI is under $100k (phasing out to $0 by $150k); unused losses carry forward. On sale, claimed depreciation is recaptured at up to 25%, and gains may owe capital-gains tax (a 1031 exchange can defer both). Figures are a year-1 estimate at your 24.0% rate — not tax advice; consult a CPA.
Condition & rehab AI · 12 photos
This single-family home requires moderate renovations to update the kitchen and bathroom, and address structural issues. The property has potential for significant value increase with these improvements.
Repairs flagged
- Major kitchen cabinets — severely dated and worn
- Major bathroom fixtures — mold and possibly structural issues
- Minor exterior siding — some wear
Value-add opportunities
- Resale update kitchen cabinets and appliances — modernizing the kitchen
- Resale replace bathroom fixtures and possibly rework structure — addressing mold and structural issues
- Both paint interior walls and replace carpet — improving aesthetics and comfort
- Both repair/replace windows — increasing energy efficiency and curb appeal
Renovation cost estimate screening
| Repair item | Severity | Est. cost |
|---|---|---|
| kitchen cabinets · severely dated and worn | Major | $15,000–50,000 |
| bathroom fixtures · mold and possibly structural issues | Major | $15,000–50,000 |
| exterior siding · some wear | Minor | $500–3,000 |
| Total estimated repair cost · 3 items | $30,500–103,000 |
Value-add ROI direction
- Resale update kitchen cabinets and appliances — modernizing the kitchen ↑
- Resale replace bathroom fixtures and possibly rework structure — addressing mold and structural issues ↑
- Both paint interior walls and replace carpet — improving aesthetics and comfort ↑
- Both repair/replace windows — increasing energy efficiency and curb appeal ↑
ⓘ Cost ranges are severity-bucket heuristics (US national rule-of-thumb). Get contractor quotes + a written scope before underwriting a rehab budget.
Schools (NCES district)
- District
- Hazleton Area SD
- NCES district ID
- 4211700
- Math proficiency
- 18% ▼ -3.00%
- Reading proficiency
- 30% ▼ -15.00%
- Median HH income
- $42,247
- Composite
- 20.44/100
- National rank
- #8582
- State rank
- #476 of 539 in PA
Livability — Weston
- Score
- 63/100
- State rank
- #1247
- US rank
- #14980
Category grades
Schools grade is shown separately in the Schools card above.
Census & demographics
- Census place
- Weston, PA
- Population (ZIP)
- 4,161
Population outlook (Luzerne County) Hauer SSP2
- Today (2025)
- 319,505 people
- By 2030
- 319,943 · +0.1%
- By 2040
- 322,643 · +1.0%
- By 2050
- 330,817 · +3.5%
- By 2075
- 379,145 · +18.7%
- By 2100
- 431,908 · +35.2%
Race, ethnicity, and origin ACS 2023
- Neighborhood character
- Predominantly White (92%)
- Race & ethnicity
- White 92% Asian 3% Two or more races 3% Black 2% Hispanic / Latino 1%
- Common ancestry
- Romanian 10% Subsaharan African 3% Scotch-Irish 2%
- Foreign-born
- 3% · Canada
- Languages at home
- 95% English-only · Other Indo-European 3% Spanish 1%
Political lean MEDSL · Luzerne
- 2024 margin
- R (+19.2) · D 40.0% · R 59.2%
- 2008→2024 swing
- -27.6pp toward R · 2008: 8.4pp · 2024: -19.2pp
- All cycles
- 2024: R+19.2 2020: R+14.4 2016: R+19.6 2012: D+4.8 2008: D+8.4
Not yet ingested
- Civics
- —
Market trends
- HPI YoY
- ▲ 55.29%
- Current HPI
- 318.606
- Rent YoY
- —
- Metro
- —
- State GDP YoY
- ▲ 1.68%
- F500 in state
- 34
Industry mix (Fortune 500 HQ in PA)
| Industry | F500 HQs | Revenue |
|---|---|---|
| Healthcare | 2 | $309B |
|
||
| Insurance | 2 | $27B |
|
||
| Telecommunications / Media | 1 | $124B |
|
||
| Industrial Distribution | 1 | $22B |
|
||
| Financial Services | 1 | $20B |
|
||
| Chemicals / Materials | 1 | $18B |
|
||
Price history
1 event — show timeline
- 2026-05-29 Listed $129,900 LCAR
Cash-flow waterfall
monthlySold comps — $/sqft
last 12 mo · ≤1 miLoading sold comps…