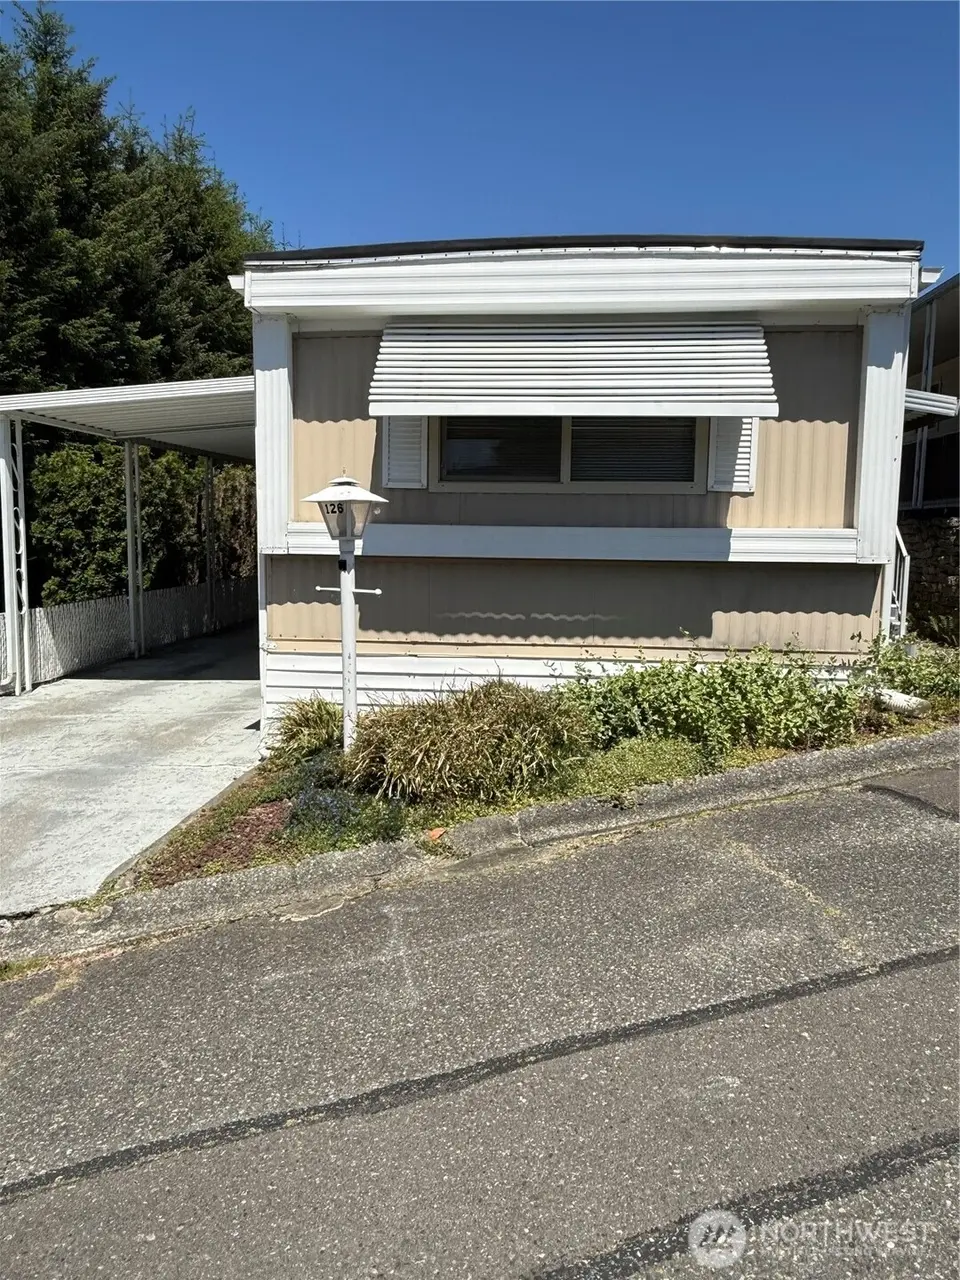
1415 84th St SE #126 · Everett, WA
Flood risk No data
- FEMA flood zone
- —
- Chance of flooding over 30 yrs
- —
- Est. flood insurance / yr
- —
Fire risk No data
- Est. fire insurance / yr
- —
Heat risk No data
- Hot days now (above threshold)
- —
- Hot days in 30 yrs
- —
Wind risk No data
- Chance of severe wind over 30 yrs
- —
Air-quality risk No data
- Unhealthy air days now
- —
- Unhealthy air days in 30 yrs
- —
Risk factors via First Street. Map © Google.
Why this score? — see what drove the B grade
The composite is a weighted blend of 9 inputs, each scored 0–100. Each bar is that input's sub-score; the figure is the points it added to the 100-point composite (weight × sub-score).
- Cash flow +30.0/30.0
- 1% rule +10.0/10.0
- DSCR +10.0/10.0
- ARV discount +7.5/15.0
- Schools +5.9/10.0
- Livability +3.7/5.0
- Condition / age +2.5/5.0
- Rent growth +1.7/5.0
- Appreciation +0.0/10.0
$49,000
🖨 Deal sheet (PDF) 📄 Offer letter ✓ Due diligence
Listing remarks
Affordable living in the ever popular 55+ Park, Mobile Country Club. A complete remodel. Newer Millguard vinyl windows, 8 yr old insulated 30 year roof and flashing; whole house re-plumbed 2014; newer forced air electric furnace, newer hot water tank, all heat ducts resealed. Bathroom remodel 2020, new tub/shower combo, toilet and flooring. Newer stove, refrigerator, washer and dryer. New kitchen counters and backsplash. New interior paint, new front porch, new vinyl flooring in kitchen, hall and bath; new carpets in living room and both bedrooms completed 5-30-26; new light fixtures, new rear porch and carpet. Automatic timed light in entry. Two patio areas; adjacent guest parking, corner
Key facts
- New insulated roof
- Bathroom remodel
- New vinyl windows
Tags
Property features AI
Finance
- Other: Tax annual amount: $275
- Financial info: Land lease amount: $831; Listing terms: Cash
- HOA & community: Located in Mobile Country Club (approximately 210 homes); Senior community; Park amenities: clubhouse, exercise room, laundry, pool, RV parking; Land lease
Exterior
- Parking: Carport
- Utilities: Public water; City sewer; PUD electric
- Home design: Manufactured single-wide home (Kentwood model); One level; Manufactured house; Mobile home remains in place
- Construction: Metal/Vinyl construction; Roof: see remarks
- Exterior features: Metal/vinyl exterior; Paved lot
Interior
- Kitchen: Stove/Range; Refrigerator
- Bedrooms: 2 bedrooms
- Flooring: Vinyl; Carpet
- Bathrooms: 1 full bathroom with bathtub
- Heating & cooling: Forced air heating; Electric energy source
- Interior features: Awnings; Double-pane windows; Landscaped; Patio/Porch/Deck
- Laundry & utility: Washer; Dryer; Utility room
Neighborhood map
What this means for you Summary
Snapshot
- This is a 2-bed/1.0-bath manufactured listed at $49k.
Deal economics
- At list price, monthly cash flow is $1k ($15k/yr) — positive.
- The deal already cash-flows at list — no discount required.
- Meets the 1% rule at list price ($2k rent vs $49k).
- Recommended offer: $48k (1.5% below list) — sets the bar for market timing.
- Cap rate 36.7% vs local median 2.5% in Everett — top-decile yield for the area; either an underpriced asset or a hidden risk that comps aren't pricing in. Stress-test before assuming the spread holds.
Location & tenants
- Location reads 73/100 on livability (#199 in WA) — a middle-class / working-renter tenant base. Strengths: commute A+, housing A, health & safety A; Watch: schools C-, crime D+, amenities F.
- Everett School District (urban): math 60% / reading 72% proficiency, ranked #26 of 291 in WA (top 9%) — acceptable for families but not a draw, mixed tenant base, ~2y average lease.
- Market conditions: Rents falling (-3.2%/yr); 275 active listings in the ZIP; 40 comparable units currently listed for rent nearby; rentals leasing fast (median 6d on market — plan ~1-2 weeks tenant-placement turnaround); solid renter incomes; 3,982 units permitted in Snohomish County in 2024 (1,492 in 5+ unit buildings).
Forward outlook
- Local home prices are declining (-3.0%/yr); year-one equity from $339 of loan paydown is wiped out by about $1k of value loss. Plan a longer hold.
- Snohomish County population projected at +30% by 2050 — long-run rental-demand tailwind backs the buy-and-hold thesis.
- At projected returns (-3.0% appreciation + 0.0% rent growth), your $14k cash investment doubles in ~1 year — after that, you're playing with house money.
Negotiation context
- It's been on market 17 days — a 2% lower offer ($48k) is reasonable based on typical stale-listing flexibility.
Questions for the listing agent
- Built in 1973 — when were the roof, HVAC, electrical panel, plumbing, and water heater last replaced?
- Is there a deadline driving the sale (1031 exchange, divorce, estate, relocation)? That informs how much negotiation room exists.
- Crime grade is D in this area — have there been break-ins, vandalism, or insurance claims at this property in the last 3 years? What carrier currently insures it and at what premium?
- What's the average days-on-market for RENTAL listings here right now (not sales)? A rising rental-DOM trend means longer vacancies and softer asking-rent achievability than the comps imply.
- What's the recent tenant-quality profile in this submarket — average credit score on applications, eviction rate, late-payment / NSF rate, and stable-employment percentage? A property-management company in the area should have these aggregated.
- How much new for-sale + rental construction is in the pipeline within 1–3 miles? Heavy new supply typically softens prices + rents 12–24 months out; constrained supply supports both.
Investment metrics
- 1% rule
- 3.98% ✓
- Cap rate
- 36.67%
- Cash-on-cash
- 108.51%
- DSCR
- 5.83
- GRM
- 2.1
CMA / ARV
- ARV (on-the-fly)
- $159,600
- Comps found
- 2
Show comp detail 2 sales within ~0.75 mi
| Address | Dist | Beds/Ba | Sqft | Sold | Price | $/sf | Match |
|---|---|---|---|---|---|---|---|
| 1415 84th St SE #84 | 0.00mi | 2/1.0 | 840 (0%) | 2mo | $70,000 | $83 | 99 |
| 1415 84th St SE #33 | 0.00mi | 2/2.0 | 960 (+14%) | 14mo | $182,500 | $190 | 61 |
Match score weights: distance 35% · size 25% · config 20% · recency 20%. Top-matched comps best support the ARV.
Projected returns pro-forma
-3.0% appreciation · 0.0% rent growth · sell at horizon
- IRR
- —
- Equity multiple
- 5.76×
- Total profit
- $65,362
- Equity at exit
- $7,306
- IRR
- —
- Equity multiple
- 10.96×
- Total profit
- $136,586
- Equity at exit
- $4,237
Cash invested: $13,720 (down + closing). Projections, not guarantees.
Landlord ↔ Tenant lean methodology
- Overall (STATE)
- 28 Tenant-Leaning
- State Washington
- 28 Tenant-Leaning · D+8
- County
- — inherits STATE
- City
- — inherits STATE
ZIP-level market 98208
- Rents YoY
- -3.2%
- Active inventory
- 275
- Price-to-rent
- 2.1×
Monthly cashflow live
- Estimated rent
- $1,951 high interval (Pro) →
- Mortgage (P&I)
- −$257
- Tax from tax record
- −$23 /mo · $282/yr
- Insurance
- −$20
- HOA
- −$0
- Vacancy / Maint / Mgmt
- −$410
- Net cashflow
- $1,241
Break-even live
Sensitivity live
| Price | -10% $1,268 | -5% $1,254 | +0% $1,241 | +5% $1,227 | +10% $1,213 |
|---|---|---|---|---|---|
| Rent | -10% $1,086 | -5% $1,164 | +0% $1,241 | +5% $1,318 | +10% $1,395 |
| Rate | -1.0pp $1,265 | -0.5pp $1,253 | base $1,241 | +0.5pp $1,228 | +1.0pp $1,215 |
UW: 25.0% down · 7.5% · 30yr · 1.5% tax · 5.0% vac · 8.0% maint · 8.0% mgmt
Financing live
Cash to close
- Down payment
- $12,250
- Closing costs
- $1,470
- Reserves months
- —
- Total cash needed
- —
Loan-product check · same deal, 3 products live
Conventional
25% down · 7.5% · 30yr
- Down + closing
- —
- Monthly P&I
- —
- Monthly cashflow
- —
- DSCR
- —
- Eligible?
- —
Personal DTI + credit; lowest rate.
DSCR
20% down · 8.5% · 30yr
- Down + closing
- —
- Monthly P&I
- —
- Monthly cashflow
- —
- DSCR
- —
- Eligible?
- —
No personal income docs; deal must DSCR.
Hard money
10% down · 12.0% · 12mo
- Down + closing
- —
- Monthly P&I
- —
- Monthly cashflow
- —
- DSCR
- —
- Eligible?
- —
Short-term bridge; refi at stabilization.
Rent comps 40 comps
| Address | Beds | Baths | Sqft | Rent | $/sqft | DOM | Units | Dist |
|---|---|---|---|---|---|---|---|---|
| 9009 W Mall Dr Everett, WA | 1.0–2.0 | 1.0–2.0 | 830 | $2,502 | $3.01 | 0d | 19 | 0.23mi |
| 233 Dorn Ave Unit 1 Everett, WA | 2.0 | 1.0 | 944 | $1,950 | $2.07 | 11d | 1 | 0.74mi |
| 8102 Evergreen Way Everett, WA | 1.0–5.0 | 1.0–2.0 | 1390 | $2,058 | $1.48 | 0d | 16 | 0.75mi |
| 207 Dorn Ave Unit 2H Everett, WA | 2.0 | 1.0 | 780 | $1,795 | $2.30 | 15d | 1 | 0.76mi |
| 115 Dorn Ave Everett, WA | 2.0 | 1.0–2.0 | 946 | $1,738 | $1.84 | 17d | 1 | 0.80mi |
| 1031 75th St SE Everett, WA | 1.0 | 1.0 | 683 | $1,638 | $2.40 | 5d | 3 | 0.83mi |
| 1007 75th St SE Everett, WA | 2.0 | 1.5 | 1059 | $1,695 | $1.60 | 0d | 1 | 0.84mi |
| 618 75th St SE Unit 206 Everett, WA | 2.0 | 1.0 | 833 | $1,700 | $2.04 | 25d | 1 | 0.86mi |
| 618 75th St SE Everett, WA | 2.0 | 1.0 | 833 | $1,750 | $2.10 | 25d | 1 | 0.86mi |
| 10101 7th Ave SE Everett, WA | 1.0–3.0 | 1.0–2.0 | 1073 | $2,277 | $2.12 | 0d | 15 | 0.90mi |
| 8920 Evergreen Way Everett, WA | 2.0 | 1.0 | 567 | $1,750 | $3.08 | 0d | 7 | 0.91mi |
| 701 75th St SE Everett, WA | 1.0–3.0 | 1.0 | 820 | $1,850 | $2.26 | 5d | 5 | 0.92mi |
| 747 75th St SE Everett, WA | 2.0 | 1.0 | 864 | $1,722 | $1.99 | 5d | 1 | 0.96mi |
| 120 W Casino Rd Everett, WA | 1.0–2.0 | 1.0–1.5 | 818 | $1,992 | $2.43 | 0d | 13 | 1.00mi |
| 2319 75th St SE Everett, WA | 3.0 | 2.0 | 1112 | $2,745 | $2.47 | 25d | 1 | 1.00mi |
| 1304 Bruskrud Rd Everett, WA | 2.0 | 1.5–2.0 | 900 | $2,000 | $2.22 | 0d | 5 | 1.03mi |
| 120 SE Everett Mall Way Everett, WA | 1.0–2.0 | 1.0–2.0 | 813 | $2,134 | $2.62 | 0d | 43 | 1.13mi |
| 6911 Rainier Dr Unit 11-07 Everett, WA | 2.0 | 1.5 | 1008 | $2,095 | $2.08 | 5d | 1 | 1.13mi |
| 6911 Rainier Dr Unit 11-03 Everett, WA | 2.0 | 1.5 | 1008 | $1,695 | $1.68 | 25d | 1 | 1.13mi |
| 6824 Beverly Blvd Everett, WA | 1.0 | 1.0 | 550 | $1,595 | $2.90 | 18d | 1 | 1.14mi |
| 2220 Monroe Ave Everett, WA | 3.0 | 1.0 | 930 | $2,799 | $3.01 | 0d | 1 | 1.15mi |
| 222 W Marilyn Ave Everett, WA | 3.0 | 1.0 | 1000 | $2,400 | $2.40 | 17d | 1 | 1.25mi |
| 8710 5th Ave W Everett, WA | 2.0 | 2.0 | 950 | $2,028 | $2.14 | 0d | 11 | 1.28mi |
| 8530 5th Ave W Everett, WA | 1.0–2.0 | 1.0 | 808 | $1,595 | $1.97 | 5d | 2 | 1.28mi |
| 8220 5th Ave W Apt F Everett, WA | 2.0 | 1.0 | 950 | $1,595 | $1.68 | 0d | 1 | 1.29mi |
| 215 100th St SW Everett, WA | 2.0 | 2.0 | 856 | $1,845 | $2.16 | 5d | 1 | 1.32mi |
| 611 W Casino Rd Unit 2A Everett, WA | 1.0 | 1.0 | 700 | $1,350 | $1.93 | 0d | 1 | 1.34mi |
| 611 W Casino Rd Unit 3A Everett, WA | 1.0 | 1.0 | 753 | $1,400 | $1.86 | 3d | 1 | 1.34mi |
| 611 W Casino Rd Everett, WA | 1.0 | 1.0 | 700 | $1,350 | $1.93 | 44d | 1 | 1.34mi |
| 611 W Casino Rd Everett, WA | 1.0 | 1.0 | 753 | $1,400 | $1.86 | 0d | 1 | 1.34mi |
| 507 Madison St Apt A Everett, WA | 3.0 | 2.0 | 1014 | $2,449 | $2.42 | 0d | 1 | 1.35mi |
| 702 W Casino Rd Everett, WA | 1.0–2.0 | 1.0–1.5 | 850 | $1,749 | $2.06 | 5d | 21 | 1.36mi |
| 9919 4th Ave W Unit 11 Everett, WA | 1.0 | 1.0 | 540 | $1,450 | $2.69 | 44d | 1 | 1.38mi |
| 711 W Casino Rd Everett, WA | 1.0–2.0 | 1.0 | 770 | $1,801 | $2.34 | 0d | 5 | 1.38mi |
| 9925 4th Ave W Apt 6 Everett, WA | 2.0 | 2.0 | 1000 | $1,445 | $1.45 | 2d | 1 | 1.39mi |
| 9925 4th Ave W Apt 9 Everett, WA | 1.0 | 1.0 | 800 | $1,245 | $1.56 | 2d | 1 | 1.39mi |
| 2505 Madison St Unit A Everett, WA | 3.0 | 1.0 | 1040 | $2,800 | $2.69 | 25d | 1 | 1.39mi |
| 9615 Holly Dr Everett, WA | 1.0–2.0 | 1.0 | 645 | $2,220 | $3.44 | 5d | 1 | 1.41mi |
| 11000 16th Ave SE Everett, WA | 1.0 | 1.0 | 602 | $1,628 | $2.70 | 5d | 6 | 1.42mi |
| 6303 Olympic Dr Unit n/a Everett, WA | 2.0 | 1.0 | 780 | $2,299 | $2.95 | 25d | 1 | 1.45mi |
Listing history 14 events
-
2026-06-18days on market $49,000 Active 17 DOM
-
2026-06-17days on market $49,000 Active 16 DOM
-
2026-06-16days on market $49,000 Active 15 DOM
-
2026-06-15price $49,000 Active 14 DOM
-
2026-06-15days on market $58,000 Active 14 DOM
-
2026-06-13days on market $58,000 Active 12 DOM
-
2026-06-13days on market $58,000 Active 11 DOM
-
2026-06-09days on market $58,000 Active 8 DOM
-
2026-06-08pricedays on market $58,000 Active 7 DOM
-
2026-06-07days on market $69,000 Active 6 DOM
-
2026-06-04days on market $69,000 Active 3 DOM
-
2026-06-03days on market $69,000 Active 2 DOM
-
2026-06-02remarks 699-char remark
-
2026-06-02$69,000 Active 1 DOM
ⓘ Source: listings_history table (triggers on properties + properties_extension) + one-shot
backfill from property_details.listing_events for pre-trigger history.
Tax reassessment forecast WA · Resets to sale price
- Current annual tax
- $282 · $23/mo
- Projected year-2 tax
- $480 · $40/mo
- Expected delta
- +$198/yr (+$17/mo · 70.5%)
ⓘ Screening estimate from a state-policy table — verify with the county assessor before closing.
Nearby sold comps map
Loading sold comps map…
Walkable amenities ~0.75 mi
Loading nearby amenities…
Taxation est. · year 1
- Rental income
- $23,414
- − Mortgage interest
- −$2,745
- − Property taxes
- −$282
- − Insurance
- −$245
- − Repairs & maintenance
- −$1,873
- − Management
- −$1,873
- − Depreciation
- −$1,425
- Taxable income
- $14,971
- Est. tax owed @ 24.0%
- −$3,593
- After-tax cash flow
- $11,294/yr
For passive investors: Depreciation is non-cash, so a rental often shows a tax loss while cash-flowing — sheltering income. Rental losses are passive: they offset passive income freely, and up to $25,000/yr can offset ordinary (W-2) income if you actively participate and your MAGI is under $100k (phasing out to $0 by $150k); unused losses carry forward. On sale, claimed depreciation is recaptured at up to 25%, and gains may owe capital-gains tax (a 1031 exchange can defer both). Figures are a year-1 estimate at your 24.0% rate — not tax advice; consult a CPA.
Schools (NCES district)
- District
- Everett School District
- NCES district ID
- 5302670
- Math proficiency
- 60% ▲ 1.00%
- Reading proficiency
- 72% ▲ 1.00%
- Median HH income
- $66,815
- Composite
- 59.0/100
- National rank
- #1964
- State rank
- #26 of 291 in WA
Livability — Everett
- Score
- 73/100
- State rank
- #199
- US rank
- #5489
Category grades
Schools grade is shown separately in the Schools card above.
Census & demographics
- Census place
- Everett, WA
- County
- Snohomish County · 786,756 people
- City population
- 173,457
- Metro
- Seattle-Tacoma-Bellevue, WA
- Population (ZIP)
- 60,915
- Household income
- $103,705
- Rent vs Own
- Severe rent burden
- 1617.0
Population outlook (Snohomish County) Hauer SSP2
- Today (2025)
- 899,800 people
- By 2030
- 960,975 · +6.8%
- By 2040
- 1,074,447 · +19.4%
- By 2050
- 1,171,954 · +30.2%
- By 2075
- 1,384,849 · +53.9%
- By 2100
- 1,497,296 · +66.4%
Race, ethnicity, and origin ACS 2023
- Neighborhood character
- Diverse neighborhood (Simpson 0.65)
- Race & ethnicity
- White 55% Asian 17% Hispanic / Latino 14% Two or more races 13% Black 5%
- Hispanic origin (detail)
- Mexican 10%
- Common ancestry
- Portuguese 5% Italian 3% Slovak 2%
- Foreign-born
- 27% · Canada, Vietnam, South Korea
- Languages at home
- 66% English-only · Spanish 9% Vietnamese 4% Other Asian/Pacific 4%
Political lean MEDSL · Snohomish
- 2024 margin
- D (+19.0) · D 57.8% · R 38.9% · Other 3.3%
- 2008→2024 swing
- +0.1pp no change · 2008: 18.9pp · 2024: 19.0pp
- All cycles
- 2024: D+19.0 2020: D+20.6 2016: D+16.6 2012: D+16.2 2008: D+18.9
Not yet ingested
- Civics
- —
Market trends
- HPI YoY
- ▼ -884.74%
- Current HPI
- 337.856
- Rent YoY
- ▼ -3.16%
- Metro
- Seattle-Tacoma-Bellevue, WA
- State GDP YoY
- ▲ 4.65%
- F500 in state
- 22
Industry mix (Fortune 500 HQ in WA)
| Industry | F500 HQs | Revenue |
|---|---|---|
| Retail | 2 | $269B |
|
||
| Technology / Retail | 1 | $638B |
|
||
| Technology | 1 | $245B |
|
||
| Telecommunications | 1 | $38B |
|
||
| Food / Beverage | 1 | $36B |
|
||
| Automotive / Trucks | 1 | $34B |
|
||
Price history
1 event — show timeline
- 2026-06-01 Listed $69,000 NWMLS as Distributed by MLS Grid
Property tax history
+2.5%/yrLatest (2026): $282 · +2.6% YoY. Source: county tax records.
Cash-flow waterfall
monthlySold comps — $/sqft
last 12 mo · ≤1 miLoading sold comps…