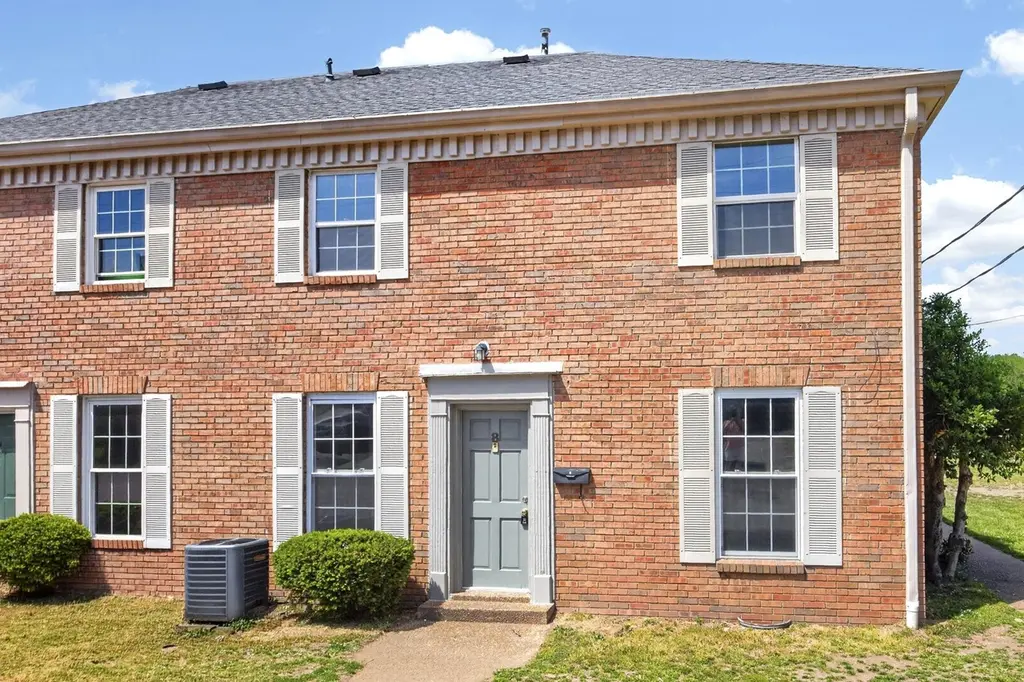
323 Forest Park Rd Unit 5-8 · Nashville-Davidson metropolitan government (balance), TN
Flood risk 1/10 · Minimal
- FEMA flood zone
- X (unshaded)
- Chance of flooding over 30 yrs
- 0.0%
- Est. flood insurance / yr
- $507 – $1,088
Fire risk 1/10 · Minimal
- Est. fire insurance / yr
- $949 – $1,763
Heat risk 6/10 · Moderate
- Hot days now (above 105°F)
- 7 days/yr
- Hot days in 30 yrs
- 21 days/yr
Wind risk 4/10 · Minor
- Chance of severe wind over 30 yrs
- 9.0%
Air-quality risk 2/10 · Minimal
- Unhealthy air days now
- 1 days/yr
- Unhealthy air days in 30 yrs
- 3 days/yr
Risk factors via First Street. Map © Google.
Why this score? — see what drove the B grade
The composite is a weighted blend of 9 inputs, each scored 0–100. Each bar is that input's sub-score; the figure is the points it added to the 100-point composite (weight × sub-score).
- Cash flow +27.6/30.0
- ARV discount +15.0/15.0
- 1% rule +10.0/10.0
- DSCR +9.7/10.0
- Livability +2.5/5.0
- Condition / age +2.5/5.0
- Rent growth +2.3/5.0
- Schools +1.4/10.0
- Appreciation +0.0/10.0
$100,000
🖨 Deal sheet 📄 Offer letter ✓ Due diligence
Listing remarks MLS
Completely renovated and conveniently located only 20 minutes from Nashville. New water heater, new plumbing fixtures, new ac/heat unit, new light fixtures, new appliances, new lpv flooring, new cabinets throughout and freshly painted. This condo is turn key ready! Water included in HOA dues. Don't miss out on this charming condo near shopping and restaurants. Cash or conventional only
Key facts
- $277 HOA
- Built 1969
- Listed 3 days
Property features AI
Finance
- Other: Living area reported as 1,050 (assessor)
- HOA & community: Monthly HOA fee of $277; HOA covers structure and grounds maintenance
Exterior
- Parking: No covered spaces; No designated parking total listed
- Utilities: Public water; Public sewer; Water available
- Home design: Townhouse (attached); Two levels; Brick exterior
- Construction: Brick construction; Existing (previously built)
- Exterior features: End unit; Condominium common interest
Interior
- Kitchen: Electric range
- Bedrooms: 2 bedrooms
- Flooring: Laminate
- Bathrooms: 1 full bath; 1 half bath
- Heating & cooling: Central heating; Central air conditioning
- Interior features: Electric range; Laminate flooring; No basement
- Laundry & utility: Washer hookup; Electric dryer hookup
Neighborhood map
What this means for you Summary
Snapshot
- This is a 2-bed/1.5-bath townhouse listed at $100k.
Deal economics
- At list price, monthly cash flow is $298 ($4k/yr) — positive.
- The deal already cash-flows at list — no discount required.
- Meets the 1% rule at list price ($2k rent vs $100k).
- Cap rate 9.9% vs local median 2.9% in Nashville-Davidson metropolitan government (balance) — top-decile yield for the area; either an underpriced asset or a hidden risk that comps aren't pricing in. Stress-test before assuming the spread holds.
Location & tenants
- Location reads: area grade B — affects rentability + tenant quality, not the cash-flow math above.
- Davidson County (urban): math 12% / reading 19% proficiency, ranked #126 of 139 in TN (top 91%) — low school quality limits family demand, transient renter base, plan for 1-2y turnover; 66% free/reduced lunch — lower-income household profile, screen leases tightly.
- Zoned schools: Stratton Elementary (math 2% / reading 8%, grade F, #896 of 952 statewide, top 96%, 474 students, 0% FRL); Hunters Lane High (math 0% / reading 8%, grade F, #321 of 332 statewide, top 97%, 1,466 students, 0% FRL) — zoned schools average 0% FRL vs 66% district-wide (66 pts lower); this property's tenant base skews higher-income than the district average.
- Market conditions: Rents soft (-0.9%/yr); 330 active listings in the ZIP; 40 comparable units currently listed for rent nearby; rentals at typical pace (median 17d on market — plan ~3-4 weeks tenant-placement turnaround); 6,873 units permitted in Davidson County in 2024 (4,138 in 5+ unit buildings).
- This rent runs 35% of the median local income ($55k/yr) — at the standard rent-burdened threshold; future hikes will face affordability resistance.
Forward outlook
- Local home prices are declining (-3.0%/yr); year-one equity from $691 of loan paydown is wiped out by about $3k of value loss. Plan a longer hold.
- Davidson County population projected at +42% by 2050 — long-run rental-demand tailwind backs the buy-and-hold thesis.
Negotiation context
- Only 3 days on market — expect competitive offers; lowballing is unlikely to land.
Risks & watch-outs
- Climate carrying-cost: extreme-heat days projected 7→21/yr by 2055 (HVAC capex compounding) — expect insurance premiums to compound above CPI over the hold.
Questions for the listing agent
- Built in 1969 — when were the roof, HVAC, electrical panel, plumbing, and water heater last replaced?
- What does the HOA fee cover, when was the last increase, and are there any pending special assessments or reserve-fund shortfalls?
- Is there a deadline driving the sale (1031 exchange, divorce, estate, relocation)? That informs how much negotiation room exists.
- What's the average days-on-market for RENTAL listings here right now (not sales)? A rising rental-DOM trend means longer vacancies and softer asking-rent achievability than the comps imply.
- What's the recent tenant-quality profile in this submarket — average credit score on applications, eviction rate, late-payment / NSF rate, and stable-employment percentage? A property-management company in the area should have these aggregated.
- How much new for-sale + rental construction is in the pipeline within 1–3 miles? Heavy new supply typically softens prices + rents 12–24 months out; constrained supply supports both.
Investment metrics
- 1% rule
- 1.57% ✓
- Cap rate
- 9.87%
- Cash-on-cash
- 12.78%
- DSCR
- 1.57
- GRM
- 5.3
CMA / ARV
- ARV (on-the-fly)
- $182,700
- Comps found
- 12
Show comp detail 12 sales within ~0.75 mi
| Address | Dist | Beds/Ba | Sqft | Sold | Price | $/sf | Match |
|---|---|---|---|---|---|---|---|
| 323 Forest Park Rd Unit 7-7 | 0.00mi | 2/1.5 | 1,050 (0%) | 16mo | $95,000 | $90 | 86 |
| 323 Forest Park Rd Unit 5-10 | 0.00mi | 2/1.5 | 1,050 (0%) | 20mo | $135,000 | $129 | 84 |
| 109 Coventry Woods Dr | 0.12mi | 2/1.5 | 1,142 (+9%) | 14mo | $223,500 | $196 | 68 |
| 555 N Dupont Ave Unit D94 | 0.69mi | 2/2.0 | 1,110 (+6%) | 0mo | $1,700 | $2 | 56 |
| 1928 Lombardia Ln | 0.29mi | 2/2.5 | 1,176 (+12%) | 9mo | $240,000 | $204 | 55 |
| 1935 Lombardia Ln | 0.32mi | 2/2.5 | 1,176 (+12%) | 8mo | $204,900 | $174 | 54 |
| 1920 Lombardia Ln | 0.30mi | 2/2.5 | 1,176 (+12%) | 14mo | $235,000 | $200 | 51 |
| 555 N Dupont Ave Unit D93 | 0.70mi | 2/2.0 | 1,110 (+6%) | 16mo | $170,000 | $153 | 43 |
| 555 N Dupont Ave Unit C64 | 0.65mi | 2/1.0 | 968 (-8%) | 14mo | $140,000 | $145 | 43 |
| 555 N Dupont Ave Unit B43 | 0.66mi | 2/1.0 | 968 (-8%) | 19mo | $152,000 | $157 | 38 |
| 210 Jenna Lee Cir | 0.69mi | 2/2.5 | 1,190 (+13%) | 19mo | $265,000 | $223 | 26 |
| 268 Jenna Lee Cir | 0.65mi | 2/2.5 | 1,202 (+14%) | 19mo | $260,000 | $216 | 26 |
Match score weights: distance 35% · size 25% · config 20% · recency 20%. Top-matched comps best support the ARV.
Projected returns pro-forma
-3.0% appreciation · 0.0% rent growth · sell at horizon
- IRR
- -1.6%
- Equity multiple
- 0.94×
- Total profit
- $-1,640
- Equity at exit
- $14,910
- IRR
- 3.5%
- Equity multiple
- 1.21×
- Total profit
- $5,941
- Equity at exit
- $8,646
Cash invested: $28,000 (down + closing). Projections, not guarantees.
Landlord ↔ Tenant lean methodology
- Overall (STATE)
- 87 Strongly Landlord-Friendly
- State Tennessee
- 87 Strongly Landlord-Friendly · R+13
- County
- — inherits STATE
- City
- — inherits STATE
ZIP-level market 37115
- Rents YoY
- -0.9%
- Active inventory
- 330
- Price-to-rent
- 5.3×
Monthly cashflow live
- Estimated rent
- $1,574 high interval (Pro) →
- Mortgage (P&I)
- −$524
- Tax from tax record
- −$102 /mo · $1,222/yr
- Insurance
- −$42
- HOA
- −$277
- Vacancy / Maint / Mgmt
- −$330
- Net cashflow
- $298
Break-even live
UW: 25.0% down · 7.5% · 30yr · 1.5% tax · 5.0% vac · 8.0% maint · 8.0% mgmt
Financing live
Cash to close
- Down payment
- $25,000
- Closing costs
- $3,000
- Reserves months
- —
- Total cash needed
- —
Loan-product check · same deal, 3 products live
Conventional
25% down · 7.5% · 30yr
- Down + closing
- —
- Monthly P&I
- —
- Monthly cashflow
- —
- DSCR
- —
- Eligible?
- —
Personal DTI + credit; lowest rate.
DSCR
20% down · 8.5% · 30yr
- Down + closing
- —
- Monthly P&I
- —
- Monthly cashflow
- —
- DSCR
- —
- Eligible?
- —
No personal income docs; deal must DSCR.
Hard money
10% down · 12.0% · 12mo
- Down + closing
- —
- Monthly P&I
- —
- Monthly cashflow
- —
- DSCR
- —
- Eligible?
- —
Short-term bridge; refi at stabilization.
Rent comps 40 comps
| Address | Beds | Baths | Sqft | Rent | $/sqft | DOM | Units | Dist |
|---|---|---|---|---|---|---|---|---|
| 400 Forest Park Rd Madison, TN | 1.0–2.0 | 1.0–1.5 | 860 | $1,100 | $1.28 | 10d | 1 | 0.27mi |
| 236 Lanier Dr Madison, TN | 1.0 | 1.0 | 768 | $1,175 | $1.53 | 14d | 1 | 0.29mi |
| 313 Elm St Madison, TN | 1.0 | 1.0 | 896 | $1,495 | $1.67 | 3d | 1 | 0.34mi |
| 720 Carmel Ave Madison, TN | 3.0 | 2.0 | 1424 | $2,100 | $1.47 | 23d | 1 | 0.37mi |
| 101 Rothwood Ct Madison, TN | 3.0 | 2.0 | 1100 | $2,300 | $2.09 | 17d | 1 | 0.46mi |
| 926 Idlewild Dr Madison, TN | 3.0 | 2.0 | 1500 | $2,500 | $1.67 | 21d | 1 | 0.46mi |
| 300 Kate St Madison, TN | 1.0–2.0 | 1.0–2.0 | 812 | $1,149 | $1.41 | 23d | 2 | 0.48mi |
| 300 Kate St Madison, TN | 1.0–2.0 | 1.0–2.0 | 812 | $1,149 | $1.41 | 10d | 2 | 0.48mi |
| 525 N DuPont Ave Madison, TN | 1.0 | 1.0 | 760 | $975 | $1.28 | 3d | 3 | 0.63mi |
| 600 Rothwood Ave Madison, TN | 1.0–3.0 | 1.0–1.5 | 990 | $1,272 | $1.29 | 2d | 8 | 0.65mi |
| 208 Jenna Lee Cir Madison, TN | 2.0 | 2.5 | 1156 | $1,975 | $1.71 | 23d | 1 | 0.66mi |
| 215A Nix Dr Madison, TN | 2.0 | 1.5 | 1003 | $1,395 | $1.39 | 23d | 1 | 0.80mi |
| 311 Roosevelt Madison, TN | 2.0 | 1.0 | 715 | $1,295 | $1.81 | 2d | 1 | 0.85mi |
| 300 E Webster St Madison, TN | 1.0–2.0 | 1.0 | 804 | $1,035 | $1.29 | 3d | 3 | 0.93mi |
| 324 E Webster St Unit B Madison, TN | 1.0 | 1.0 | 750 | $800 | $1.07 | 10d | 1 | 0.93mi |
| 336 E Webster St Madison, TN | 1.0 | 1.0 | 700 | $925 | $1.32 | 17d | 1 | 0.95mi |
| 336 E Webster St #336 Madison, TN | 1.0 | 1.0 | 800 | $925 | $1.16 | 23d | 1 | 0.95mi |
| 110 Archwood Pl Madison, TN | 1.0–2.0 | 1.0–1.5 | 915 | $1,200 | $1.31 | 1d | 6 | 0.95mi |
| 201 E Palestine Ave Madison, TN | 1.0–3.0 | 1.0–2.0 | 1097 | $1,281 | $1.17 | 1d | 8 | 1.00mi |
| 800 Anderson Ln Unit A7 Madison, TN | 1.0 | 1.0 | 720 | $960 | $1.33 | 23d | 1 | 1.02mi |
| 200 E Webster St Madison, TN | 1.0–2.0 | 1.0 | 672 | $1,399 | $2.08 | 2d | 44 | 1.03mi |
| 1040 N DuPont Ave Madison, TN | 1.0–3.0 | 1.0–3.0 | 944 | $1,138 | $1.20 | 23d | 1 | 1.08mi |
| 3172 Penn Meade Way Nashville, TN | 3.0 | 2.0 | 1103 | $1,973 | $1.79 | 23d | 1 | 1.13mi |
| 343 Archwood Dr Madison, TN | 3.0 | 2.0 | 1162 | $2,000 | $1.72 | 23d | 1 | 1.15mi |
| 345 Archwood Dr Madison, TN | 3.0 | 2.0 | 1162 | $2,000 | $1.72 | 23d | 1 | 1.16mi |
| 3128 Penn Meade Way Nashville, TN | 3.0 | 2.0 | 1103 | $2,300 | $2.09 | 21d | 1 | 1.16mi |
| 333 Rio Vista Dr Madison, TN | 2.0–3.0 | 1.0 | 899 | $1,458 | $1.62 | 23d | 9 | 1.17mi |
| 3104 Penn Meade Way Nashville, TN | 3.0 | 2.0 | 948 | $2,100 | $2.22 | 23d | 1 | 1.19mi |
| 2637 River Meade Way Nashville, TN | 3.0 | 2.0 | 1244 | $2,135 | $1.72 | 12d | 1 | 1.20mi |
| 118 Montague Way Madison, TN | 2.0 | 2.0 | 1178 | $2,500 | $2.12 | 23d | 1 | 1.21mi |
| 510 Heritage Dr Madison, TN | 1.0–3.0 | 1.0–2.5 | 1097 | $1,588 | $1.45 | 1d | 17 | 1.29mi |
| 1041 Heritage Dr Madison, TN | 2.0 | 1.0 | 999 | $1,395 | $1.40 | 1d | 1 | 1.37mi |
| 1317 Pierce Rd Unit A Madison, TN | 2.0 | 1.0 | 756 | $1,095 | $1.45 | 23d | 1 | 1.39mi |
| 531 Amquiwood Ct Madison, TN | 2.0 | 2.0 | 1042 | $2,200 | $2.11 | 2d | 1 | 1.42mi |
| 531 Amquiwood Ct Madison, TN | 2.0 | 2.0 | 1066 | $2,200 | $2.06 | 7d | 1 | 1.42mi |
| 2773 River Bend Dr Nashville, TN | 3.0 | 2.5 | 1400 | $2,239 | $1.60 | 15d | 1 | 1.42mi |
| 2120 Candlebrook Ct Madison, TN | 3.0 | 2.0 | 1179 | $1,895 | $1.61 | 4d | 1 | 1.43mi |
| 857 Heritage Cir Madison, TN | 3.0 | 1.5 | 1056 | $1,900 | $1.80 | 23d | 1 | 1.45mi |
| 255 Mayflower Ln N Madison, TN | 3.0 | 2.5 | 1472 | $1,795 | $1.22 | 1d | 1 | 1.45mi |
| 1407 Indian Woods Dr Unit 1407 Madison, TN | 2.0 | 1.0 | 800 | $1,424 | $1.78 | 23d | 1 | 1.46mi |
HOA detail
- Monthly dues
- $277 · $3,324/yr
- Likely covers
- water
Listing history 5 events
-
2026-06-07statusdays on market $100,000 Pending 3 DOM
-
2026-06-05days on market $100,000 Active 2 DOM
-
2026-06-02status $100,000 Active 1 DOM
-
2026-06-02remarks 699-char remark
-
2026-06-02$100,000 Coming Soon 1 DOM
ⓘ Source: listings_history table (triggers on properties + properties_extension) + one-shot
backfill from property_details.listing_events for pre-trigger history.
Tax reassessment forecast TN · Resets to sale price
- Current annual tax
- $1,222 · $102/mo
- Projected year-2 tax
- $1,222 · $102/mo
- Expected delta
- $0/yr ($0/mo · 0.0%)
ⓘ Screening estimate from a state-policy table — verify with the county assessor before closing.
Climate risk First Street
- Flood 1/10 Low FEMA zone X (unshaded) · 0% chance over 30 yrs
- Wildfire 1/10 Low
- Heat 6/10 Major 7 d/yr ≥105°F today · 21 d/yr by 30 yrs out
- Wind 4/10 Moderate 9% chance of damaging wind over 30 yrs
- Air quality 2/10 Low 1 unhealthy d/yr today · 3 by 30 yrs out
Nearby sold comps map
Loading sold comps map…
Walkable amenities ~0.75 mi
Loading nearby amenities…
Taxation est. · year 1
- Rental income
- $18,884
- − Mortgage interest
- −$5,602
- − Property taxes
- −$1,222
- − Insurance
- −$500
- − Repairs & maintenance
- −$1,511
- − Management
- −$1,511
- − HOA
- −$3,324
- − Depreciation
- −$2,909
- Taxable income
- $2,306
- Est. tax owed @ 24.0%
- −$553
- After-tax cash flow
- $3,026/yr
For passive investors: Depreciation is non-cash, so a rental often shows a tax loss while cash-flowing — sheltering income. Rental losses are passive: they offset passive income freely, and up to $25,000/yr can offset ordinary (W-2) income if you actively participate and your MAGI is under $100k (phasing out to $0 by $150k); unused losses carry forward. On sale, claimed depreciation is recaptured at up to 25%, and gains may owe capital-gains tax (a 1031 exchange can defer both). Figures are a year-1 estimate at your 24.0% rate — not tax advice; consult a CPA.
Schools (NCES district)
- District
- Davidson County
- NCES district ID
- 4703180
- Math proficiency
- 12% ▼ -17.00%
- Reading proficiency
- 19% ▼ -7.00%
- Median HH income
- $48,667
- Composite
- 14.03/100
- National rank
- #9472
- State rank
- #126 of 139 in TN
Livability — Nashville-Davidson metropolitan government (balance)
No livability data for this city. (Only ~50 U.S. cities are tracked.)
Census & demographics
- Census place
- Nashville-Davidson metropolitan government (balance), TN
- County
- Davidson County · 680,067 people
- City population
- 677,595
- Metro
- Nashville-Davidson--Murfreesboro--Franklin, TN
- Population (ZIP)
- 40,615
- Household income
- $54,566
- Rent vs Own
- Severe rent burden
- 2759.0
Population outlook (Davidson County) Hauer SSP2
- Today (2025)
- 808,568 people
- By 2030
- 874,489 · +8.2%
- By 2040
- 1,009,046 · +24.8%
- By 2050
- 1,147,294 · +41.9%
- By 2075
- 1,475,439 · +82.5%
- By 2100
- 1,714,101 · +112.0%
Race, ethnicity, and origin ACS 2023
- Neighborhood character
- Diverse neighborhood (Simpson 0.70)
- Race & ethnicity
- White 37% Black 32% Hispanic / Latino 26% Two or more races 12% Asian 2%
- Hispanic origin (detail)
- Mexican 13% Cuban 2%
- Common ancestry
- Serbian 1% Italian 1% Iranian 1%
- Foreign-born
- 18% · Canada
- Languages at home
- 74% English-only · Spanish 22% Tagalog/Filipino 1% Other Indo-European 1%
Political lean MEDSL · Davidson
- 2024 margin
- Strong D (+27.4) · D 62.7% · R 35.3% · Other 2.0%
- 2008→2024 swing
- +6.5pp toward D · 2008: 21.0pp · 2024: 27.4pp
- All cycles
- 2024: D+27.4 2020: D+32.1 2016: D+26.0 2012: D+18.7 2008: D+21.0
Not yet ingested
- Civics
- —
Market trends
- HPI YoY
- ▼ -259.74%
- Current HPI
- 341.9614
- Rent YoY
- ▼ -0.94%
- Metro
- Nashville-Davidson--Murfreesboro--Franklin, TN
- State GDP YoY
- ▲ 2.78%
- F500 in state
- 22
Industry mix (Fortune 500 HQ in TN)
| Industry | F500 HQs | Revenue |
|---|---|---|
| Healthcare | 3 | $91B |
|
||
| Retail | 3 | $72B |
|
||
| Transportation / Logistics | 1 | $88B |
|
||
| Paper / Packaging | 1 | $19B |
|
||
| Insurance | 1 | $13B |
|
||
| Energy | 1 | $12B |
|
||
Price history
+240.1% since first listed8 events — show timeline
- 2026-06-01 Coming Soon $100,000 REALTRACS as Distributed by MLS Grid
- 2023-09-29 Sold (MLS) $173,000 REALTRACS as Distributed by MLS Grid
- 2023-08-24 Contingent — REALTRACS as Distributed by MLS Grid
- 2023-08-15 Listed $173,000 REALTRACS as Distributed by MLS Grid
- 2023-08-14 Coming Soon $173,000 REALTRACS as Distributed by MLS Grid
- 1982-04-01 Sold (Public Records) $33,152 Public Records
- 1980-10-01 Sold (Public Records) $33,900 Public Records
- 1979-01-01 Sold (Public Records) $29,400 Public Records
Property tax history
+14.9%/yrLatest (2025): $1,222 · +55.2% YoY. Source: county tax records.
Cash-flow waterfall
monthlySold comps — $/sqft
last 12 mo · ≤1 miLoading sold comps…