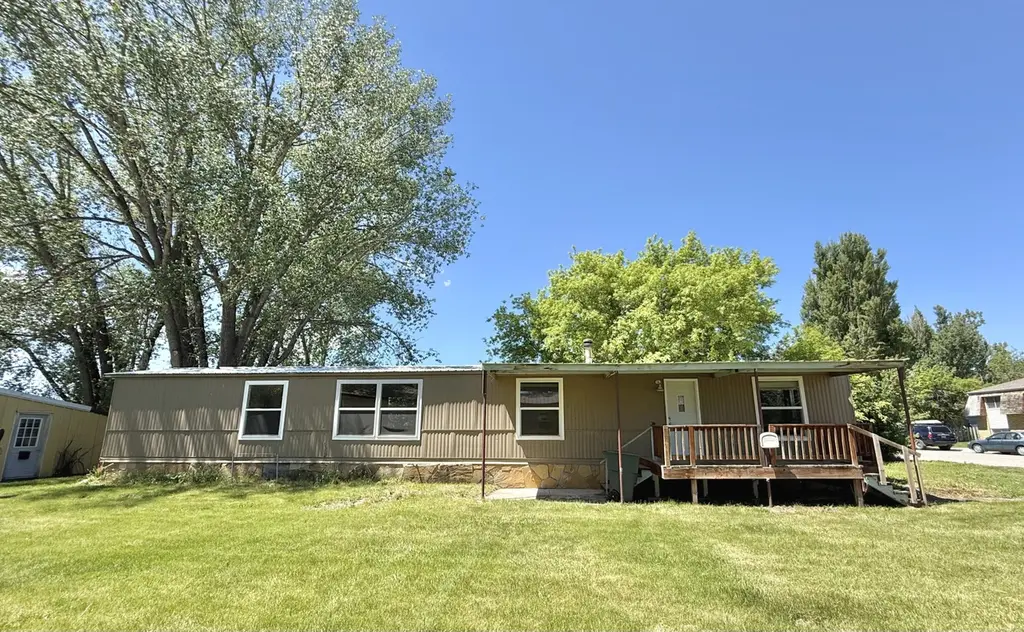
706 Halbert St · Ranchester, WY
Flood risk 1/10 · Minimal
- FEMA flood zone
- X (unshaded)
- Chance of flooding over 30 yrs
- 0.0%
- Est. flood insurance / yr
- $507 – $1,088
Fire risk 7/10 · Major
- Est. fire insurance / yr
- $564 – $1,046
Heat risk 3/10 · Minor
- Hot days now (above 93°F)
- 7 days/yr
- Hot days in 30 yrs
- 16 days/yr
Wind risk 1/10 · Minimal
- Chance of severe wind over 30 yrs
- —
Air-quality risk 3/10 · Minor
- Unhealthy air days now
- 1 days/yr
- Unhealthy air days in 30 yrs
- 5 days/yr
Risk factors via First Street. Map © Google.
Why this score? — see what drove the B+ grade
The composite is a weighted blend of 9 inputs, each scored 0–100. Each bar is that input's sub-score; the figure is the points it added to the 100-point composite (weight × sub-score).
- Cash flow +30.0/30.0
- 1% rule +10.0/10.0
- DSCR +10.0/10.0
- ARV discount +7.5/15.0
- Schools +5.8/10.0
- Appreciation +4.9/10.0
- Condition / age +3.8/5.0
- Livability +3.3/5.0
- Rent growth +2.5/5.0
$47,500
🖨 Deal sheet 📄 Offer letter ✓ Due diligence
Key facts
- Laminate flooring
- Tile in the kitchen
- Newer windows
Tags
Property features AI
Exterior
- Utilities: Public sewer (connected)
- Home design: Residential mobile home
- Construction: Metal roof
- Exterior features: Covered patio/porch; Deck; Partial fenced yard; Shed(s)
Interior
- Heating & cooling: Propane heating with forced air; Has heating
- Interior features: Pantry
Neighborhood map
What this means for you Summary
Snapshot
- This is a 3-bed/2.0-bath manufactured listed at $48k. Condition is rated good.
Deal economics
- At list price, monthly cash flow is $837 ($10k/yr) — positive.
- The deal already cash-flows at list — no discount required.
- Meets the 1% rule at list price ($1k rent vs $48k).
Location & tenants
- Location reads 66/100 on livability (#69 in WY) — a middle-class / working-renter tenant base. Strengths: crime A+, housing A+, cost of living A; Watch: amenities F, commute F, health & safety F.
- Sheridan County School District #1 (rural): math 64% / reading 69% proficiency, ranked #2 of 41 in WY (top 5%) — acceptable for families but not a draw, mixed tenant base, ~2y average lease; only 17% free/reduced lunch — higher-income household profile.
- Market conditions: 22 active listings in the ZIP; 2 comparable units currently listed for rent nearby; 309 units permitted in Sheridan County in 2024 (92 in 5+ unit buildings).
Forward outlook
- In year one you build about $191 of equity ($328 loan paydown + $-137 appreciation (-0.3% local appreciation)).
- Sheridan County population projected at +8% by 2050 — modest demand growth; plan on rents tracking national, not racing it.
- At projected returns (-0.3% appreciation + 3.0% rent growth), your $13k cash investment doubles in ~2 years — after that, you're playing with house money.
Negotiation context
- Only 11 days on market — expect competitive offers; lowballing is unlikely to land.
Risks & watch-outs
- Climate carrying-cost: major wildfire risk — expect insurance premiums to compound above CPI over the hold.
Questions for the listing agent
- Built in 1974 — when were the roof, HVAC, electrical panel, plumbing, and water heater last replaced?
- Is there a deadline driving the sale (1031 exchange, divorce, estate, relocation)? That informs how much negotiation room exists.
- Schools are B-rated — typically a magnet for longer-tenancy family renters. What's the average tenant stay here, and is there a school-zone premium baked into asking?
- What's the average days-on-market for RENTAL listings here right now (not sales)? A rising rental-DOM trend means longer vacancies and softer asking-rent achievability than the comps imply.
- What's the recent tenant-quality profile in this submarket — average credit score on applications, eviction rate, late-payment / NSF rate, and stable-employment percentage? A property-management company in the area should have these aggregated.
- How much new for-sale + rental construction is in the pipeline within 1–3 miles? Heavy new supply typically softens prices + rents 12–24 months out; constrained supply supports both.
Investment metrics
- 1% rule
- 3.11% ✓
- Cap rate
- 27.44%
- Cash-on-cash
- 75.52%
- DSCR
- 4.36
- GRM
- 2.7
CMA / ARV
No comps found within radius.
Projected returns pro-forma
-0.29% appreciation · 3.0% rent growth · sell at horizon
- IRR
- 77.5%
- Equity multiple
- 4.86×
- Total profit
- $51,302
- Equity at exit
- $13,112
- IRR
- 79.3%
- Equity multiple
- 9.94×
- Total profit
- $118,926
- Equity at exit
- $15,228
Cash invested: $13,300 (down + closing). Projections, not guarantees.
Landlord ↔ Tenant lean methodology
- Overall (STATE)
- 90 Strongly Landlord-Friendly
- State Wyoming
- 90 Strongly Landlord-Friendly · R+25
- County
- — inherits STATE
- City
- — inherits STATE
ZIP-level market 82839
- Home prices YoY
- -0.2%
- Active inventory
- 22
- Price-to-rent
- 2.7×
Monthly cashflow live
- Estimated rent
- $1,475 medium interval (Pro) →
- Mortgage (P&I)
- −$249
- Tax est. 1.5%
- −$59 /mo · $712/yr
- Insurance
- −$20
- HOA
- −$0
- Vacancy / Maint / Mgmt
- −$310
- Net cashflow
- $837
Break-even live
UW: 25.0% down · 7.5% · 30yr · 1.5% tax · 5.0% vac · 8.0% maint · 8.0% mgmt
Financing live
Cash to close
- Down payment
- $11,875
- Closing costs
- $1,425
- Reserves months
- —
- Total cash needed
- —
Loan-product check · same deal, 3 products live
Conventional
25% down · 7.5% · 30yr
- Down + closing
- —
- Monthly P&I
- —
- Monthly cashflow
- —
- DSCR
- —
- Eligible?
- —
Personal DTI + credit; lowest rate.
DSCR
20% down · 8.5% · 30yr
- Down + closing
- —
- Monthly P&I
- —
- Monthly cashflow
- —
- DSCR
- —
- Eligible?
- —
No personal income docs; deal must DSCR.
Hard money
10% down · 12.0% · 12mo
- Down + closing
- —
- Monthly P&I
- —
- Monthly cashflow
- —
- DSCR
- —
- Eligible?
- —
Short-term bridge; refi at stabilization.
Rent comps 2 comps
| Address | Beds | Baths | Sqft | Rent | $/sqft | DOM | Units | Dist |
|---|---|---|---|---|---|---|---|---|
| 1405 Windsor Dr Unit C Ranchester, WY | 2.0 | 1.0 | 798 | $1,450 | $1.82 | 21d | 1 | 0.75mi |
| 1405 Windsor Dr Unit B Ranchester, WY | 2.0 | 1.0 | 808 | $1,500 | $1.86 | 21d | 1 | 0.76mi |
Listing history 8 events
-
2026-06-19days on market $47,500 Active 11 DOM
-
2026-06-18days on market $47,500 Active 10 DOM
-
2026-06-17days on market $47,500 Active 9 DOM
-
2026-06-16days on market $47,500 Active 8 DOM
-
2026-06-15days on market $47,500 Active 7 DOM
-
2026-06-14days on market $47,500 Active 5 DOM
-
2026-06-12days on market $47,500 Active 4 DOM
-
2026-06-09$47,500 Active 1 DOM
ⓘ Source: listings_history table (triggers on properties + properties_extension) + one-shot
backfill from property_details.listing_events for pre-trigger history.
Climate risk First Street
- Flood 1/10 Low FEMA zone X (unshaded) · 0% chance over 30 yrs
- Wildfire 7/10 Severe
- Heat 3/10 Moderate 7 d/yr ≥93°F today · 16 d/yr by 30 yrs out
- Wind 1/10 Low
- Air quality 3/10 Moderate 1 unhealthy d/yr today · 5 by 30 yrs out
Nearby sold comps map
Loading sold comps map…
Walkable amenities ~0.75 mi
Loading nearby amenities…
Taxation est. · year 1
- Rental income
- $17,700
- − Mortgage interest
- −$2,661
- − Property taxes
- −$712
- − Insurance
- −$238
- − Repairs & maintenance
- −$1,416
- − Management
- −$1,416
- − Depreciation
- −$1,382
- Taxable income
- $9,876
- Est. tax owed @ 24.0%
- −$2,370
- After-tax cash flow
- $7,674/yr
For passive investors: Depreciation is non-cash, so a rental often shows a tax loss while cash-flowing — sheltering income. Rental losses are passive: they offset passive income freely, and up to $25,000/yr can offset ordinary (W-2) income if you actively participate and your MAGI is under $100k (phasing out to $0 by $150k); unused losses carry forward. On sale, claimed depreciation is recaptured at up to 25%, and gains may owe capital-gains tax (a 1031 exchange can defer both). Figures are a year-1 estimate at your 24.0% rate — not tax advice; consult a CPA.
Condition & rehab AI · 12 photos
This manufactured home is in good condition with minimal repairs needed. Painting the exterior and updating the kitchen and bathrooms would significantly increase its value.
Value-add opportunities
- Both Paint exterior siding — Enhances curb appeal and value
- Resale Replace countertops — Modernizes kitchen and adds value
- Resale Install new flooring in bathrooms — Improves aesthetics and functionality
Renovation cost estimate screening
Value-add ROI direction
- Both Paint exterior siding — Enhances curb appeal and value ↑
- Resale Replace countertops — Modernizes kitchen and adds value ↑
- Resale Install new flooring in bathrooms — Improves aesthetics and functionality ↑
ⓘ Cost ranges are severity-bucket heuristics (US national rule-of-thumb). Get contractor quotes + a written scope before underwriting a rehab budget.
Schools (NCES district)
- District
- Sheridan County School District #1
- NCES district ID
- 5605690
- Math proficiency
- 64% ▲ 1.00%
- Reading proficiency
- 69% ▲ 1.00%
- Median HH income
- $62,798
- Composite
- 57.68/100
- National rank
- #1059
- State rank
- #2 of 41 in WY
Livability — Ranchester
- Score
- 66/100
- State rank
- #69
- US rank
- #11341
Category grades
Schools grade is shown separately in the Schools card above.
Census & demographics
- Census place
- Ranchester, WY
- Population (ZIP)
- 1,421
Population outlook (Sheridan County) Hauer SSP2
- Today (2025)
- 32,048 people
- By 2030
- 32,834 · +2.5%
- By 2040
- 33,843 · +5.6%
- By 2050
- 34,744 · +8.4%
- By 2075
- 37,231 · +16.2%
- By 2100
- 37,261 · +16.3%
Race, ethnicity, and origin ACS 2023
- Neighborhood character
- Predominantly White (95%)
- Race & ethnicity
- White 95% Native American 2% Two or more races 2% Hispanic / Latino 1%
- Common ancestry
- Portuguese 4% Romanian 3% Slovak 2%
- Foreign-born
- 0%
Political lean MEDSL · Sheridan
- 2024 margin
- Solid R (+50.1) · D 24.2% · R 74.2% · Other 1.6%
- 2008→2024 swing
- -11.9pp toward R · 2008: -38.2pp · 2024: -50.1pp
- All cycles
- 2024: R+50.1 2020: R+47.5 2016: R+51.7 2012: R+46.8 2008: R+38.2
Not yet ingested
- Civics
- —
Market trends
- HPI YoY
- ▼ -0.29%
- Current HPI
- 163.95
- Rent YoY
- —
- Metro
- —
- State GDP YoY
- —
- F500 in state
- 0
Price history
1 event — show timeline
- 2026-06-03 Listed $47,500 SBORWY
Cash-flow waterfall
monthlySold comps — $/sqft
last 12 mo · ≤1 miLoading sold comps…