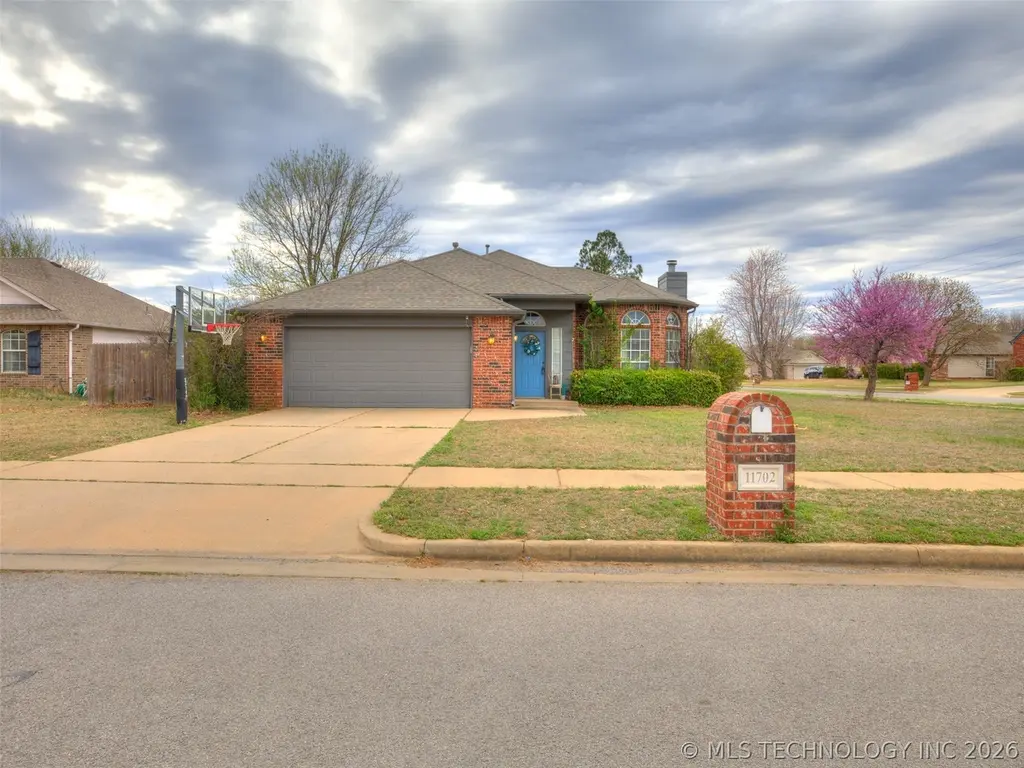
11702 S Gum Ave · Jenks, OK
Flood risk 1/10 · Minimal
- FEMA flood zone
- X (unshaded)
- Chance of flooding over 30 yrs
- 0.0%
- Est. flood insurance / yr
- $473 – $860
Fire risk 6/10 · Moderate
- Est. fire insurance / yr
- $2,463 – $4,575
Heat risk 6/10 · Moderate
- Hot days now (above 112°F)
- 7 days/yr
- Hot days in 30 yrs
- 18 days/yr
Wind risk 3/10 · Minor
- Chance of severe wind over 30 yrs
- 5.0%
Air-quality risk 2/10 · Minimal
- Unhealthy air days now
- 1 days/yr
- Unhealthy air days in 30 yrs
- 1 days/yr
Risk factors via First Street. Map © Google.
Why this score? — see what drove the D- grade
The composite is a weighted blend of 9 inputs, each scored 0–100. Each bar is that input's sub-score; the figure is the points it added to the 100-point composite (weight × sub-score).
- Cash flow +12.0/30.0
- ARV discount +8.7/15.0
- Livability +3.6/5.0
- DSCR +3.5/10.0
- Rent growth +3.3/5.0
- Schools +3.2/10.0
- 1% rule +3.0/10.0
- Condition / age +2.5/5.0
- Appreciation +0.0/10.0
$279,000
🖨 Deal sheet 📄 Offer letter ✓ Due diligence
Listing remarks MLS
Move-in ready with newer roof, beautifully updated kitchen with a large eating area and pantry. Great room with high ceilings and cozy fireplace is open to the kitchen. Spacious vaulted master with his & her closets. Located on an oversized corner lot with full privacy fence. Neighborhood trails and park are one block away. Easy access to shopping, medical and highways. Flexible floor plan and a Formal dining that makes a great office. Well maintained and a Must see!
Key facts
- Quiet corner lot
- Neighborhood trails
- Covered patio
Tags
Property features AI
Finance
- HOA & community: Homeowners association with annual fee; Association fee: $135 annually; Community amenities include park and trails; Community features include gutters and sidewalks
Exterior
- Parking: Attached garage; 2 garage spaces
- Security: Smoke detectors; No safety shelter
- Utilities: Cable available; Electricity available; Natural gas available; Public water; Public sewer
- Home design: Single-story home; Faces east; Slab foundation
- Construction: Brick and wood-frame construction; Asphalt/fiberglass roof
- Exterior features: Concrete driveway; Rain gutters; Covered patio and porch; Full privacy fencing; Corner lot
Interior
- Kitchen: Kitchen with breakfast nook and pantry; Dishwasher; Disposal; Microwave; Oven; Range; Granite counters; Laminate counters
- Bedrooms: Master bedroom with private bath and walk-in closet (First floor); Bedroom with walk-in closet (First floor)
- Flooring: Laminate flooring; Tile flooring
- Bathrooms: Master bath with bathtub, double sink, full bath, vent (First floor); Hall bath with bathtub, double sink, full bath, vent (First floor)
- Heating & cooling: Central heating (gas); Central air conditioning
- Interior features: Attic; Granite counters; Laminate counters; High ceilings; Vaulted ceilings; High-speed internet; Cable TV; Wired for data; Ceiling fans; Gas range connection; Gas oven connection; Aluminum-frame insulated windows; Insulated doors
- Laundry & utility: Utility room inside (First floor); Washer hookup; Electric dryer hookup; Gas dryer hookup; Gas water heater
Neighborhood map
What this means for you Summary
Snapshot
- This is a 3-bed/2.0-bath single-family listed at $279k.
Deal economics
- At list price, monthly cash flow is $-68 ($-815/yr) — negative.
- To cash-flow at today's rent, offer at most $267k (4.3% below list).
- To meet the 1% rule (rent ≥ 1% of price), the offer needs to be $224k (19.8% below list).
- Recommended offer: $224k (19.8% below list) — sets the bar for 1% rule.
- Cap rate 6.0% vs local median 3.5% in Jenks — top-decile yield for the area; either an underpriced asset or a hidden risk that comps aren't pricing in. Stress-test before assuming the spread holds.
Location & tenants
- Location reads 71/100 on livability (#33 in OK) — a middle-class / working-renter tenant base. Strengths: employment A+, housing A+, crime A; Watch: amenities F, commute F, health & safety F.
- Jenks (suburban): math 34% / reading 35% proficiency, ranked #27 of 270 in OK (top 10%) — families likely to look elsewhere, expect single-tenant / working-renter base with shorter leases.
- Market conditions: Rents rising (+3.2%/yr); 258 active listings in the ZIP; 3 comparable units currently listed for rent nearby; rentals leasing fast (median 2d on market — plan ~1-2 weeks tenant-placement turnaround); solid renter incomes; 2,818 units permitted in Tulsa County in 2024 (518 in 5+ unit buildings).
Forward outlook
- Local home prices are declining (-3.0%/yr); year-one equity from $2k of loan paydown is wiped out by about $8k of value loss. Plan a longer hold.
- Tulsa County population projected at +30% by 2050 — long-run rental-demand tailwind backs the buy-and-hold thesis.
Negotiation context
- It's been on market 31 days — a 3% lower offer ($271k) is reasonable based on typical stale-listing flexibility.
- 5 sale attempts since 21y ago; this cycle's ask has dropped $18k (6%) from the opening price — seller is motivated, your offer sets the floor, not the list.
- Current owner paid $197k; 42% above their basis — modest negotiation headroom, anchor on the comps not their cost.
Risks & watch-outs
- Climate carrying-cost: major wildfire risk; extreme-heat days projected 7→18/yr by 2055 (HVAC capex compounding) — expect insurance premiums to compound above CPI over the hold.
Questions for the listing agent
- What do current leases actually rent for vs. the listed asking? Can we see a recent rent roll and the last 12 months of T-12 income?
- It's been on market 31 days. Have you received any prior offers? Is the seller open to a 20% concession, seller financing, or rate buy-down credit?
- What does the HOA fee cover, when was the last increase, and are there any pending special assessments or reserve-fund shortfalls?
- Is there a deadline driving the sale (1031 exchange, divorce, estate, relocation)? That informs how much negotiation room exists.
- The area grade is low — what's the realistic commute time and amenity access for the typical tenant pool here? Any planned neighborhood developments (good or bad) we should know about?
- What's the average days-on-market for RENTAL listings here right now (not sales)? A rising rental-DOM trend means longer vacancies and softer asking-rent achievability than the comps imply.
- What's the recent tenant-quality profile in this submarket — average credit score on applications, eviction rate, late-payment / NSF rate, and stable-employment percentage? A property-management company in the area should have these aggregated.
- How much new for-sale + rental construction is in the pipeline within 1–3 miles? Heavy new supply typically softens prices + rents 12–24 months out; constrained supply supports both.
Investment metrics
- 1% rule
- 0.80% ✗
- Cap rate
- 6.00%
- Cash-on-cash
- -1.04%
- DSCR
- 0.95
- GRM
- 10.4
CMA / ARV
- ARV (on-the-fly)
- $286,450
- Comps found
- 12
Show comp detail 12 sales within ~0.75 mi
| Address | Dist | Beds/Ba | Sqft | Sold | Price | $/sf | Match |
|---|---|---|---|---|---|---|---|
| 11702 S Gum Ave | 0.00mi | 3/2.0 | 1,731 (+3%) | 1mo | $270,000 | $156 | 95 |
| 11701 S Forest Ct | 0.19mi | 3/2.0 | 1,762 (+5%) | 0mo | $300,000 | $170 | 83 |
| 11602 S Mulberry Ln | 0.47mi | 3/2.0 | 1,704 (+1%) | 2mo | $288,995 | $170 | 74 |
| 211 W 114th Ct S | 0.47mi | 3/2.0 | 1,724 (+2%) | 1mo | $280,000 | $162 | 73 |
| 11229 S Nandina Ave | 0.66mi | 3/2.0 | 1,640 (-3%) | 2mo | $305,000 | $186 | 64 |
| 712 W 119th St S | 0.25mi | 3/2.0 | 1,474 (-12%) | 5mo | $250,000 | $170 | 64 |
| 11407 S Locust Ave | 0.41mi | 3/2.0 | 1,882 (+12%) | 3mo | $302,000 | $160 | 59 |
| 12021 S Forest Pl | 0.41mi | 3/2.0 | 1,472 (-13%) | 3mo | $265,000 | $180 | 58 |
| 1018 W 120th Ct S | 0.41mi | 4/2.0 (+1) | 1,851 (+10%) | 3mo | $305,000 | $165 | 57 |
| 626 W 120th St | 0.35mi | 3/2.0 | 1,438 (-15%) | 4mo | $255,000 | $177 | 56 |
| 1704 W 120th St S | 0.74mi | 4/2.0 (+1) | 1,825 (+8%) | 2mo | $275,000 | $151 | 45 |
| 12004 S Nandina Ave | 0.68mi | 3/2.0 | 1,905 (+13%) | 7mo | $285,000 | $150 | 41 |
Match score weights: distance 35% · size 25% · config 20% · recency 20%. Top-matched comps best support the ARV.
Projected returns pro-forma
-3.0% appreciation · 3.2% rent growth · sell at horizon
- IRR
- -17.8%
- Equity multiple
- 0.37×
- Total profit
- $-49,111
- Equity at exit
- $41,600
- IRR
- -9.6%
- Equity multiple
- 0.40×
- Total profit
- $-46,576
- Equity at exit
- $24,123
Cash invested: $78,120 (down + closing). Projections, not guarantees.
Landlord ↔ Tenant lean methodology
- Overall (STATE)
- 83 Strongly Landlord-Friendly
- State Oklahoma
- 83 Strongly Landlord-Friendly · R+20
- County
- — inherits STATE
- City
- — inherits STATE
ZIP-level market 74037
- Home prices YoY
- -23.3%
- Rents YoY
- 3.2%
- Active inventory
- 258
- Price-to-rent
- 10.4×
Monthly cashflow live
- Estimated rent
- $2,237 medium interval (Pro) →
- Mortgage (P&I)
- −$1,463
- Tax from tax record
- −$244 /mo · $2,934/yr
- Insurance
- −$116
- HOA
- −$11
- Vacancy / Maint / Mgmt
- −$470
- Net cashflow
- $-68
Break-even live
UW: 25.0% down · 7.5% · 30yr · 1.5% tax · 5.0% vac · 8.0% maint · 8.0% mgmt
Financing live
Cash to close
- Down payment
- $69,750
- Closing costs
- $8,370
- Reserves months
- —
- Total cash needed
- —
Loan-product check · same deal, 3 products live
Conventional
25% down · 7.5% · 30yr
- Down + closing
- —
- Monthly P&I
- —
- Monthly cashflow
- —
- DSCR
- —
- Eligible?
- —
Personal DTI + credit; lowest rate.
DSCR
20% down · 8.5% · 30yr
- Down + closing
- —
- Monthly P&I
- —
- Monthly cashflow
- —
- DSCR
- —
- Eligible?
- —
No personal income docs; deal must DSCR.
Hard money
10% down · 12.0% · 12mo
- Down + closing
- —
- Monthly P&I
- —
- Monthly cashflow
- —
- DSCR
- —
- Eligible?
- —
Short-term bridge; refi at stabilization.
Rent comps 3 comps
| Address | Beds | Baths | Sqft | Rent | $/sqft | DOM | Units | Dist |
|---|---|---|---|---|---|---|---|---|
| 806 W 118th St S Jenks, OK | 3.0 | 3.0 | 1950 | $2,299 | $1.18 | 1d | 1 | 0.20mi |
| 11906 S Juniper Ct Jenks, OK | 3.0 | 2.0 | 1799 | $2,200 | $1.22 | 1d | 1 | 0.38mi |
| 1224 W 112th Dr S Jenks, OK | 3.0 | 3.0 | 1818 | $1,950 | $1.07 | 15d | 1 | 0.58mi |
HOA detail
- Monthly dues
- $11 · $132/yr
Listing history 20 events
-
2026-04-25status Pending
-
2026-04-21price $279,000
-
2026-04-16price $288,000
-
2026-04-09price $289,000
-
2026-04-02price $294,500
-
2026-03-25$297,000 Active
-
2019-11-28soldstatus $196,900 Closed 477-char remark
Show marketing remark (477 chars)
Move-in ready with newer roof, beautifully updated kitchen with a large eating area and pantry. Great room with high ceilings and cozy fireplace is open to the kitchen. Spacious vaulted master with his & her closets. Located on an oversized corner lot with full privacy fence. Neighborhood trails and park are one block away. Easy access to shopping, medical and highways. Flexible floor plan and a Formal dining that makes a great office. Well maintained and a Must see!
-
2019-11-18soldstatus $197,000
-
2019-10-10status Pending 477-char remark
Show marketing remark (477 chars)
Move-in ready with newer roof, beautifully updated kitchen with a large eating area and pantry. Great room with high ceilings and cozy fireplace is open to the kitchen. Spacious vaulted master with his & her closets. Located on an oversized corner lot with full privacy fence. Neighborhood trails and park are one block away. Easy access to shopping, medical and highways. Flexible floor plan and a Formal dining that makes a great office. Well maintained and a Must see!
-
2019-09-27$197,900 Active 477-char remark
Show marketing remark (477 chars)
Move-in ready with newer roof, beautifully updated kitchen with a large eating area and pantry. Great room with high ceilings and cozy fireplace is open to the kitchen. Spacious vaulted master with his & her closets. Located on an oversized corner lot with full privacy fence. Neighborhood trails and park are one block away. Easy access to shopping, medical and highways. Flexible floor plan and a Formal dining that makes a great office. Well maintained and a Must see!
-
2008-12-04soldstatus $139,000
-
2008-12-01soldstatus $139,000 263-char remark
Show marketing remark (263 chars)
LOWEST PRICED HOME IN CHURCHILL PARK!! This move-in ready home is located on an oversized corner lot, adjacent to neighborhood park and greenbelt. You get new paint in & out 7/08, flexible floor plan, 1 yr warranty & motivated seller, this won't last.
-
2008-11-21historical 263-char remark
Show marketing remark (263 chars)
LOWEST PRICED HOME IN CHURCHILL PARK!! This move-in ready home is located on an oversized corner lot, adjacent to neighborhood park and greenbelt. You get new paint in & out 7/08, flexible floor plan, 1 yr warranty & motivated seller, this won't last.
-
2008-08-25historical
-
2008-08-19$149,000 263-char remark
Show marketing remark (263 chars)
LOWEST PRICED HOME IN CHURCHILL PARK!! This move-in ready home is located on an oversized corner lot, adjacent to neighborhood park and greenbelt. You get new paint in & out 7/08, flexible floor plan, 1 yr warranty & motivated seller, this won't last.
-
2008-05-16$155,000
-
2005-05-17historical
-
2005-05-10$155,000
-
2000-09-21soldstatus $120,000
-
1998-11-25soldstatus $215,000
ⓘ Source: listings_history table (triggers on properties + properties_extension) + one-shot
backfill from property_details.listing_events for pre-trigger history.
Tax reassessment forecast OK · Resets to sale price
- Current annual tax
- $2,934 · $244/mo
- Projected year-2 tax
- $2,934 · $244/mo
- Expected delta
- $0/yr ($0/mo · 0.0%)
ⓘ Screening estimate from a state-policy table — verify with the county assessor before closing.
Climate risk First Street
- Flood 1/10 Low FEMA zone X (unshaded) · 0% chance over 30 yrs
- Wildfire 6/10 Major
- Heat 6/10 Major 7 d/yr ≥112°F today · 18 d/yr by 30 yrs out
- Wind 3/10 Moderate 5% chance of damaging wind over 30 yrs
- Air quality 2/10 Low 1 unhealthy d/yr today · 1 by 30 yrs out
Nearby sold comps map
Loading sold comps map…
Walkable amenities ~0.75 mi
Loading nearby amenities…
Taxation est. · year 1
- Rental income
- $26,839
- − Mortgage interest
- −$15,628
- − Property taxes
- −$2,934
- − Insurance
- −$1,395
- − Repairs & maintenance
- −$2,147
- − Management
- −$2,147
- − HOA
- −$132
- − Depreciation
- −$8,116
- Taxable loss
- −$5,661
- Est. tax savings @ 24.0%
- +$1,359
- After-tax cash flow
- $543/yr
For passive investors: Depreciation is non-cash, so a rental often shows a tax loss while cash-flowing — sheltering income. Rental losses are passive: they offset passive income freely, and up to $25,000/yr can offset ordinary (W-2) income if you actively participate and your MAGI is under $100k (phasing out to $0 by $150k); unused losses carry forward. On sale, claimed depreciation is recaptured at up to 25%, and gains may owe capital-gains tax (a 1031 exchange can defer both). Figures are a year-1 estimate at your 24.0% rate — not tax advice; consult a CPA.
Schools (NCES district)
- District
- Jenks
- NCES district ID
- 4015720
- Math proficiency
- 34% ▼ -9.00%
- Reading proficiency
- 35% ▼ -8.00%
- Median HH income
- $66,291
- Composite
- 31.5/100
- National rank
- #5973
- State rank
- #27 of 270 in OK
Livability — Jenks
- Score
- 71/100
- State rank
- #33
- US rank
- #7270
Category grades
Schools grade is shown separately in the Schools card above.
Census & demographics
- Census place
- Jenks, OK
- County
- Tulsa County · 640,811 people
- City population
- 24,547
- Metro
- Tulsa, OK
- Population (ZIP)
- 24,547
- Household income
- $103,942
- Rent vs Own
- Severe rent burden
- 233.0
Population outlook (Tulsa County) Hauer SSP2
- Today (2025)
- 723,846 people
- By 2030
- 766,033 · +5.8%
- By 2040
- 851,386 · +17.6%
- By 2050
- 938,389 · +29.6%
- By 2075
- 1,166,011 · +61.1%
- By 2100
- 1,350,277 · +86.5%
Race, ethnicity, and origin ACS 2023
- Neighborhood character
- Diverse neighborhood (Simpson 0.58)
- Race & ethnicity
- White 64% Two or more races 14% Asian 11% Hispanic / Latino 8% Native American 6% Black 3%
- Hispanic origin (detail)
- Mexican 4% Puerto Rican 2%
- Common ancestry
- Slovak 3% Italian 3% Lithuanian 2%
- Foreign-born
- 10% · Philippines, Canada, China
- Languages at home
- 86% English-only · Other Asian/Pacific 6% Spanish 4% Russian/Polish/Slavic 1%
Political lean MEDSL · Tulsa
- 2024 margin
- R (+15.2) · D 41.3% · R 56.5% · Other 2.2%
- 2008→2024 swing
- +9.2pp toward D · 2008: -24.5pp · 2024: -15.2pp
- All cycles
- 2024: R+15.2 2020: R+15.6 2016: R+22.9 2012: R+27.4 2008: R+24.5
Not yet ingested
- Civics
- —
Market trends
- HPI YoY
- ▼ -62.99%
- Current HPI
- 207.6174
- Rent YoY
- ▲ 3.20%
- Metro
- Tulsa, OK
- State GDP YoY
- ▲ 1.55%
- F500 in state
- 6
Industry mix (Fortune 500 HQ in OK)
| Industry | F500 HQs | Revenue |
|---|---|---|
| Energy | 3 | $48B |
|
||
Price history
+29.8% since first listed20 events — show timeline
- 2026-04-25 Pending — MLS Technology, Inc.
- 2026-04-21 Price Changed $279,000 MLS Technology, Inc.
- 2026-04-16 Price Changed $288,000 MLS Technology, Inc.
- 2026-04-09 Price Changed $289,000 MLS Technology, Inc.
- 2026-04-02 Price Changed $294,500 MLS Technology, Inc.
- 2026-03-25 Listed $297,000 MLS Technology, Inc.
- 2019-11-28 Sold (MLS) $196,900 MLS Technology, Inc.
- 2019-11-18 Sold (Public Records) $197,000 Public Records
- 2019-10-10 Pending — MLS Technology, Inc.
- 2019-09-27 Listed $197,900 MLS Technology, Inc.
- 2008-12-04 Sold (Public Records) $139,000 Public Records
- 2008-12-01 Sold (MLS) $139,000 MLS Technology, Inc.
- 2008-11-21 Listing Removed — MLS Technology, Inc.
- 2008-08-25 Listing Removed — MLS Technology, Inc.
- 2008-08-19 Listed $149,000 MLS Technology, Inc.
- 2008-05-16 Listed $155,000 MLS Technology, Inc.
- 2005-05-17 Listing Removed — MLS Technology, Inc.
- 2005-05-10 Listed $155,000 MLS Technology, Inc.
- 2000-09-21 Sold (Public Records) $120,000 Public Records
- 1998-11-25 Sold (Public Records) $215,000 Public Records
Property tax history
+3.2%/yrLatest (2025): $2,934 · +2.2% YoY. Source: county tax records.
Cash-flow waterfall
monthlySold comps — $/sqft
last 12 mo · ≤1 miLoading sold comps…