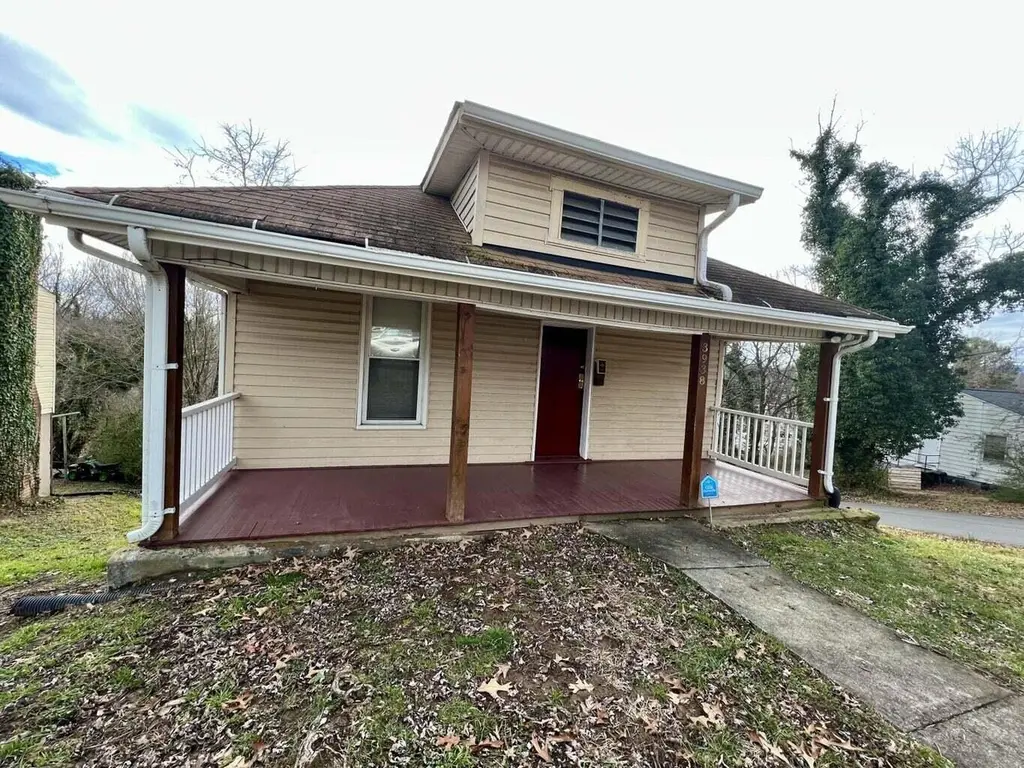
3938 Virginia Ave NW · Roanoke, VA
Flood risk 1/10 · Minimal
- FEMA flood zone
- X (unshaded)
- Chance of flooding over 30 yrs
- 0.0%
- Est. flood insurance / yr
- $473 – $860
Fire risk 1/10 · Minimal
- Est. fire insurance / yr
- $666 – $1,236
Heat risk 5/10 · Moderate
- Hot days now (above 101°F)
- 7 days/yr
- Hot days in 30 yrs
- 18 days/yr
Wind risk 2/10 · Minimal
- Chance of severe wind over 30 yrs
- 1.0%
Air-quality risk 1/10 · Minimal
- Unhealthy air days now
- 0 days/yr
- Unhealthy air days in 30 yrs
- 0 days/yr
Risk factors via First Street. Map © Google.
Why this score? — see what drove the C+ grade
The composite is a weighted blend of 9 inputs, each scored 0–100. Each bar is that input's sub-score; the figure is the points it added to the 100-point composite (weight × sub-score).
- Cash flow +22.3/30.0
- ARV discount +15.0/15.0
- DSCR +7.1/10.0
- 1% rule +5.4/10.0
- Schools +4.1/10.0
- Rent growth +3.9/5.0
- Livability +3.7/5.0
- Condition / age +2.5/5.0
- Appreciation +0.0/10.0
$129,950
🖨 Deal sheet 📄 Offer letter ✓ Due diligence
Listing remarks MLS
MOVE IN READY! FRESHLY PAINTED AND REPLACEMENT WINDOWS. NEW LVP FLOORS - FORCED AIR GAS HEAT - THREE BEDROOMS AND ONE FULL BATHROOM - CLOSE TO RESTAURANTS, PUBLIC TRANSPORTATION, AND GROCERY STORES - GREAT FIRST HOME OR INVESTMENT PROPERTY!
Key facts
- 6,500 sq ft lot
- 2 parking spots
- Built 1950
Neighborhood map
What this means for you Summary
Snapshot
- This is a 3-bed/1.0-bath single-family listed at $130k.
Deal economics
- At list price, monthly cash flow is $214 ($3k/yr) — positive.
- The deal already cash-flows at list — no discount required.
- Meets the 1% rule at list price ($1k rent vs $130k).
- Recommended offer: $118k (9.0% below list) — sets the bar for market timing.
- Cap rate 8.3% vs local median 4.2% in Roanoke — top-decile yield for the area; either an underpriced asset or a hidden risk that comps aren't pricing in. Stress-test before assuming the spread holds.
Location & tenants
- Location reads 73/100 on livability (#163 in VA) — a middle-class / working-renter tenant base. Strengths: cost of living A+, health & safety A+, housing A; Watch: amenities C-, employment D, crime F.
- Roanoke City Public School District (urban): math 40% / reading 58% proficiency, ranked #102 of 131 in VA (top 78%) — families likely to look elsewhere, expect single-tenant / working-renter base with shorter leases; 67% free/reduced lunch — lower-income household profile, screen leases tightly.
- Market conditions: Rents rising fast (+5.7%/yr); 151 active listings in the ZIP; 11 comparable units currently listed for rent nearby; rentals leasing fast (median 14d on market — plan ~1-2 weeks tenant-placement turnaround); 113 units permitted in Roanoke city in 2024 (0 in 5+ unit buildings).
- This rent runs 34% of the median local income ($47k/yr) — at the standard rent-burdened threshold; future hikes will face affordability resistance.
Forward outlook
- Local home prices are declining (-3.0%/yr); year-one equity from $898 of loan paydown is wiped out by about $4k of value loss. Plan a longer hold.
- Roanoke County population projected at +11% by 2050 — modest demand growth; plan on rents tracking national, not racing it.
- At projected returns (-3.0% appreciation + 5.7% rent growth), your $36k cash investment doubles in ~10 years — after that, you're playing with house money.
Negotiation context
- It's been on market 101 days — a 9% lower offer ($118k) is reasonable based on typical stale-listing flexibility.
- 9 sale attempts since 23y ago with the ask held roughly flat each time — persistent listings suggest the price (not the market) is what's stuck; bring a comps-based counter.
- Current owner paid $12k; list at $130k implies a 983% gain — meaningful room to come down on a strong offer.
Risks & watch-outs
- Watch-outs: built in 1950 — expect roof / HVAC / electrical / plumbing capex.
- Climate carrying-cost: extreme-heat days projected 7→18/yr by 2055 (HVAC capex compounding) — expect insurance premiums to compound above CPI over the hold.
Questions for the listing agent
- It's been on market 101 days. Have you received any prior offers? Is the seller open to a 9% concession, seller financing, or rate buy-down credit?
- Built in 1950 — when were the roof, HVAC, electrical panel, plumbing, and water heater last replaced?
- Why hasn't it sold? Are there any deal-killer items the seller is aware of (foundation, flood, title, zoning, code violations)?
- Is there a deadline driving the sale (1031 exchange, divorce, estate, relocation)? That informs how much negotiation room exists.
- Schools are A-rated — typically a magnet for longer-tenancy family renters. What's the average tenant stay here, and is there a school-zone premium baked into asking?
- Crime grade is F in this area — have there been break-ins, vandalism, or insurance claims at this property in the last 3 years? What carrier currently insures it and at what premium?
- What's the average days-on-market for RENTAL listings here right now (not sales)? A rising rental-DOM trend means longer vacancies and softer asking-rent achievability than the comps imply.
- What's the recent tenant-quality profile in this submarket — average credit score on applications, eviction rate, late-payment / NSF rate, and stable-employment percentage? A property-management company in the area should have these aggregated.
- How much new for-sale + rental construction is in the pipeline within 1–3 miles? Heavy new supply typically softens prices + rents 12–24 months out; constrained supply supports both.
Investment metrics
- 1% rule
- 1.04% ✓
- Cap rate
- 8.27%
- Cash-on-cash
- 7.05%
- DSCR
- 1.31
- GRM
- 8.0
CMA / ARV
- ARV (median comp)
- $156,865
- List price
- $129,950
- Delta
- -17.16%
- Verdict
- UNDERPRICED
- Comps
- 20 within 1.0 mi
Show comp detail 12 sales within ~0.75 mi
| Address | Dist | Beds/Ba | Sqft | Sold | Price | $/sf | Match |
|---|---|---|---|---|---|---|---|
| 4031 Tennessee Ave NW | 0.23mi | 2/1.0 (-1) | 750 (0%) | 7mo | $160,000 | $213 | 79 |
| 1301 Monroe St NW | 0.15mi | 3/1.0 | 785 (+5%) | 11mo | $80,000 | $102 | 76 |
| 3926 Maine Ave NW | 0.13mi | 3/1.0 | 812 (+8%) | 7mo | $147,340 | $181 | 75 |
| 3911 Michigan Ave NW | 0.19mi | 2/1.0 (-1) | 676 (-10%) | 3mo | $160,000 | $237 | 68 |
| 3933 Dakota Ave NW | 0.11mi | 2/1.0 (-1) | 825 (+10%) | 9mo | $150,000 | $182 | 66 |
| 3925 Vermont Ave NW | 0.09mi | 2/2.0 (-1) | 704 (-6%) | 14mo | $160,000 | $227 | 65 |
| 3931 Tyler Ave NW | 0.25mi | 2/1.0 (-1) | 672 (-10%) | 6mo | $80,000 | $119 | 61 |
| 3923 Michigan Ave NW | 0.18mi | 3/1.5 | 828 (+10%) | 17mo | $160,000 | $193 | 58 |
| 4044 Kentucky Ave NW | 0.27mi | 2/2.0 (-1) | 823 (+10%) | 6mo | $160,000 | $194 | 57 |
| 3810 Vermont Ave NW | 0.17mi | 3/1.0 | 850 (+13%) | 19mo | $145,000 | $171 | 54 |
| 4414 Surrey Ave NW | 0.62mi | 2/1.0 (-1) | 713 (-5%) | 10mo | $161,000 | $226 | 50 |
| 4134 Wyoming Ave NW | 0.37mi | 3/1.0 | 828 (+10%) | 22mo | $145,000 | $175 | 47 |
Match score weights: distance 35% · size 25% · config 20% · recency 20%. Top-matched comps best support the ARV.
Projected returns pro-forma
-3.0% appreciation · 5.71% rent growth · sell at horizon
- IRR
- -2.6%
- Equity multiple
- 0.90×
- Total profit
- $-3,641
- Equity at exit
- $19,376
- IRR
- 9.8%
- Equity multiple
- 1.85×
- Total profit
- $30,832
- Equity at exit
- $11,236
Cash invested: $36,386 (down + closing). Projections, not guarantees.
Landlord ↔ Tenant lean methodology
- Overall (STATE)
- 55 Moderately Landlord-Leaning
- State Virginia
- 55 Moderately Landlord-Leaning · D+2
- County
- — inherits STATE
- City
- — inherits STATE
ZIP-level market 24017
- Home prices YoY
- -28.3%
- Rents YoY
- 5.7%
- Active inventory
- 151
- Price-to-rent
- 8.0×
Monthly cashflow live
- Estimated rent
- $1,357 high interval (Pro) →
- Mortgage (P&I)
- −$681
- Tax from tax record
- −$122 /mo · $1,466/yr
- Insurance
- −$54
- HOA
- −$0
- Vacancy / Maint / Mgmt
- −$285
- Net cashflow
- $214
Break-even live
UW: 25.0% down · 7.5% · 30yr · 1.5% tax · 5.0% vac · 8.0% maint · 8.0% mgmt
Financing live
Cash to close
- Down payment
- $32,488
- Closing costs
- $3,898
- Reserves months
- —
- Total cash needed
- —
Loan-product check · same deal, 3 products live
Conventional
25% down · 7.5% · 30yr
- Down + closing
- —
- Monthly P&I
- —
- Monthly cashflow
- —
- DSCR
- —
- Eligible?
- —
Personal DTI + credit; lowest rate.
DSCR
20% down · 8.5% · 30yr
- Down + closing
- —
- Monthly P&I
- —
- Monthly cashflow
- —
- DSCR
- —
- Eligible?
- —
No personal income docs; deal must DSCR.
Hard money
10% down · 12.0% · 12mo
- Down + closing
- —
- Monthly P&I
- —
- Monthly cashflow
- —
- DSCR
- —
- Eligible?
- —
Short-term bridge; refi at stabilization.
Rent comps 11 comps
| Address | Beds | Baths | Sqft | Rent | $/sqft | DOM | Units | Dist |
|---|---|---|---|---|---|---|---|---|
| 4310 Tyree Rd NW Roanoke, VA | 3.0 | 1.0 | 913 | $1,650 | $1.81 | 13d | 1 | 0.35mi |
| 3802 Panorama Ave NW #12 Roanoke, VA | 3.0 | 1.0 | 1100 | $995 | $0.90 | 44d | 1 | 0.51mi |
| 3802 Panorama Ave NW #6 Roanoke, VA | 2.0 | 1.0 | 900 | $1,050 | $1.17 | 44d | 1 | 0.51mi |
| 3802 Panorama Ave NW #2 Roanoke, VA | 2.0 | 1.0 | 900 | $995 | $1.11 | 44d | 1 | 0.51mi |
| 3340 Hershberger Rd NW Roanoke, VA | 2.0 | 1.0 | 924 | $1,050 | $1.14 | 44d | 1 | 1.00mi |
| 3533 Ferncliff Ave NW Roanoke, VA | 1.0–3.0 | 1.0 | 980 | $1,426 | $1.46 | 13d | 11 | 1.15mi |
| 2744 Melrose Ave NW Roanoke, VA | 1.0–2.0 | 1.0–1.5 | 936 | $1,045 | $1.12 | 13d | 7 | 1.21mi |
| 733 29th St NW Roanoke, VA | 2.0–3.0 | 2.0 | 1022 | $1,625 | $1.59 | 13d | 4 | 1.23mi |
| 1331 Dudley St NW Roanoke, VA | 2.0 | 1.0 | 700 | $1,500 | $2.14 | 13d | 1 | 1.31mi |
| 1741 Pexton Ave Salem, VA | 3.0 | 1.0 | 792 | $1,452 | $1.83 | 13d | 1 | 1.36mi |
| 2215 Montauk Rd NW Roanoke, VA | 1.0–2.0 | 1.0–1.5 | 653 | $1,425 | $2.18 | 13d | 5 | 1.43mi |
Listing history 42 events
-
2026-06-18days on market $129,950 Active 101 DOM
-
2026-06-17days on market $129,950 Active 100 DOM
-
2026-06-16days on market $129,950 Active 99 DOM
-
2026-06-15days on market $129,950 Active 98 DOM
-
2026-06-14days on market $129,950 Active 96 DOM
-
2026-06-13days on market $129,950 Active 95 DOM
-
2026-06-10days on market $129,950 Active 93 DOM
-
2026-06-09days on market $129,950 Active 92 DOM
-
2026-06-08days on market $129,950 Active 91 DOM
-
2026-06-05days on market $129,950 Active 87 DOM
-
2026-06-03days on market $129,950 Active 86 DOM
-
2026-06-02days on market $129,950 Active 85 DOM
-
2026-06-01days on market $129,950 Active 84 DOM
-
2026-05-31days on market $129,950 Active 83 DOM
-
2026-05-30days on market $129,950 Active 82 DOM
-
2026-03-09$129,950 Active 240-char remark
Show marketing remark (240 chars)
MOVE IN READY! FRESHLY PAINTED AND REPLACEMENT WINDOWS. NEW LVP FLOORS - FORCED AIR GAS HEAT - THREE BEDROOMS AND ONE FULL BATHROOM - CLOSE TO RESTAURANTS, PUBLIC TRANSPORTATION, AND GROCERY STORES - GREAT FIRST HOME OR INVESTMENT PROPERTY!
-
2026-02-27historical
-
2026-02-25price $129,950
-
2025-08-17status Active
-
2025-08-12historical
-
2025-02-12$130,950 Active
-
2025-02-10historical
-
2024-08-10$130,950 Active
-
2024-07-25status Active
-
2024-06-12status Pending
-
2024-06-12historical
-
2024-05-06price $130,950
-
2024-03-29price $131,450
-
2024-02-09$131,950 Active
-
2024-02-08historical
-
2024-02-01price $131,950
-
2023-12-13price $132,450
-
2023-10-18price $132,950
-
2023-09-25price $133,450
-
2023-09-07price $133,950
-
2023-08-23price $134,450
-
2023-08-08$134,950 Active
-
2023-08-07historical
-
2023-02-10$134,950 Active
-
2004-04-16historical
-
2003-10-17$47,950
-
1993-10-12soldstatus $12,000
ⓘ Source: listings_history table (triggers on properties + properties_extension) + one-shot
backfill from property_details.listing_events for pre-trigger history.
Tax reassessment forecast VA · Resets to sale price
- Current annual tax
- $1,466 · $122/mo
- Projected year-2 tax
- $1,466 · $122/mo
- Expected delta
- $0/yr ($0/mo · 0.0%)
ⓘ Screening estimate from a state-policy table — verify with the county assessor before closing.
Climate risk First Street
- Flood 1/10 Low FEMA zone X (unshaded) · 0% chance over 30 yrs
- Wildfire 1/10 Low
- Heat 5/10 Major 7 d/yr ≥101°F today · 18 d/yr by 30 yrs out
- Wind 2/10 Low 100% chance of damaging wind over 30 yrs
- Air quality 1/10 Low 0 unhealthy d/yr today · 0 by 30 yrs out
Nearby sold comps map
Loading sold comps map…
Walkable amenities ~0.75 mi
Loading nearby amenities…
Taxation est. · year 1
- Rental income
- $16,279
- − Mortgage interest
- −$7,279
- − Property taxes
- −$1,466
- − Insurance
- −$650
- − Repairs & maintenance
- −$1,302
- − Management
- −$1,302
- − Depreciation
- −$3,780
- Taxable income
- $498
- Est. tax owed @ 24.0%
- −$120
- After-tax cash flow
- $2,447/yr
For passive investors: Depreciation is non-cash, so a rental often shows a tax loss while cash-flowing — sheltering income. Rental losses are passive: they offset passive income freely, and up to $25,000/yr can offset ordinary (W-2) income if you actively participate and your MAGI is under $100k (phasing out to $0 by $150k); unused losses carry forward. On sale, claimed depreciation is recaptured at up to 25%, and gains may owe capital-gains tax (a 1031 exchange can defer both). Figures are a year-1 estimate at your 24.0% rate — not tax advice; consult a CPA.
Schools (NCES district)
- District
- Roanoke City Public School District
- NCES district ID
- 5103300
- Math proficiency
- 40% ▼ -38.00%
- Reading proficiency
- 58% ▼ -12.00%
- Median HH income
- $38,592
- Composite
- 40.8/100
- National rank
- #3639
- State rank
- #102 of 131 in VA
Livability — Roanoke
- Score
- 73/100
- State rank
- #163
- US rank
- #5055
Category grades
Schools grade is shown separately in the Schools card above.
Census & demographics
- Census place
- Roanoke, VA
- County
- Roanoke City · 101,625 people
- City population
- 168,930
- Metro
- Roanoke, VA
- Population (ZIP)
- 23,678
- Household income
- $47,360
- Rent vs Own
- Severe rent burden
- 913.0
Population outlook (Roanoke County) Hauer SSP2
- Today (2025)
- 106,094 people
- By 2030
- 108,927 · +2.7%
- By 2040
- 114,104 · +7.5%
- By 2050
- 118,032 · +11.3%
- By 2075
- 123,363 · +16.3%
- By 2100
- 116,827 · +10.1%
Race, ethnicity, and origin ACS 2023
- Neighborhood character
- Diverse neighborhood (Simpson 0.58)
- Race & ethnicity
- Black 59% White 25% Hispanic / Latino 9% Asian 4% Two or more races 4%
- Hispanic origin (detail)
- Mexican 2% Cuban 1%
- Common ancestry
- Slovak 1% Romanian 1% Lithuanian 1%
- Foreign-born
- 9% · Canada, China, Vietnam
- Languages at home
- 87% English-only · Spanish 8% Other Indo-European 3% German/W. Germanic 1%
Political lean MEDSL · Roanoke
- 2024 margin
- Strong D (+23.6) · D 61.1% · R 37.5% · Other 1.4%
- 2008→2024 swing
- +0.2pp no change · 2008: 23.4pp · 2024: 23.6pp
- All cycles
- 2024: D+23.6 2020: D+25.8 2016: D+17.6 2012: D+21.5 2008: D+23.4
Not yet ingested
- Civics
- —
Market trends
- HPI YoY
- ▼ -78.29%
- Current HPI
- 198.5991
- Rent YoY
- ▲ 5.71%
- Metro
- Roanoke, VA
- State GDP YoY
- ▲ 2.40%
- F500 in state
- 50
Industry mix (Fortune 500 HQ in VA)
| Industry | F500 HQs | Revenue |
|---|---|---|
| Aerospace / Defense | 4 | $236B |
|
||
| Technology / Defense | 3 | $32B |
|
||
| Financial Services | 2 | $176B |
|
||
| Utilities | 2 | $27B |
|
||
| Insurance | 2 | $25B |
|
||
| Technology | 2 | $15B |
|
||
Price history
+982.9% since first listed27 events — show timeline
- 2026-03-09 Listed $129,950 MLSRV
- 2026-02-27 Listing Removed — MLSRV
- 2026-02-25 Price Changed $129,950 MLSRV
- 2025-08-17 Relisted — MLSRV
- 2025-08-12 Listing Removed — MLSRV
- 2025-02-12 Listed $130,950 MLSRV
- 2025-02-10 Listing Removed — MLSRV
- 2024-08-10 Listed $130,950 MLSRV
- 2024-07-25 Relisted — MLSRV
- 2024-06-12 Pending — MLSRV
- 2024-06-12 Listing Removed — MLSRV
- 2024-05-06 Price Changed $130,950 MLSRV
- 2024-03-29 Price Changed $131,450 MLSRV
- 2024-02-09 Listed $131,950 MLSRV
- 2024-02-08 Listing Removed — MLSRV
- 2024-02-01 Price Changed $131,950 MLSRV
- 2023-12-13 Price Changed $132,450 MLSRV
- 2023-10-18 Price Changed $132,950 MLSRV
- 2023-09-25 Price Changed $133,450 MLSRV
- 2023-09-07 Price Changed $133,950 MLSRV
- 2023-08-23 Price Changed $134,450 MLSRV
- 2023-08-08 Listed $134,950 MLSRV
- 2023-08-07 Listing Removed — MLSRV
- 2023-02-10 Listed $134,950 MLSRV
- 2004-04-16 Listing Removed — MLSRV
- 2003-10-17 Listed $47,950 MLSRV
- 1993-10-12 Sold (Public Records) $12,000 Public Records
Property tax history
+7.3%/yrLatest (2025): $1,466 · +18.5% YoY. Source: county tax records.
Cash-flow waterfall
monthlySold comps — $/sqft
last 12 mo · ≤1 miLoading sold comps…