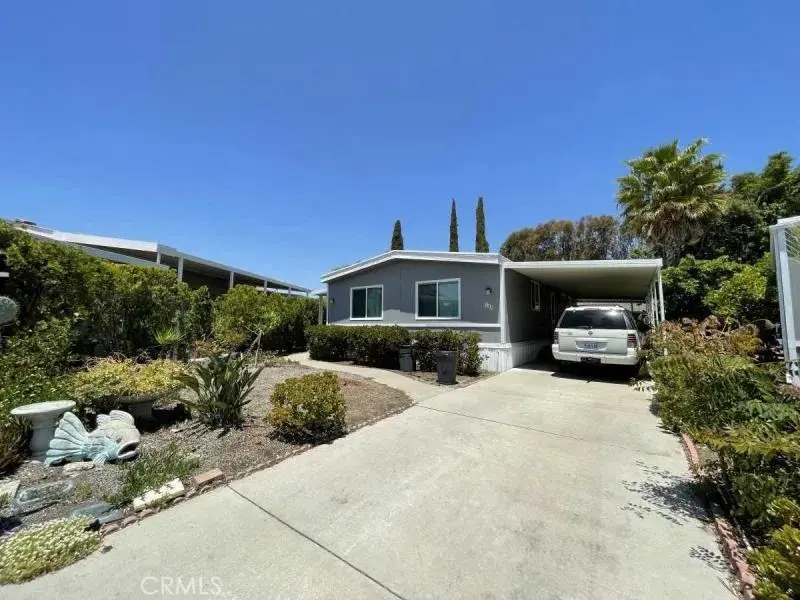
24001 Muirlands Blvd #138 · Lake Forest, CA
Flood risk 1/10 · Minimal
- FEMA flood zone
- X (unshaded)
- Chance of flooding over 30 yrs
- 0.0%
- Est. flood insurance / yr
- $507 – $1,088
Fire risk 1/10 · Minimal
- Est. fire insurance / yr
- $659 – $1,223
Heat risk 5/10 · Moderate
- Hot days now (above 91°F)
- 6 days/yr
- Hot days in 30 yrs
- 19 days/yr
Wind risk 1/10 · Minimal
- Chance of severe wind over 30 yrs
- —
Air-quality risk 4/10 · Minor
- Unhealthy air days now
- 4 days/yr
- Unhealthy air days in 30 yrs
- 5 days/yr
Risk factors via First Street. Map © Google.
Why this score? — see what drove the B- grade
The composite is a weighted blend of 9 inputs, each scored 0–100. Each bar is that input's sub-score; the figure is the points it added to the 100-point composite (weight × sub-score).
- Cash flow +30.0/30.0
- DSCR +10.0/10.0
- 1% rule +9.4/10.0
- Schools +5.6/10.0
- Condition / age +3.8/5.0
- Livability +3.2/5.0
- Rent growth +3.1/5.0
- ARV discount +0.0/15.0
- Appreciation +0.0/10.0
$219,000
🖨 Deal sheet (PDF) 📄 Offer letter ✓ Due diligence
Listing remarks
Community Information Forest Gardens is a 5 Star Gated Community Close to Everything and Beautiful with Lakes and Geese. Winding Roads and Cul De Sac Homes, Lots of Trees & Grass, Large Clubhouse, Workout Area, Spa, Pool, Community Amenities & Lifestyle: - Beautifully Landscaped & Peaceful Community - Experience quiet, well-maintained surroundings. - Resort-Style Pool & Spa - Perfect for socializing and relaxation. - Clubhouse & Social Events - Join an active community with events, fitness classes, and social gatherings. - Paths & Green Spaces - Enjoy daily walks and fresh air. - Nearby Shopping, Dining & Medical Facilities - Convenient access to
Key facts
- Gated community
- Clubhouse
- Private back yard
Tags
Property features AI
Finance
- Other: Subdivision listed as Other (Forest Gardens); Directions available from community entrance
- Financial info: Monthly land lease of $1,295 (park lease)
- HOA & community: Senior community; Community offers pool and spa; Street lighting in community; Park name: Forest Gardens; Manager approval required; Pets allowed with breed restrictions
Exterior
- Parking: Attached carport with 3 spaces
- Utilities: Public sewer; District/public water
- Home design: Double-wide mobile home; Single story; Mobile home remains on site
- Construction: Mobile home 24 x 48 (width x length); Year built reported by builder
- Exterior features: Association in-ground pool; Yard; One shed on property
Interior
- Bathrooms: 2 full bathrooms
- Heating & cooling: Central cooling; Central furnace heating
- Interior features: One-level layout; Entry on main level; Association in-ground spa
- Laundry & utility: Inside laundry
Neighborhood map
What this means for you Summary
Snapshot
- This is a 2-bed/2.0-bath manufactured listed at $219k. Condition is rated good.
Deal economics
- At list price, monthly cash flow is $980 ($12k/yr) — positive.
- The deal already cash-flows at list — no discount required.
- Meets the 1% rule at list price ($3k rent vs $219k).
- Recommended offer: $216k (1.5% below list) — sets the bar for market timing.
- Cap rate 11.7% vs local median 2.0% in Lake Forest — top-decile yield for the area; either an underpriced asset or a hidden risk that comps aren't pricing in. Stress-test before assuming the spread holds.
Location & tenants
- Location reads 65/100 on livability (#387 in CA) — a middle-class / working-renter tenant base. Strengths: crime A+, employment A+, housing B; Watch: commute C-, amenities F, cost of living F.
- Saddleback Valley Unified (suburban): math 51% / reading 73% proficiency, ranked #67 of 517 in CA (top 13%) — acceptable for families but not a draw, mixed tenant base, ~2y average lease.
- Zoned schools: Rancho Canada Elementary (632 students, 34% FRL); Serrano Intermediate (977 students, 48% FRL); El Toro High (math 53% / reading 77%, grade B, #161 of 1,170 statewide, top 14%, 2,031 students, 48% FRL) — zoned schools average 44% FRL vs 22% district-wide (22 pts higher); higher-poverty schools than district average — tighter screening recommended.
- Market conditions: Rents rising (+2.5%/yr); 204 active listings in the ZIP; 9 comparable units currently listed for rent nearby; rentals at typical pace (median 21d on market — plan ~3-4 weeks tenant-placement turnaround); high-income renter base; 6,974 units permitted in Orange County in 2024 (3,839 in 5+ unit buildings).
- This rent runs 30% of the median local income ($126k/yr) — at the standard rent-burdened threshold; future hikes will face affordability resistance.
Forward outlook
- Local home prices are declining (-3.0%/yr); year-one equity from $2k of loan paydown is wiped out by about $7k of value loss. Plan a longer hold.
- Orange County population projected at +14% by 2050 — modest demand growth; plan on rents tracking national, not racing it.
- At projected returns (-3.0% appreciation + 2.5% rent growth), your $61k cash investment doubles in ~7 years — after that, you're playing with house money.
Negotiation context
- It's been on market 20 days — a 2% lower offer ($216k) is reasonable based on typical stale-listing flexibility.
- 3 sale attempts with the ask held roughly flat each time — persistent listings suggest the price (not the market) is what's stuck; bring a comps-based counter.
Risks & watch-outs
- Climate carrying-cost: extreme-heat days projected 6→19/yr by 2055 (HVAC capex compounding) — expect insurance premiums to compound above CPI over the hold.
Questions for the listing agent
- Built in 1975 — when were the roof, HVAC, electrical panel, plumbing, and water heater last replaced?
- Is there a deadline driving the sale (1031 exchange, divorce, estate, relocation)? That informs how much negotiation room exists.
- Schools are B-rated — typically a magnet for longer-tenancy family renters. What's the average tenant stay here, and is there a school-zone premium baked into asking?
- What's the average days-on-market for RENTAL listings here right now (not sales)? A rising rental-DOM trend means longer vacancies and softer asking-rent achievability than the comps imply.
- What's the recent tenant-quality profile in this submarket — average credit score on applications, eviction rate, late-payment / NSF rate, and stable-employment percentage? A property-management company in the area should have these aggregated.
- How much new for-sale + rental construction is in the pipeline within 1–3 miles? Heavy new supply typically softens prices + rents 12–24 months out; constrained supply supports both.
Investment metrics
- 1% rule
- 1.44% ✓
- Cap rate
- 11.66%
- Cash-on-cash
- 19.18%
- DSCR
- 1.85
- GRM
- 5.8
CMA / ARV
- ARV (median comp)
- $179,945
- List price
- $219,000
- Delta
- 21.70%
- Verdict
- OVERPRICED
- Comps
- 20 within 1.0 mi
Show comp detail 2 sales within ~0.75 mi
| Address | Dist | Beds/Ba | Sqft | Sold | Price | $/sf | Match |
|---|---|---|---|---|---|---|---|
| 24001 Muirlands #4 | 0.05mi | 2/2.0 | 1,240 (+8%) | 22mo | $180,000 | $145 | 67 |
| 24001 Murilands Blvd #25 | 0.13mi | 2/2.0 | 1,320 (+15%) | 7mo | $209,000 | $158 | 64 |
Match score weights: distance 35% · size 25% · config 20% · recency 20%. Top-matched comps best support the ARV.
Projected returns pro-forma
-3.0% appreciation · 2.51% rent growth · sell at horizon
- IRR
- 10.6%
- Equity multiple
- 1.41×
- Total profit
- $25,425
- Equity at exit
- $32,654
- IRR
- 19.2%
- Equity multiple
- 2.57×
- Total profit
- $96,409
- Equity at exit
- $18,935
Cash invested: $61,320 (down + closing). Projections, not guarantees.
Landlord ↔ Tenant lean methodology
- Overall (STATE)
- 18 Strongly Tenant-Friendly
- State California
- 18 Strongly Tenant-Friendly · D+13
- County
- — inherits STATE
- City
- — inherits STATE
ZIP-level market 92630
- Rents YoY
- 2.5%
- Active inventory
- 204
- Price-to-rent
- 5.8×
Monthly cashflow live
- Estimated rent
- $3,156 high interval (Pro) →
- Mortgage (P&I)
- −$1,148
- Tax est. 1.5%
- −$274 /mo · $3,285/yr
- Insurance
- −$91
- HOA
- −$0
- Vacancy / Maint / Mgmt
- −$663
- Net cashflow
- $980
Break-even live
Sensitivity live
| Price | -10% $1,131 | -5% $1,056 | +0% $980 | +5% $904 | +10% $829 |
|---|---|---|---|---|---|
| Rent | -10% $731 | -5% $855 | +0% $980 | +5% $1,105 | +10% $1,229 |
| Rate | -1.0pp $1,090 | -0.5pp $1,036 | base $980 | +0.5pp $923 | +1.0pp $865 |
UW: 25.0% down · 7.5% · 30yr · 1.5% tax · 5.0% vac · 8.0% maint · 8.0% mgmt
Financing live
Cash to close
- Down payment
- $54,750
- Closing costs
- $6,570
- Reserves months
- —
- Total cash needed
- —
Loan-product check · same deal, 3 products live
Conventional
25% down · 7.5% · 30yr
- Down + closing
- —
- Monthly P&I
- —
- Monthly cashflow
- —
- DSCR
- —
- Eligible?
- —
Personal DTI + credit; lowest rate.
DSCR
20% down · 8.5% · 30yr
- Down + closing
- —
- Monthly P&I
- —
- Monthly cashflow
- —
- DSCR
- —
- Eligible?
- —
No personal income docs; deal must DSCR.
Hard money
10% down · 12.0% · 12mo
- Down + closing
- —
- Monthly P&I
- —
- Monthly cashflow
- —
- DSCR
- —
- Eligible?
- —
Short-term bridge; refi at stabilization.
Rent comps 9 comps
| Address | Beds | Baths | Sqft | Rent | $/sqft | DOM | Units | Dist |
|---|---|---|---|---|---|---|---|---|
| 22700 Lake Forest Dr Lake Forest, CA | 1.0–3.0 | 1.0–2.0 | 1008 | $3,235 | $3.21 | 1d | 1 | 0.40mi |
| 22602 Cottonwood Cir Lake Forest, CA | 3.0 | 2.0 | 1301 | $4,250 | $3.27 | 45d | 1 | 0.52mi |
| 24246 Swiftriver Ct Lake Forest, CA | 1.0 | 1.5 | 905 | $2,750 | $3.04 | 26d | 1 | 0.59mi |
| 24241 Swiftriver Ct Lake Forest, CA | 1.0 | 1.5 | 905 | $2,850 | $3.15 | 45d | 1 | 0.59mi |
| 23333 Ridge Route Dr Lake Forest, CA | 1.0–2.0 | 1.0–2.0 | 892 | $3,100 | $3.47 | 4d | 9 | 1.06mi |
| 25092 Farthing St Lake Forest, CA | 1.0–2.0 | 1.0–2.0 | 881 | $3,278 | $3.72 | 1d | 5 | 1.32mi |
| 2369 Via Mariposa E Unit 1B Laguna Woods, CA | 2.0 | 2.0 | 1340 | $2,950 | $2.20 | 45d | 1 | 1.36mi |
| 2293 Via Puerta Unit O Laguna Woods, CA | 2.0 | 2.0 | 1057 | $3,100 | $2.93 | 21d | 1 | 1.46mi |
| 2269 Via Puerta Unit N Laguna Woods, CA | 2.0 | 2.0 | 1057 | $2,700 | $2.55 | 21d | 1 | 1.47mi |
Listing history 18 events
-
2026-06-21days on market $219,000 Active 20 DOM
-
2026-06-18days on market $219,000 Active 17 DOM
-
2026-06-17days on market $219,000 Active 16 DOM
-
2026-06-16days on market $219,000 Active 15 DOM
-
2026-06-15days on market $219,000 Active 14 DOM
-
2026-06-13days on market $219,000 Active 12 DOM
-
2026-06-13days on market $219,000 Active 11 DOM
-
2026-06-09days on market $219,000 Active 8 DOM
-
2026-06-08days on market $219,000 Active 7 DOM
-
2026-06-07days on market $219,000 Active 6 DOM
-
2026-06-04days on market $219,000 Active 3 DOM
-
2026-06-03days on market $219,000 Active 2 DOM
-
2026-06-02statusdays on market $219,000 Active 1 DOM
-
2026-05-17historical
-
2026-05-01status Active
-
2026-04-20status Pending Sale
-
2026-04-17price $219,000
-
2026-03-27$215,000 Active
ⓘ Source: listings_history table (triggers on properties + properties_extension) + one-shot
backfill from property_details.listing_events for pre-trigger history.
Climate risk First Street
- Flood 1/10 Low FEMA zone X (unshaded) · 0% chance over 30 yrs
- Wildfire 1/10 Low
- Heat 5/10 Major 6 d/yr ≥91°F today · 19 d/yr by 30 yrs out
- Wind 1/10 Low
- Air quality 4/10 Moderate 4 unhealthy d/yr today · 5 by 30 yrs out
Nearby sold comps map
Loading sold comps map…
Walkable amenities ~0.75 mi
Loading nearby amenities…
Taxation est. · year 1
- Rental income
- $37,875
- − Mortgage interest
- −$12,267
- − Property taxes
- −$3,285
- − Insurance
- −$1,095
- − Repairs & maintenance
- −$3,030
- − Management
- −$3,030
- − Depreciation
- −$6,371
- Taxable income
- $8,796
- Est. tax owed @ 24.0%
- −$2,111
- After-tax cash flow
- $9,648/yr
For passive investors: Depreciation is non-cash, so a rental often shows a tax loss while cash-flowing — sheltering income. Rental losses are passive: they offset passive income freely, and up to $25,000/yr can offset ordinary (W-2) income if you actively participate and your MAGI is under $100k (phasing out to $0 by $150k); unused losses carry forward. On sale, claimed depreciation is recaptured at up to 25%, and gains may owe capital-gains tax (a 1031 exchange can defer both). Figures are a year-1 estimate at your 24.0% rate — not tax advice; consult a CPA.
Condition & rehab AI · 12 photos
This manufactured home is in good condition with cosmetic updates needed to enhance its curb appeal and interior aesthetics.
Value-add opportunities
- Both Painting the exterior and interior — Fresh paint enhances curb appeal and interior aesthetics
- Both Landscaping improvements — Enhances curb appeal and creates a more inviting atmosphere
- Both Updating ceiling fans with modern fixtures — Modernizes the living spaces and improves airflow
Renovation cost estimate screening
Value-add ROI direction
- Both Painting the exterior and interior — Fresh paint enhances curb appeal and interior aesthetics ↑
- Both Landscaping improvements — Enhances curb appeal and creates a more inviting atmosphere ↑
- Both Updating ceiling fans with modern fixtures — Modernizes the living spaces and improves airflow ↑
ⓘ Cost ranges are severity-bucket heuristics (US national rule-of-thumb). Get contractor quotes + a written scope before underwriting a rehab budget.
Schools (NCES district)
- District
- Saddleback Valley Unified
- NCES district ID
- 0633860
- Math proficiency
- 51% ▼ -2.00%
- Reading proficiency
- 73% ▲ 9.00%
- Median HH income
- $85,577
- Composite
- 56.05/100
- National rank
- #1185
- State rank
- #67 of 517 in CA
Livability — Lake Forest
- Score
- 65/100
- State rank
- #387
- US rank
- #13130
Category grades
Schools grade is shown separately in the Schools card above.
Census & demographics
- Census place
- Lake Forest, CA
- County
- Orange County · 3,096,323 people
- City population
- 80,019
- Metro
- Los Angeles-Long Beach-Anaheim, CA
- Population (ZIP)
- 67,152
- Household income
- $125,853
- Rent vs Own
- Severe rent burden
- 2412.0
Population outlook (Orange County) Hauer SSP2
- Today (2025)
- 3,477,456 people
- By 2030
- 3,613,117 · +3.9%
- By 2040
- 3,835,945 · +10.3%
- By 2050
- 3,968,736 · +14.1%
- By 2075
- 4,097,053 · +17.8%
- By 2100
- 3,903,633 · +12.3%
Race, ethnicity, and origin ACS 2023
- Neighborhood character
- Diverse neighborhood (Simpson 0.67)
- Race & ethnicity
- White 47% Hispanic / Latino 27% Asian 19% Two or more races 16% Black 2% Native American 1%
- Hispanic origin (detail)
- Mexican 21%
- Common ancestry
- Slovak 2% Lithuanian 2% Romanian 2%
- Foreign-born
- 28% · Canada, China, Vietnam
- Languages at home
- 62% English-only · Spanish 18% Chinese 4% Other Indo-European 4%
Political lean MEDSL · Orange
- 2024 margin
- Toss-up / Even · D 49.7% · R 47.1% · Other 3.2%
- 2008→2024 swing
- +5.2pp toward D · 2008: -2.6pp · 2024: 2.6pp
- All cycles
- 2024: D+2.6 2020: D+9.0 2016: D+7.7 2012: R+8.3 2008: R+2.6
Not yet ingested
- Civics
- —
Market trends
- HPI YoY
- ▼ -866.99%
- Current HPI
- 436.6189
- Rent YoY
- ▲ 2.51%
- Metro
- Los Angeles-Long Beach-Anaheim, CA
- State GDP YoY
- ▲ 3.21%
- F500 in state
- 116
Industry mix (Fortune 500 HQ in CA)
| Industry | F500 HQs | Revenue |
|---|---|---|
| Technology | 27 | $1,492B |
|
||
| Financial Services | 3 | $174B |
|
||
| Retail | 3 | $44B |
|
||
| Insurance | 3 | $26B |
|
||
| Media / Entertainment | 2 | $115B |
|
||
| Pharmaceuticals / Biotech | 2 | $62B |
|
||
Price history
+1.9% since first listed6 events — show timeline
- 2026-06-01 Listed $219,000 CRMLS
- 2026-05-17 Listing Removed — CRMLS
- 2026-05-01 Relisted — CRMLS
- 2026-04-20 Pending — CRMLS
- 2026-04-17 Price Changed $219,000 CRMLS
- 2026-03-27 Listed $215,000 CRMLS
Cash-flow waterfall
monthlySold comps — $/sqft
last 12 mo · ≤1 miLoading sold comps…