2380 Fm 21 · Rocky Mound, TX
Flood risk 1/10 · Minimal
- FEMA flood zone
- X (unshaded)
- Chance of flooding over 30 yrs
- 0.0%
- Est. flood insurance / yr
- $507 – $1,088
Fire risk 3/10 · Minor
- Est. fire insurance / yr
- $1,222 – $2,270
Heat risk 7/10 · Major
- Hot days now (above 111°F)
- 7 days/yr
- Hot days in 30 yrs
- 25 days/yr
Wind risk 6/10 · Moderate
- Chance of severe wind over 30 yrs
- 27.0%
Air-quality risk 1/10 · Minimal
- Unhealthy air days now
- 0 days/yr
- Unhealthy air days in 30 yrs
- 0 days/yr
Risk factors via First Street. Map © Google.
Why this score? — see what drove the F grade
The composite is a weighted blend of 9 inputs, each scored 0–100. Each bar is that input's sub-score; the figure is the points it added to the 100-point composite (weight × sub-score).
- Cash flow +9.1/30.0
- ARV discount +7.5/15.0
- Schools +3.7/10.0
- DSCR +2.5/10.0
- Rent growth +2.5/5.0
- 1% rule +2.3/10.0
- Livability +2.1/5.0
- Condition / age +1.0/5.0
- Appreciation +0.0/10.0
$199,000
🖨 Deal sheet (PDF) 📄 Offer letter ✓ Due diligence
Listing remarks
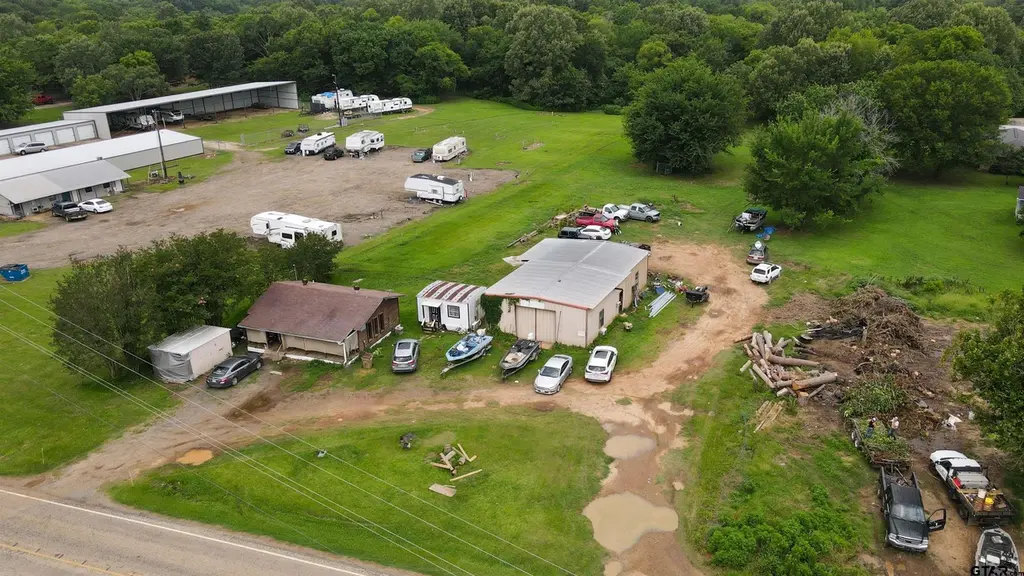
Located just minutes from beautiful Lake Bob Sandlin State Park, this unique East Texas property offers an exceptional opportunity to combine lake living with income-producing potential. The versatile layout lends itself to a variety of uses, whether as a primary residence, weekend retreat, short-term rental, or business venture. Surrounded by the natural beauty of East Texas, the property provides a peaceful setting while remaining conveniently close to one of the area’s most popular recreational destinations. Lake Bob Sandlin attracts visitors year-round for boating, fishing, camping, hiking, and outdoor recreation, creating strong potential for opportunities. Whether you’re e
Key facts
- Retreat space
- Outdoor recreation
- Versatile layout
Tags
Property features AI
Exterior
- Home design: Single family detached residence; 2 stories
- Construction: Metal siding; Aluminum, composition, and metal roof materials
- Exterior features: Porch; Outbuilding; Workshop
Interior
- Kitchen: Electric oven; Refrigerator
- Bathrooms: 3 full bathrooms
- Heating & cooling: Wood stove heating
- Interior features: In-law floorplan
Neighborhood map
What this means for you Summary
Snapshot
- This is a 3-bed/3.0-bath single-family listed at $199k. Condition is rated poor.
Deal economics
- At list price, monthly cash flow is $-154 ($-2k/yr) — negative.
- To cash-flow at today's rent, offer at most $172k (13.7% below list).
- To meet the 1% rule (rent ≥ 1% of price), the offer needs to be $144k (27.4% below list).
- Recommended offer: $144k (27.4% below list) — sets the bar for 1% rule.
- Cap rate 5.4% vs local median 1.1% in Rocky Mound — top-decile yield for the area; either an underpriced asset or a hidden risk that comps aren't pricing in. Stress-test before assuming the spread holds.
Location & tenants
- Location reads 43/100 on livability (#1,576 in TX) — a working-class tenant base; expect higher turnover. Strengths: cost of living A+, crime A; Watch: amenities F, commute F, employment F.
- Mount Pleasant ISD (town): math 45% / reading 44% proficiency, ranked #291 of 826 in TX (top 35%) — families likely to look elsewhere, expect single-tenant / working-renter base with shorter leases; 74% free/reduced lunch — lower-income household profile, screen leases tightly.
- Zoned schools: Child Development Center (452 students, 91% FRL); Mount Pleasant J H (math 40% / reading 45%, grade D-, #553 of 1,662 statewide, top 34%, 760 students, 81% FRL); Mount Pleasant H S (math 68% / reading 54%, grade C+, #258 of 1,632 statewide, top 16%, 1,521 students, 79% FRL).
- Market conditions: 313 active listings in the ZIP; 47 units permitted in Titus County in 2024 (10 in 5+ unit buildings).
Forward outlook
- Local home prices are declining (-3.0%/yr); year-one equity from $1k of loan paydown is wiped out by about $6k of value loss. Plan a longer hold.
Negotiation context
- Only 10 days on market — expect competitive offers; lowballing is unlikely to land.
- 2 sale attempts since 2y ago with the ask held roughly flat each time — persistent listings suggest the price (not the market) is what's stuck; bring a comps-based counter.
Risks & watch-outs
- Climate carrying-cost: major wind risk, 27% chance of damaging wind over 30y; extreme-heat days projected 7→25/yr by 2055 (HVAC capex compounding) — expect insurance premiums to compound above CPI over the hold.
Questions for the listing agent
- What do current leases actually rent for vs. the listed asking? Can we see a recent rent roll and the last 12 months of T-12 income?
- Have any recent inspections been done? Can we get a copy of the seller's disclosures and any deferred-maintenance estimates?
- Is there a deadline driving the sale (1031 exchange, divorce, estate, relocation)? That informs how much negotiation room exists.
- Schools are F-rated, which usually means shorter tenancies and higher turnover. Who's the typical renter profile here, and what's been the actual vacancy rate?
- The area grade is low — what's the realistic commute time and amenity access for the typical tenant pool here? Any planned neighborhood developments (good or bad) we should know about?
- What's the average days-on-market for RENTAL listings here right now (not sales)? A rising rental-DOM trend means longer vacancies and softer asking-rent achievability than the comps imply.
- What's the recent tenant-quality profile in this submarket — average credit score on applications, eviction rate, late-payment / NSF rate, and stable-employment percentage? A property-management company in the area should have these aggregated.
- How much new for-sale + rental construction is in the pipeline within 1–3 miles? Heavy new supply typically softens prices + rents 12–24 months out; constrained supply supports both.
Investment metrics
- 1% rule
- 0.73% ✗
- Cap rate
- 5.36%
- Cash-on-cash
- -3.32%
- DSCR
- 0.85
- GRM
- 11.5
CMA / ARV
No comps found within radius.
Projected returns pro-forma
-3.0% appreciation · 3.0% rent growth · sell at horizon
- IRR
- -21.9%
- Equity multiple
- 0.24×
- Total profit
- $-42,088
- Equity at exit
- $29,672
- IRR
- -15.8%
- Equity multiple
- 0.11×
- Total profit
- $-49,399
- Equity at exit
- $17,206
Cash invested: $55,720 (down + closing). Projections, not guarantees.
Landlord ↔ Tenant lean methodology
- Overall (STATE)
- 87 Strongly Landlord-Friendly
- State Texas
- 87 Strongly Landlord-Friendly · R+5
- County
- — inherits STATE
- City
- — inherits STATE
ZIP-level market 75686
- Home prices YoY
- -21.6%
- Active inventory
- 313
- Price-to-rent
- 11.5×
Monthly cashflow live
- Estimated rent
- $1,444 medium interval (Pro) →
- Mortgage (P&I)
- −$1,044
- Tax from tax record
- −$169 /mo · $2,022/yr
- Insurance
- −$83
- HOA
- −$0
- Vacancy / Maint / Mgmt
- −$303
- Net cashflow
- $-154
Break-even live
Sensitivity live
| Price | -10% $-41 | -5% $-98 | +0% $-154 | +5% $-210 | +10% $-267 |
|---|---|---|---|---|---|
| Rent | -10% $-268 | -5% $-211 | +0% $-154 | +5% $-97 | +10% $-40 |
| Rate | -1.0pp $-54 | -0.5pp $-103 | base $-154 | +0.5pp $-206 | +1.0pp $-258 |
UW: 25.0% down · 7.5% · 30yr · 1.5% tax · 5.0% vac · 8.0% maint · 8.0% mgmt
Financing live
Cash to close
- Down payment
- $49,750
- Closing costs
- $5,970
- Reserves months
- —
- Total cash needed
- —
Loan-product check · same deal, 3 products live
Conventional
25% down · 7.5% · 30yr
- Down + closing
- —
- Monthly P&I
- —
- Monthly cashflow
- —
- DSCR
- —
- Eligible?
- —
Personal DTI + credit; lowest rate.
DSCR
20% down · 8.5% · 30yr
- Down + closing
- —
- Monthly P&I
- —
- Monthly cashflow
- —
- DSCR
- —
- Eligible?
- —
No personal income docs; deal must DSCR.
Hard money
10% down · 12.0% · 12mo
- Down + closing
- —
- Monthly P&I
- —
- Monthly cashflow
- —
- DSCR
- —
- Eligible?
- —
Short-term bridge; refi at stabilization.
Listing history 9 events
-
2026-06-19days on market $199,000 Active 10 DOM
-
2026-06-18days on market $199,000 Active 9 DOM
-
2026-06-17days on market $199,000 Active 8 DOM
-
2026-06-16days on market $199,000 Active 7 DOM
-
2026-06-15days on market $199,000 Active 6 DOM
-
2026-06-14days on market $199,000 Active 4 DOM
-
2026-06-12days on market $199,000 Active 3 DOM
-
2026-06-09remarks 687-char remark
-
2026-06-09$199,000 Active 1 DOM
ⓘ Source: listings_history table (triggers on properties + properties_extension) + one-shot
backfill from property_details.listing_events for pre-trigger history.
Tax reassessment forecast TX · Resets to sale price
- Current annual tax
- $2,022 · $169/mo
- Projected year-2 tax
- $3,642 · $303/mo
- Expected delta
- +$1,619/yr (+$135/mo · 80.1%)
ⓘ Screening estimate from a state-policy table — verify with the county assessor before closing.
Climate risk First Street
- Flood 1/10 Low FEMA zone X (unshaded) · 0% chance over 30 yrs
- Wildfire 3/10 Moderate
- Heat 7/10 Severe 7 d/yr ≥111°F today · 25 d/yr by 30 yrs out
- Wind 6/10 Major 27% chance of damaging wind over 30 yrs
- Air quality 1/10 Low 0 unhealthy d/yr today · 0 by 30 yrs out
Nearby sold comps map
Loading sold comps map…
Walkable amenities ~0.75 mi
Loading nearby amenities…
Taxation est. · year 1
- Rental income
- $17,331
- − Mortgage interest
- −$11,147
- − Property taxes
- −$2,022
- − Insurance
- −$995
- − Repairs & maintenance
- −$1,386
- − Management
- −$1,386
- − Depreciation
- −$5,789
- Taxable loss
- −$5,396
- Est. tax savings @ 24.0%
- +$1,295
- After-tax cash flow
- $-554/yr
For passive investors: Depreciation is non-cash, so a rental often shows a tax loss while cash-flowing — sheltering income. Rental losses are passive: they offset passive income freely, and up to $25,000/yr can offset ordinary (W-2) income if you actively participate and your MAGI is under $100k (phasing out to $0 by $150k); unused losses carry forward. On sale, claimed depreciation is recaptured at up to 25%, and gains may owe capital-gains tax (a 1031 exchange can defer both). Figures are a year-1 estimate at your 24.0% rate — not tax advice; consult a CPA.
Condition & rehab AI · 12 photos
This property requires extensive repairs and maintenance to improve its condition and make it more marketable for both resale and rental.
Repairs flagged
- Major Kitchen cabinets — Cluttered and disorganized, likely in need of replacement.
- Major Bathroom fixtures — Cluttered and disorganized, likely in need of replacement.
- Major Exterior siding — Cluttered and disorganized, likely in need of replacement.
- Major Flooring — Worn and discolored, likely in need of replacement.
- Major Paint — Painted walls appear chipped and dirty, likely in need of repainting.
- Major HVAC system — No visible damage, but may need inspection and cleaning.
- Major Landscaping — Cluttered and disorganized, likely in need of landscaping and maintenance.
Value-add opportunities
- Both Deep cleaning and decluttering — This would improve the home's appearance and make it more marketable for both resale and rental.
- Both Painting — Repainting the walls would improve the home's appearance and make it more marketable for both resale and rental.
- Both Flooring replacement — Replacing the worn flooring would improve the home's appearance and make it more marketable for both resale and rental.
- Both HVAC system inspection and cleaning — This would improve the home's comfort and energy efficiency, making it more marketable for both resale and rental.
- Both Landscaping and curb appeal — This would improve the home's curb appeal and make it more marketable for both resale and rental.
Renovation cost estimate screening
| Repair item | Severity | Est. cost |
|---|---|---|
| Kitchen cabinets · Cluttered and disorganized, likely in need of replacement. | Major | $15,000–50,000 |
| Bathroom fixtures · Cluttered and disorganized, likely in need of replacement. | Major | $15,000–50,000 |
| Exterior siding · Cluttered and disorganized, likely in need of replacement. | Major | $15,000–50,000 |
| Flooring · Worn and discolored, likely in need of replacement. | Major | $15,000–50,000 |
| Paint · Painted walls appear chipped and dirty, likely in need of repainting. | Major | $15,000–50,000 |
| HVAC system · No visible damage, but may need inspection and cleaning. | Major | $15,000–50,000 |
| Landscaping · Cluttered and disorganized, likely in need of landscaping and maintenance. | Major | $15,000–50,000 |
| Total estimated repair cost · 7 items | $105,000–350,000 |
Value-add ROI direction
- Both Deep cleaning and decluttering — This would improve the home's appearance and make it more marketable for both resale and rental. ↑
- Both Painting — Repainting the walls would improve the home's appearance and make it more marketable for both resale and rental. ↑
- Both Flooring replacement — Replacing the worn flooring would improve the home's appearance and make it more marketable for both resale and rental. ↑
- Both HVAC system inspection and cleaning — This would improve the home's comfort and energy efficiency, making it more marketable for both resale and rental. ↑
- Both Landscaping and curb appeal — This would improve the home's curb appeal and make it more marketable for both resale and rental. ↑
ⓘ Cost ranges are severity-bucket heuristics (US national rule-of-thumb). Get contractor quotes + a written scope before underwriting a rehab budget.
Schools (NCES district)
- District
- Mount Pleasant ISD
- NCES district ID
- 4831760
- Math proficiency
- 45% ▼ -7.00%
- Reading proficiency
- 44% ▲ 2.00%
- Median HH income
- $40,642
- Composite
- 37.35/100
- National rank
- #4437
- State rank
- #291 of 826 in TX
Livability — Rocky Mound
- Score
- 43/100
- State rank
- #1576
- US rank
- #26922
Category grades
Schools grade is shown separately in the Schools card above.
Census & demographics
- Population (ZIP)
- 13,427
Population outlook (Titus County) Hauer SSP2
- Today (2025)
- 33,205 people
- By 2030
- 33,187 · -0.1%
- By 2040
- 32,931 · -0.8%
- By 2050
- 32,231 · -2.9%
- By 2075
- 29,507 · -11.1%
- By 2100
- 25,369 · -23.6%
Race, ethnicity, and origin ACS 2023
- Neighborhood character
- Diverse neighborhood (Simpson 0.63)
- Race & ethnicity
- White 52% Hispanic / Latino 28% Two or more races 16% Black 14% Asian 1%
- Hispanic origin (detail)
- Mexican 25%
- Common ancestry
- Slovak 1% Scottish 1% Serbian 1%
- Foreign-born
- 11% · Canada, Vietnam, Dominican Republic
- Languages at home
- 79% English-only · Spanish 20% Vietnamese 1%
Political lean MEDSL · Titus
- 2024 margin
- Solid R (+54.7) · D 22.3% · R 77.0%
- 2008→2024 swing
- -23.5pp toward R · 2008: -31.2pp · 2024: -54.7pp
- All cycles
- 2024: R+54.7 2020: R+44.7 2016: R+42.1 2012: R+39.0 2008: R+31.2
Not yet ingested
- Civics
- —
Market trends
- HPI YoY
- ▼ -50.12%
- Current HPI
- 181.5522
- Rent YoY
- —
- Metro
- —
- State GDP YoY
- ▲ 3.95%
- F500 in state
- 110
Industry mix (Fortune 500 HQ in TX)
| Industry | F500 HQs | Revenue |
|---|---|---|
| Energy | 16 | $1,198B |
|
||
| Technology | 5 | $198B |
|
||
| Engineering / Construction | 4 | $72B |
|
||
| Energy Services | 3 | $60B |
|
||
| Utilities | 3 | $41B |
|
||
| Healthcare | 2 | $330B |
|
||
Price history
-26.3% since first listed6 events — show timeline
- 2026-06-09 Listed $199,000 GTAR
- 2025-05-27 Price Changed $225,000 GTAR
- 2025-02-14 Price Changed $235,000 GTAR
- 2025-01-03 Price Changed $242,500 GTAR
- 2024-09-11 Listing Removed — NTREIS
- 2024-06-09 Listed $269,900 NTREIS
Property tax history
+17.1%/yrLatest (2025): $2,022 · +9.4% YoY. Source: county tax records.
Cash-flow waterfall
monthlySold comps — $/sqft
last 12 mo · ≤1 miLoading sold comps…