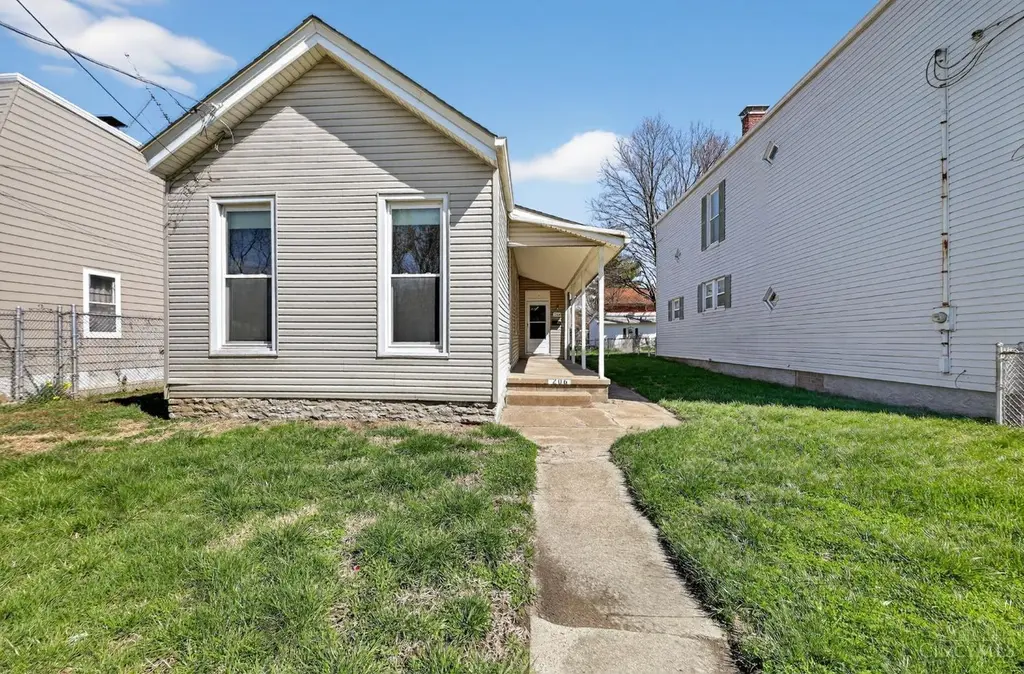
206 W Sixty Ninth St · Cincinnati, OH
Flood risk 8/10 · Major
- FEMA flood zone
- X (unshaded)
- Chance of flooding over 30 yrs
- 0.78%
- Est. flood insurance / yr
- $473 – $860
Fire risk 1/10 · Minimal
- Est. fire insurance / yr
- $713 – $1,323
Heat risk 5/10 · Moderate
- Hot days now (above 103°F)
- 7 days/yr
- Hot days in 30 yrs
- 20 days/yr
Wind risk 2/10 · Minimal
- Chance of severe wind over 30 yrs
- 1.0%
Air-quality risk 3/10 · Minor
- Unhealthy air days now
- 2 days/yr
- Unhealthy air days in 30 yrs
- 3 days/yr
Risk factors via First Street. Map © Google.
Why this score? — see what drove the B grade
The composite is a weighted blend of 9 inputs, each scored 0–100. Each bar is that input's sub-score; the figure is the points it added to the 100-point composite (weight × sub-score).
- Cash flow +29.2/30.0
- ARV discount +15.0/15.0
- DSCR +10.0/10.0
- 1% rule +8.3/10.0
- Livability +4.0/5.0
- Rent growth +2.5/5.0
- Schools +2.5/10.0
- Condition / age +2.5/5.0
- Appreciation +0.0/10.0
$89,900
🖨 Deal sheet 📄 Offer letter ✓ Due diligence
Listing remarks MLS
Nice low-maintenance ranch style home with 2 bedrooms, one bath. Lots of potential to gain sweat equity for the right buyer. Home is unsuitable for FHA/VA financing. Property being sold As-Is.
Key facts
- 6,926 sq ft lot
- Built 1890
- Listed 76 days
Property features AI
Finance
- Other: Residential zoning
- Financial info: Lease not considered
- HOA & community: No HOA
Exterior
- Parking: Driveway
- Security: No security features listed
- Utilities: Public water; Private sewer; Natural gas
- Home design: Traditional single-family home; One level; Stone foundation
- Construction: Vinyl siding; Shingle roof
- Exterior features: Double-hung, double-pane windows
Interior
- Kitchen: Pantry; Laminate flooring; Oven/Range
- Bedrooms: One bedroom on main level (9 x 10)
- Flooring: Laminate floor in kitchen
- Bathrooms: One full bathroom on main level
- Heating & cooling: Forced air gas heating; Central air conditioning; Gas water heating
- Interior features: Four total rooms; Partial unfinished basement
- Laundry & utility: No laundry details provided
Neighborhood map
What this means for you Summary
Snapshot
- This is a 2-bed/1.0-bath single-family listed at $90k.
Deal economics
- At list price, monthly cash flow is $257 ($3k/yr) — positive.
- The deal already cash-flows at list — no discount required.
- Meets the 1% rule at list price ($1k rent vs $90k).
- Recommended offer: $85k (6.0% below list) — sets the bar for market timing.
- Cap rate 10.5% vs local median 3.9% in Cincinnati — top-decile yield for the area; either an underpriced asset or a hidden risk that comps aren't pricing in. Stress-test before assuming the spread holds.
Location & tenants
- Location reads 80/100 on livability (#130 in OH, #1,856 nationally) — a professional / high-income tenant draw. Strengths: amenities A+, commute A+, cost of living A+; Watch: employment D, crime F.
- Cincinnati Public Schools (urban): math 25% / reading 36% proficiency, ranked #581 of 656 in OH (top 89%) — families likely to look elsewhere, expect single-tenant / working-renter base with shorter leases; 70% free/reduced lunch — lower-income household profile, screen leases tightly.
- Market conditions: 19 active listings in the ZIP; 12 comparable units currently listed for rent nearby; rentals at typical pace (median 24d on market — plan ~3-4 weeks tenant-placement turnaround); lower-income renter base — watch delinquency; 801 units permitted in Hamilton County in 2024 (190 in 5+ unit buildings).
- This rent runs 33% of the median local income ($44k/yr) — at the standard rent-burdened threshold; future hikes will face affordability resistance.
Forward outlook
- Local home prices are declining (-3.0%/yr); year-one equity from $622 of loan paydown is wiped out by about $3k of value loss. Plan a longer hold.
- At projected returns (-3.0% appreciation + 3.0% rent growth), your $25k cash investment doubles in ~10 years — after that, you're playing with house money.
Negotiation context
- It's been on market 76 days — a 6% lower offer ($85k) is reasonable based on typical stale-listing flexibility.
- 9 sale attempts since 21y ago; this cycle's ask has dropped $40k (31%) from the opening price — seller is motivated, your offer sets the floor, not the list.
- Current owner paid $41k; list at $90k implies a 118% gain — meaningful room to come down on a strong offer.
Risks & watch-outs
- Watch-outs: flood insurance adds $56/mo; built in 1890 — expect roof / HVAC / electrical / plumbing capex.
- Climate carrying-cost: severe flood risk; extreme-heat days projected 7→20/yr by 2055 (HVAC capex compounding) — expect insurance premiums to compound above CPI over the hold.
Questions for the listing agent
- It's been on market 76 days. Have you received any prior offers? Is the seller open to a 6% concession, seller financing, or rate buy-down credit?
- Built in 1890 — when were the roof, HVAC, electrical panel, plumbing, and water heater last replaced?
- What's the actual annual flood-insurance premium (NFIP or private), and is the property in a SFHA with mandatory coverage?
- Why hasn't it sold? Are there any deal-killer items the seller is aware of (foundation, flood, title, zoning, code violations)?
- Is there a deadline driving the sale (1031 exchange, divorce, estate, relocation)? That informs how much negotiation room exists.
- Schools are B-rated — typically a magnet for longer-tenancy family renters. What's the average tenant stay here, and is there a school-zone premium baked into asking?
- Crime grade is F in this area — have there been break-ins, vandalism, or insurance claims at this property in the last 3 years? What carrier currently insures it and at what premium?
- What's the average days-on-market for RENTAL listings here right now (not sales)? A rising rental-DOM trend means longer vacancies and softer asking-rent achievability than the comps imply.
- What's the recent tenant-quality profile in this submarket — average credit score on applications, eviction rate, late-payment / NSF rate, and stable-employment percentage? A property-management company in the area should have these aggregated.
- How much new for-sale + rental construction is in the pipeline within 1–3 miles? Heavy new supply typically softens prices + rents 12–24 months out; constrained supply supports both.
Investment metrics
- 1% rule
- 1.33% ✓
- Cap rate
- 10.46%
- Cash-on-cash
- 14.88%
- DSCR
- 1.66
- GRM
- 6.2
CMA / ARV
- ARV (on-the-fly)
- $115,362
- Comps found
- 12
Show comp detail 12 sales within ~0.75 mi
| Address | Dist | Beds/Ba | Sqft | Sold | Price | $/sf | Match |
|---|---|---|---|---|---|---|---|
| 125 W Seventieth St | 0.06mi | 2/1.0 | 969 (-2%) | 16mo | $110,000 | $114 | 81 |
| 7123 Fairpark Ave | 0.26mi | 3/1.0 (+1) | 1,072 (+9%) | 1mo | $125,000 | $117 | 68 |
| 215 W Seymour Ave | 0.12mi | 2/1.0 | 1,084 (+10%) | 14mo | $175,000 | $161 | 66 |
| 258 W Seventy Third St | 0.24mi | 3/1.0 (+1) | 1,074 (+9%) | 8mo | $120,000 | $112 | 62 |
| 152 W Seventy Third St | 0.29mi | 3/2.0 (+1) | 1,027 (+4%) | 11mo | $148,500 | $145 | 62 |
| 234 W Seventy Third St | 0.23mi | 3/2.0 (+1) | 1,074 (+9%) | 5mo | $129,000 | $120 | 61 |
| 6148 Cedar Ave | 0.59mi | 2/2.0 | 1,040 (+6%) | 15mo | $122,000 | $117 | 47 |
| 20 W Sixty Sixth St | 0.27mi | 3/2.0 (+1) | 876 (-11%) | 16mo | $150,000 | $171 | 47 |
| 6330 Elmwood Ave | 0.49mi | 1/1.5 (-1) | 912 (-8%) | 17mo | $52,500 | $58 | 43 |
| 317 Locust St | 0.70mi | 2/1.5 | 1,056 (+7%) | 18mo | $43,000 | $41 | 39 |
| 7519 Anthony Wayne Ave | 0.61mi | 2/1.0 | 1,089 (+10%) | 20mo | $127,000 | $117 | 38 |
| 5703 Cedar St | 0.70mi | 3/1.5 (+1) | 1,107 (+12%) | 6mo | $133,000 | $120 | 35 |
Match score weights: distance 35% · size 25% · config 20% · recency 20%. Top-matched comps best support the ARV.
Projected returns pro-forma
-3.0% appreciation · 3.0% rent growth · sell at horizon
- IRR
- 1.9%
- Equity multiple
- 1.07×
- Total profit
- $1,831
- Equity at exit
- $13,404
- IRR
- 11.5%
- Equity multiple
- 1.91×
- Total profit
- $22,879
- Equity at exit
- $7,773
Cash invested: $25,172 (down + closing). Projections, not guarantees.
Landlord ↔ Tenant lean methodology
- Overall (STATE)
- 73 Landlord-Friendly
- State Ohio
- 73 Landlord-Friendly · R+6
- County
- — inherits STATE
- City
- — inherits STATE
ZIP-level market 45216
- Home prices YoY
- -19.1%
- Active inventory
- 19
- Price-to-rent
- 6.2×
Monthly cashflow live
- Estimated rent
- $1,199 high interval (Pro) →
- Mortgage (P&I)
- −$471
- Tax from tax record
- −$127 /mo · $1,519/yr
- Insurance
- −$37
- Flood insurance flood zone
- −$56 /mo · $666/yr
- HOA
- −$0
- Vacancy / Maint / Mgmt
- −$252
- Net cashflow
- $257
Break-even live
UW: 25.0% down · 7.5% · 30yr · 1.5% tax · 5.0% vac · 8.0% maint · 8.0% mgmt
Financing live
Cash to close
- Down payment
- $22,475
- Closing costs
- $2,697
- Reserves months
- —
- Total cash needed
- —
Loan-product check · same deal, 3 products live
Conventional
25% down · 7.5% · 30yr
- Down + closing
- —
- Monthly P&I
- —
- Monthly cashflow
- —
- DSCR
- —
- Eligible?
- —
Personal DTI + credit; lowest rate.
DSCR
20% down · 8.5% · 30yr
- Down + closing
- —
- Monthly P&I
- —
- Monthly cashflow
- —
- DSCR
- —
- Eligible?
- —
No personal income docs; deal must DSCR.
Hard money
10% down · 12.0% · 12mo
- Down + closing
- —
- Monthly P&I
- —
- Monthly cashflow
- —
- DSCR
- —
- Eligible?
- —
Short-term bridge; refi at stabilization.
Rent comps 12 comps
| Address | Beds | Baths | Sqft | Rent | $/sqft | DOM | Units | Dist |
|---|---|---|---|---|---|---|---|---|
| 6602 Hasler Ln Unit 1-6602 Hasler Cincinnati, OH | 1.0 | 1.0 | 800 | $977 | $1.22 | 23d | 1 | 0.40mi |
| 6305 Vine St Unit 2 Cincinnati, OH | 2.0 | 1.0 | 900 | $1,100 | $1.22 | 23d | 1 | 0.41mi |
| 6503 Hasler Ln Unit 2-6503 Hasler Elmwood Place, OH | 2.0 | 1.0 | 750 | $1,250 | $1.67 | 23d | 1 | 0.44mi |
| 1231 Laidlaw Ave Unit 3 Cincinnati, OH | 2.0 | 1.0 | 900 | $1,550 | $1.72 | 23d | 1 | 1.23mi |
| 1421 Ryland Ave Unit 1 Cincinnati, OH | 1.0 | 1.0 | 825 | $825 | $1.00 | 14d | 1 | 1.28mi |
| 7209 Brookcrest Dr Unit 2 Cincinnati, OH | 2.0 | 1.0 | 1100 | $1,395 | $1.27 | 17d | 1 | 1.34mi |
| 7209 Brookcrest Dr Unit 1 Cincinnati, OH | 2.0 | 1.0 | 1100 | $1,395 | $1.27 | 4d | 1 | 1.34mi |
| 239 Parkway Ave Unit 4 Cincinnati, OH | 1.0 | 1.0 | 770 | $795 | $1.03 | 23d | 1 | 1.35mi |
| 7352 Reading Rd Unit 7352-3 Cincinnati, OH | 1.0 | 1.0 | 800 | $995 | $1.24 | 14d | 1 | 1.43mi |
| 375 W Galbraith Rd Unit 361-12 Cincinnati, OH | 1.0 | 1.0 | 567 | $1,099 | $1.94 | 4d | 1 | 1.48mi |
| 375 W Galbraith Rd Unit 361-03 Cincinnati, OH | 2.0 | 1.0 | 730 | $1,149 | $1.57 | 12d | 1 | 1.48mi |
| 375 W Galbraith Rd Unit 361-19 Cincinnati, OH | 1.0 | 1.0 | 567 | $1,099 | $1.94 | 23d | 1 | 1.48mi |
Listing history 39 events
-
2026-06-18price $89,900 Active 76 DOM
-
2026-06-18days on market $94,900 Active 76 DOM
-
2026-06-17days on market $94,900 Active 75 DOM
-
2026-06-16days on market $94,900 Active 74 DOM
-
2026-06-15days on market $94,900 Active 73 DOM
-
2026-06-13days on market $94,900 Active 71 DOM
-
2026-06-13pricedays on market $94,900 Active 70 DOM
-
2026-06-09days on market $103,900 Active 67 DOM
-
2026-06-08days on market $103,900 Active 66 DOM
-
2026-06-07days on market $103,900 Active 65 DOM
-
2026-06-03days on market $103,900 Active 61 DOM
-
2026-06-02days on market $103,900 Active 60 DOM
-
2026-06-01days on market $103,900 Active 59 DOM
-
2026-05-31days on market $103,900 Active 58 DOM
-
2026-05-20price $103,900
-
2026-05-01price $99,900
-
2026-04-21price $109,900
-
2026-04-03$129,900 Active
-
2025-12-30historical 192-char remark
Show marketing remark (192 chars)
Nice low-maintenance ranch style home with 2 bedrooms, one bath. Lots of potential to gain sweat equity for the right buyer. Home is unsuitable for FHA/VA financing. Property being sold As-Is.
-
2025-12-17historical Contingency Pending 192-char remark
Show marketing remark (192 chars)
Nice low-maintenance ranch style home with 2 bedrooms, one bath. Lots of potential to gain sweat equity for the right buyer. Home is unsuitable for FHA/VA financing. Property being sold As-Is.
-
2025-12-15price $104,900 192-char remark
Show marketing remark (192 chars)
Nice low-maintenance ranch style home with 2 bedrooms, one bath. Lots of potential to gain sweat equity for the right buyer. Home is unsuitable for FHA/VA financing. Property being sold As-Is.
-
2025-10-17price $114,900 192-char remark
Show marketing remark (192 chars)
Nice low-maintenance ranch style home with 2 bedrooms, one bath. Lots of potential to gain sweat equity for the right buyer. Home is unsuitable for FHA/VA financing. Property being sold As-Is.
-
2025-09-19$124,900 Active 192-char remark
Show marketing remark (192 chars)
Nice low-maintenance ranch style home with 2 bedrooms, one bath. Lots of potential to gain sweat equity for the right buyer. Home is unsuitable for FHA/VA financing. Property being sold As-Is.
-
2019-05-23soldstatus $41,314 Sold 258-char remark
Show marketing remark (258 chars)
This is a Fannie Mae HomePath Property. Great opportunity in Carthage! Built in 1890, nearly 1000 square feet, 2 bedrooms, 1 bathroom, large eat in kitchen, 3 fireplaces, vinyl siding, fenced yard, and off street parking. Make your move before its too late!
-
2019-05-14historical Accept Backup Offers 258-char remark
Show marketing remark (258 chars)
This is a Fannie Mae HomePath Property. Great opportunity in Carthage! Built in 1890, nearly 1000 square feet, 2 bedrooms, 1 bathroom, large eat in kitchen, 3 fireplaces, vinyl siding, fenced yard, and off street parking. Make your move before its too late!
-
2019-04-08$38,900 Active 258-char remark
Show marketing remark (258 chars)
This is a Fannie Mae HomePath Property. Great opportunity in Carthage! Built in 1890, nearly 1000 square feet, 2 bedrooms, 1 bathroom, large eat in kitchen, 3 fireplaces, vinyl siding, fenced yard, and off street parking. Make your move before its too late!
-
2007-12-31soldstatus $39,900
-
2007-12-19soldstatus $39,900
-
2007-10-10$39,900
-
2007-07-17historical
-
2007-05-16$44,900
-
2007-05-01historical
-
2007-01-31$44,900
-
2007-01-21historical
-
2006-07-20$44,900
-
2006-07-19historical
-
2005-08-29historical
-
2005-08-26$49,900
-
2005-01-18$56,900
ⓘ Source: listings_history table (triggers on properties + properties_extension) + one-shot
backfill from property_details.listing_events for pre-trigger history.
Tax reassessment forecast OH · Partial reset (capped growth)
- Current annual tax
- $1,519 · $127/mo
- Projected year-2 tax
- $1,519 · $127/mo
- Expected delta
- $0/yr ($0/mo · 0.0%)
ⓘ Screening estimate from a state-policy table — verify with the county assessor before closing.
Climate risk First Street
- Flood 8/10 Severe FEMA zone X (unshaded) · 78% chance over 30 yrs
- Wildfire 1/10 Low
- Heat 5/10 Major 7 d/yr ≥103°F today · 20 d/yr by 30 yrs out
- Wind 2/10 Low 100% chance of damaging wind over 30 yrs
- Air quality 3/10 Moderate 2 unhealthy d/yr today · 3 by 30 yrs out
Nearby sold comps map
Loading sold comps map…
Walkable amenities ~0.75 mi
Loading nearby amenities…
Taxation est. · year 1
- Rental income
- $14,393
- − Mortgage interest
- −$5,036
- − Property taxes
- −$1,519
- − Insurance
- −$1,116
- − Repairs & maintenance
- −$1,151
- − Management
- −$1,151
- − Depreciation
- −$2,615
- Taxable income
- $1,804
- Est. tax owed @ 24.0%
- −$433
- After-tax cash flow
- $2,645/yr
For passive investors: Depreciation is non-cash, so a rental often shows a tax loss while cash-flowing — sheltering income. Rental losses are passive: they offset passive income freely, and up to $25,000/yr can offset ordinary (W-2) income if you actively participate and your MAGI is under $100k (phasing out to $0 by $150k); unused losses carry forward. On sale, claimed depreciation is recaptured at up to 25%, and gains may owe capital-gains tax (a 1031 exchange can defer both). Figures are a year-1 estimate at your 24.0% rate — not tax advice; consult a CPA.
Schools (NCES district)
- District
- Cincinnati Public Schools
- NCES district ID
- 3904375
- Math proficiency
- 25% ▼ -19.00%
- Reading proficiency
- 36% ▼ -14.00%
- Median HH income
- $35,743
- Composite
- 25.21/100
- National rank
- #7508
- State rank
- #581 of 656 in OH
Livability — Cincinnati
- Score
- 80/100
- State rank
- #130
- US rank
- #1856
Category grades
Schools grade is shown separately in the Schools card above.
Census & demographics
- Census place
- Cincinnati, OH
- County
- Hamilton County · 701,295 people
- City population
- 505,555
- Metro
- Cincinnati, OH-KY-IN
- Population (ZIP)
- 9,569
- Household income
- $44,099
- Rent vs Own
- Severe rent burden
- 407.0
Population outlook (Hamilton County) Hauer SSP2
- Today (2025)
- 826,054 people
- By 2030
- 830,947 · +0.6%
- By 2040
- 832,319 · +0.8%
- By 2050
- 822,428 · -0.4%
- By 2075
- 788,688 · -4.5%
- By 2100
- 710,674 · -14.0%
Race, ethnicity, and origin ACS 2023
- Neighborhood character
- Diverse neighborhood (Simpson 0.63)
- Race & ethnicity
- White 56% Black 20% Hispanic / Latino 15% Two or more races 10%
- Hispanic origin (detail)
- Mexican 5%
- Common ancestry
- Romanian 2% Serbian 2% Iranian 1%
- Foreign-born
- 12% · Canada, Guatemala
- Languages at home
- 88% English-only · Spanish 11%
Political lean MEDSL · Hamilton
- 2024 margin
- D (+14.9) · D 57.0% · R 42.1%
- 2008→2024 swing
- +7.9pp toward D · 2008: 7.0pp · 2024: 14.9pp
- All cycles
- 2024: D+14.9 2020: D+15.9 2016: D+9.5 2012: D+4.9 2008: D+7.0
Not yet ingested
- Civics
- —
Market trends
- HPI YoY
- ▼ -58.73%
- Current HPI
- 248.8995
- Rent YoY
- —
- Metro
- Cincinnati, OH-KY-IN
- State GDP YoY
- ▲ 1.98%
- F500 in state
- 48
Industry mix (Fortune 500 HQ in OH)
| Industry | F500 HQs | Revenue |
|---|---|---|
| Insurance | 3 | $145B |
|
||
| Industrial Machinery | 3 | $49B |
|
||
| Financial Services | 3 | $24B |
|
||
| Consumer Goods | 2 | $93B |
|
||
| Aerospace / Defense | 2 | $47B |
|
||
| Utilities | 2 | $33B |
|
||
Price history
+82.6% since first listed25 events — show timeline
- 2026-05-20 Price Changed $103,900 Cincy MLS
- 2026-05-01 Price Changed $99,900 Cincy MLS
- 2026-04-21 Price Changed $109,900 Cincy MLS
- 2026-04-03 Listed $129,900 Cincy MLS
- 2025-12-30 Listing Removed — Cincy MLS
- 2025-12-17 Contingent — Cincy MLS
- 2025-12-15 Price Changed $104,900 Cincy MLS
- 2025-10-17 Price Changed $114,900 Cincy MLS
- 2025-09-19 Listed $124,900 Cincy MLS
- 2019-05-23 Sold (MLS) $41,314 Cincy MLS
- 2019-05-14 Contingent — Cincy MLS
- 2019-04-08 Listed $38,900 Cincy MLS
- 2007-12-31 Sold (Public Records) $39,900 Public Records
- 2007-12-19 Sold (MLS) $39,900 Cincy MLS
- 2007-10-10 Listed $39,900 Cincy MLS
- 2007-07-17 Listing Removed — Cincy MLS
- 2007-05-16 Listed $44,900 Cincy MLS
- 2007-05-01 Listing Removed — Cincy MLS
- 2007-01-31 Listed $44,900 Cincy MLS
- 2007-01-21 Listing Removed — Cincy MLS
- 2006-07-20 Listed $44,900 Cincy MLS
- 2006-07-19 Listing Removed — Cincy MLS
- 2005-08-29 Listing Removed — Cincy MLS
- 2005-08-26 Listed $49,900 Cincy MLS
- 2005-01-18 Listed $56,900 Cincy MLS
Property tax history
+5.2%/yrLatest (2025): $1,519 · +0.1% YoY. Source: county tax records.
Cash-flow waterfall
monthlySold comps — $/sqft
last 12 mo · ≤1 miLoading sold comps…