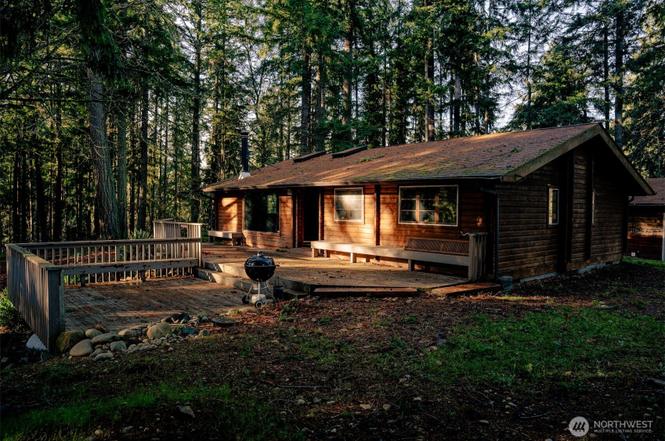
22044 Clear Lake Blvd SE · McKenna, WA
Flood risk 1/10 · Minimal
- FEMA flood zone
- X (unshaded)
- Chance of flooding over 30 yrs
- 0.0%
- Est. flood insurance / yr
- $507 – $1,088
Fire risk 3/10 · Minor
- Est. fire insurance / yr
- $604 – $1,122
Heat risk 2/10 · Minimal
- Hot days now (above 89°F)
- 6 days/yr
- Hot days in 30 yrs
- 12 days/yr
Wind risk 1/10 · Minimal
- Chance of severe wind over 30 yrs
- —
Air-quality risk 6/10 · Moderate
- Unhealthy air days now
- 7 days/yr
- Unhealthy air days in 30 yrs
- 9 days/yr
Risk factors via First Street. Map © Google.
Why this score? — see what drove the F grade
The composite is a weighted blend of 9 inputs, each scored 0–100. Each bar is that input's sub-score; the figure is the points it added to the 100-point composite (weight × sub-score).
- ARV discount +7.5/15.0
- Schools +4.8/10.0
- Cash flow +4.0/30.0
- Rent growth +3.9/5.0
- Livability +3.4/5.0
- Condition / age +2.5/5.0
- 1% rule +0.4/10.0
- DSCR +0.0/10.0
- Appreciation +0.0/10.0
$299,950
🖨 Deal sheet 📄 Offer letter ✓ Due diligence
Listing remarks
Discover this charming log-cabin-style home in the desirable Clearwood community, offered with an additional adjacent undeveloped . 37 acre parcel #41170012000 for extra space/privacy, or possibly build another house or garage. Enjoy the expansive front deck—perfect for entertaining. Inside the home features vaulted ceilings, granite-tile countertops, and a peninsula eating bar. Bathroom includes a tiled shower surround. Outbuilding in the back could possibly be used as extra storage or shop. Clearwood amenities include a swimming pool, sports courts and fields, playgrounds, scenic trails, multiple beaches, & beautiful lakes—ideal for year-round recreation & makes thi
Key facts
- Log cabin style home
- Expansive front deck
- Swimming pool
Tags
Neighborhood map
What this means for you Summary
Snapshot
- This is a 1-bed/1.0-bath other listed at $300k.
Deal economics
- At list price, monthly cash flow is $-843 ($-10k/yr) — negative.
- To cash-flow at today's rent, offer at most $151k (49.6% below list).
- To meet the 1% rule (rent ≥ 1% of price), the offer needs to be $163k (45.8% below list).
- Recommended offer: $151k (49.6% below list) — sets the bar for cash-flow.
- Cap rate 2.9% vs local median 3.8% in McKenna — below-typical yield; the buyer is paying a premium for something (appreciation thesis, condition, location) that the cap rate doesn't capture.
Location & tenants
- Location reads 67/100 on livability (#300 in WA) — a middle-class / working-renter tenant base. Strengths: employment A+, housing A+, crime A-; Watch: health & safety C-, amenities F, commute F.
- Yelm School District (rural): math 48% / reading 59% proficiency, ranked #108 of 291 in WA (top 37%) — acceptable for families but not a draw, mixed tenant base, ~2y average lease.
- Market conditions: Rents rising fast (+5.8%/yr); 431 active listings in the ZIP; solid renter incomes; 1,222 units permitted in Thurston County in 2024 (508 in 5+ unit buildings).
Forward outlook
- Local home prices are declining (-3.0%/yr); year-one equity from $2k of loan paydown is wiped out by about $9k of value loss. Plan a longer hold.
- Thurston County population projected at +27% by 2050 — long-run rental-demand tailwind backs the buy-and-hold thesis.
Negotiation context
- It's been on market 48 days — a 3% lower offer ($291k) is reasonable based on typical stale-listing flexibility.
- 3 sale attempts since 23y ago; this cycle's ask has dropped $25k (8%) from the opening price — seller is motivated, your offer sets the floor, not the list.
Questions for the listing agent
- What do current leases actually rent for vs. the listed asking? Can we see a recent rent roll and the last 12 months of T-12 income?
- It's been on market 48 days. Have you received any prior offers? Is the seller open to a 50% concession, seller financing, or rate buy-down credit?
- Built in 1969 — when were the roof, HVAC, electrical panel, plumbing, and water heater last replaced?
- What does the HOA fee cover, when was the last increase, and are there any pending special assessments or reserve-fund shortfalls?
- Is there a deadline driving the sale (1031 exchange, divorce, estate, relocation)? That informs how much negotiation room exists.
- Schools are B-rated — typically a magnet for longer-tenancy family renters. What's the average tenant stay here, and is there a school-zone premium baked into asking?
- The area grade is low — what's the realistic commute time and amenity access for the typical tenant pool here? Any planned neighborhood developments (good or bad) we should know about?
- What's the average days-on-market for RENTAL listings here right now (not sales)? A rising rental-DOM trend means longer vacancies and softer asking-rent achievability than the comps imply.
- What's the recent tenant-quality profile in this submarket — average credit score on applications, eviction rate, late-payment / NSF rate, and stable-employment percentage? A property-management company in the area should have these aggregated.
- How much new for-sale + rental construction is in the pipeline within 1–3 miles? Heavy new supply typically softens prices + rents 12–24 months out; constrained supply supports both.
Investment metrics
- 1% rule
- 0.54% ✗
- Cap rate
- 2.92%
- Cash-on-cash
- -12.04%
- DSCR
- 0.46
- GRM
- 15.4
CMA / ARV
No comps found within radius.
Projected returns pro-forma
-3.0% appreciation · 5.78% rent growth · sell at horizon
- IRR
- -35.4%
- Equity multiple
- -0.16×
- Total profit
- $-97,548
- Equity at exit
- $44,724
- IRR
- -32.6%
- Equity multiple
- -0.59×
- Total profit
- $-133,525
- Equity at exit
- $25,934
Cash invested: $83,986 (down + closing). Projections, not guarantees.
Landlord ↔ Tenant lean methodology
- Overall (STATE)
- 28 Tenant-Leaning
- State Washington
- 28 Tenant-Leaning · D+8
- County
- — inherits STATE
- City
- — inherits STATE
ZIP-level market 98597
- Rents YoY
- 5.8%
- Active inventory
- 431
- Price-to-rent
- 15.4×
Monthly cashflow live
- Estimated rent
- $1,625 medium interval (Pro) →
- Mortgage (P&I)
- −$1,573
- Tax from tax record
- −$254 /mo · $3,044/yr
- Insurance
- −$125
- HOA
- −$175
- Vacancy / Maint / Mgmt
- −$341
- Net cashflow
- $-843
Break-even live
UW: 25.0% down · 7.5% · 30yr · 1.5% tax · 5.0% vac · 8.0% maint · 8.0% mgmt
Financing live
Cash to close
- Down payment
- $74,988
- Closing costs
- $8,998
- Reserves months
- —
- Total cash needed
- —
Loan-product check · same deal, 3 products live
Conventional
25% down · 7.5% · 30yr
- Down + closing
- —
- Monthly P&I
- —
- Monthly cashflow
- —
- DSCR
- —
- Eligible?
- —
Personal DTI + credit; lowest rate.
DSCR
20% down · 8.5% · 30yr
- Down + closing
- —
- Monthly P&I
- —
- Monthly cashflow
- —
- DSCR
- —
- Eligible?
- —
No personal income docs; deal must DSCR.
Hard money
10% down · 12.0% · 12mo
- Down + closing
- —
- Monthly P&I
- —
- Monthly cashflow
- —
- DSCR
- —
- Eligible?
- —
Short-term bridge; refi at stabilization.
HOA detail
- Monthly dues
- $175 · $2,100/yr
- Likely covers
- landscapingpool
Listing history 12 events
-
2026-01-21status Pending
-
2026-01-19price $299,950
-
2025-12-30price $315,000
-
2025-12-04$325,000 Active
-
2019-10-28soldstatus $267,000 Sold
-
2019-10-28soldstatus $267,000
-
2019-09-03status Pending
-
2019-08-19status Pending Inspection
-
2019-08-15$269,000 Active
-
2003-03-24soldstatus $160,000
-
2003-01-24$159,900
-
1989-12-11soldstatus $65,500
ⓘ Source: listings_history table (triggers on properties + properties_extension) + one-shot
backfill from property_details.listing_events for pre-trigger history.
Tax reassessment forecast WA · Resets to sale price
- Current annual tax
- $3,044 · $254/mo
- Projected year-2 tax
- $3,044 · $254/mo
- Expected delta
- $0/yr ($0/mo · 0.0%)
ⓘ Screening estimate from a state-policy table — verify with the county assessor before closing.
Climate risk First Street
- Flood 1/10 Low FEMA zone X (unshaded) · 0% chance over 30 yrs
- Wildfire 3/10 Moderate
- Heat 2/10 Low 6 d/yr ≥89°F today · 12 d/yr by 30 yrs out
- Wind 1/10 Low
- Air quality 6/10 Major 7 unhealthy d/yr today · 9 by 30 yrs out
Nearby sold comps map
Loading sold comps map…
Walkable amenities ~0.75 mi
Loading nearby amenities…
Taxation est. · year 1
- Rental income
- $19,502
- − Mortgage interest
- −$16,802
- − Property taxes
- −$3,044
- − Insurance
- −$1,500
- − Repairs & maintenance
- −$1,560
- − Management
- −$1,560
- − HOA
- −$2,100
- − Depreciation
- −$8,726
- Taxable loss
- −$15,790
- Est. tax savings @ 24.0%
- +$3,789
- After-tax cash flow
- $-6,323/yr
For passive investors: Depreciation is non-cash, so a rental often shows a tax loss while cash-flowing — sheltering income. Rental losses are passive: they offset passive income freely, and up to $25,000/yr can offset ordinary (W-2) income if you actively participate and your MAGI is under $100k (phasing out to $0 by $150k); unused losses carry forward. On sale, claimed depreciation is recaptured at up to 25%, and gains may owe capital-gains tax (a 1031 exchange can defer both). Figures are a year-1 estimate at your 24.0% rate — not tax advice; consult a CPA.
Schools (NCES district)
- District
- Yelm School District
- NCES district ID
- 5310140
- Math proficiency
- 48% ▲ 1.00%
- Reading proficiency
- 59% ▲ 1.00%
- Median HH income
- $58,328
- Composite
- 48.34/100
- National rank
- #4685
- State rank
- #108 of 291 in WA
Livability — McKenna
- Score
- 67/100
- State rank
- #300
- US rank
- #10587
Category grades
Schools grade is shown separately in the Schools card above.
Census & demographics
- County
- Thurston County · 269,345 people
- City population
- 61
- Metro
- Olympia-Lacey-Tumwater, WA
- Population (ZIP)
- 26,669
- Household income
- $92,219
- Rent vs Own
- Severe rent burden
- 259.0
Population outlook (Thurston County) Hauer SSP2
- Today (2025)
- 308,239 people
- By 2030
- 326,483 · +5.9%
- By 2040
- 359,890 · +16.8%
- By 2050
- 391,800 · +27.1%
- By 2075
- 468,024 · +51.8%
- By 2100
- 519,890 · +68.7%
Race, ethnicity, and origin ACS 2023
- Neighborhood character
- Predominantly White (76%)
- Race & ethnicity
- White 76% Two or more races 10% Hispanic / Latino 10% Black 3% Pacific Islander 2% Asian 2%
- Hispanic origin (detail)
- Mexican 7% Puerto Rican 1%
- Common ancestry
- Portuguese 5% Romanian 4% Lithuanian 3%
- Foreign-born
- 7% · Canada, South Korea
- Languages at home
- 90% English-only · Spanish 6% German/W. Germanic 1% Other Asian/Pacific 1%
Political lean MEDSL · Thurston
- 2024 margin
- Strong D (+20.4) · D 58.5% · R 38.1% · Other 3.5%
- 2008→2024 swing
- -1.3pp toward R · 2008: 21.7pp · 2024: 20.4pp
- All cycles
- 2024: D+20.4 2020: D+18.6 2016: D+15.4 2012: D+19.0 2008: D+21.7
Not yet ingested
- Civics
- —
Market trends
- HPI YoY
- ▼ -192.07%
- Current HPI
- 326.4361
- Rent YoY
- ▲ 5.78%
- Metro
- Olympia-Lacey-Tumwater, WA
- State GDP YoY
- ▲ 4.65%
- F500 in state
- 22
Industry mix (Fortune 500 HQ in WA)
| Industry | F500 HQs | Revenue |
|---|---|---|
| Retail | 2 | $269B |
|
||
| Technology / Retail | 1 | $638B |
|
||
| Technology | 1 | $245B |
|
||
| Telecommunications | 1 | $38B |
|
||
| Food / Beverage | 1 | $36B |
|
||
| Automotive / Trucks | 1 | $34B |
|
||
Price history
+357.9% since first listed12 events — show timeline
- 2026-01-21 Pending — NWMLS as Distributed by MLS Grid
- 2026-01-19 Price Changed $299,950 NWMLS as Distributed by MLS Grid
- 2025-12-30 Price Changed $315,000 NWMLS as Distributed by MLS Grid
- 2025-12-04 Listed $325,000 NWMLS as Distributed by MLS Grid
- 2019-10-28 Sold (Public Records) $267,000 Public Records
- 2019-10-28 Sold (MLS) $267,000 NWMLS as Distributed by MLS Grid
- 2019-09-03 Pending — NWMLS as Distributed by MLS Grid
- 2019-08-19 Pending — NWMLS as Distributed by MLS Grid
- 2019-08-15 Listed $269,000 NWMLS as Distributed by MLS Grid
- 2003-03-24 Sold (MLS) $160,000 NWMLS as Distributed by MLS Grid
- 2003-01-24 Listed $159,900 NWMLS as Distributed by MLS Grid
- 1989-12-11 Sold (Public Records) $65,500 Public Records
Property tax history
+2.3%/yrLatest (2026): $3,044 · +1.1% YoY. Source: county tax records.
Cash-flow waterfall
monthlySold comps — $/sqft
last 12 mo · ≤1 miLoading sold comps…