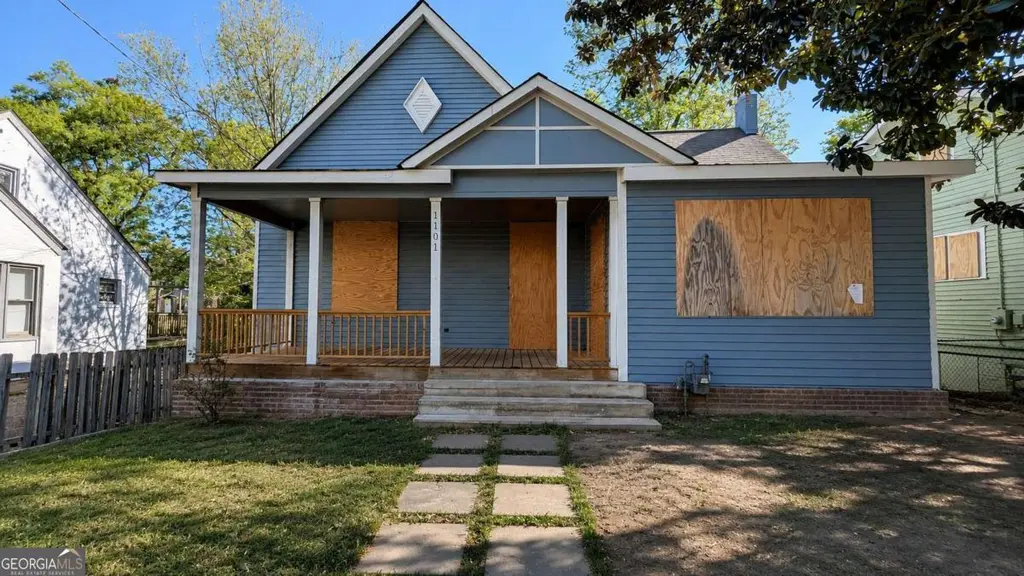
1101 Arlington Ave SW · Atlanta, GA
Flood risk 1/10 · Minimal
- FEMA flood zone
- X (unshaded)
- Chance of flooding over 30 yrs
- 0.0%
- Est. flood insurance / yr
- $473 – $860
Fire risk 1/10 · Minimal
- Est. fire insurance / yr
- $963 – $1,789
Heat risk 5/10 · Moderate
- Hot days now (above 104°F)
- 7 days/yr
- Hot days in 30 yrs
- 18 days/yr
Wind risk 5/10 · Moderate
- Chance of severe wind over 30 yrs
- 26.0%
Air-quality risk 4/10 · Minor
- Unhealthy air days now
- 4 days/yr
- Unhealthy air days in 30 yrs
- 6 days/yr
Risk factors via First Street. Map © Google.
Why this score? — see what drove the B grade
The composite is a weighted blend of 9 inputs, each scored 0–100. Each bar is that input's sub-score; the figure is the points it added to the 100-point composite (weight × sub-score).
- Cash flow +30.0/30.0
- 1% rule +10.0/10.0
- DSCR +10.0/10.0
- ARV discount +7.5/15.0
- Livability +4.2/5.0
- Rent growth +3.2/5.0
- Schools +2.7/10.0
- Condition / age +2.5/5.0
- Appreciation +0.0/10.0
$174,900
🖨 Deal sheet 📄 Offer letter ✓ Due diligence
Listing remarks MLS
Investor Special in the heart of Oakland City! This classic bungalow presents an outstanding opportunity for investors, renovators, or buyers looking to complete a partially renovated home with significant upside potential. Located just a short walk from the vibrant Lee + White development, you'll enjoy easy access to breweries, restaurants, shops, entertainment, and the Atlanta Beltline lifestyle. Renovations have already been started, allowing the next owner to add their finishing touches and maximize value. The home features a formal living room, separate dining area, kitchen with cabinetry already in place awaiting countertops and appliance installation, a spacious primary suite with a large walk-in shower and frameless glass enclosure, and a guest bathroom with tile finishes. Full of character and charm, the property showcases vintage architectural details, original millwork, and a welcoming front porch that embodies the appeal of a classic Atlanta bungalow. With strong renovation activity and impressive after-repair values throughout the area, this is an excellent opportunity to bring your contractor, designer, and vision to transform this property into something truly special.
Key facts
- Large walk-in shower
- 8,908 sq ft lot
- 2 parking spots
Tags
Property features AI
Finance
- HOA & community: Near Beltline; Near schools; Near shopping; Close to a park
Exterior
- Parking: Driveway parking; Two total parking spaces; Open parking available
- Utilities: Public water; Public sewer; 220-volt electric service; Cable available; Electricity available; Natural gas available; Sewer available; Water available
- Home design: One-level home; Resale property
- Construction: Wood siding exterior; Composition roof; Block foundation; Built with traditional construction materials
- Exterior features: Private yard; Front porch
Interior
- Kitchen: Eat-in kitchen; Stained cabinets
- Bedrooms: 3 main-level bedrooms; Master suite on the main level; Oversized master bedroom
- Flooring: Hardwood floors; Ceramic tile
- Bathrooms: 2 full bathrooms (both on the main level); Master bathroom with additional/other features
- Interior features: Entrance foyer; 9-foot ceilings on the main level; No shared/common walls; Crawl space basement
- Laundry & utility: Other included appliances
Neighborhood map
What this means for you Summary
Snapshot
- This is a 3-bed/2.0-bath single-family listed at $175k.
Deal economics
- At list price, monthly cash flow is $691 ($8k/yr) — positive.
- The deal already cash-flows at list — no discount required.
- Meets the 1% rule at list price ($3k rent vs $175k).
- Cap rate 11.0% vs local median 3.1% in Atlanta — top-decile yield for the area; either an underpriced asset or a hidden risk that comps aren't pricing in. Stress-test before assuming the spread holds.
Location & tenants
- Location reads 83/100 on livability (#6 in GA, #919 nationally) — a professional / high-income tenant draw. Strengths: amenities A+, commute A+, housing A+; Watch: cost of living C-.
- Atlanta Public Schools (urban): math 28% / reading 35% proficiency, ranked #80 of 174 in GA (top 46%) — families likely to look elsewhere, expect single-tenant / working-renter base with shorter leases; 71% free/reduced lunch — lower-income household profile, screen leases tightly.
- Zoned schools: Finch Elementary (math 2% / reading 2%, grade F, #1,204 of 1,228 statewide, top 100%, 339 students, 100% FRL); Sylvan Hills Middle School (math 5% / reading 12%, grade F, #439 of 470 statewide, top 94%, 445 students, 100% FRL) — zoned schools average 100% FRL vs 71% district-wide (29 pts higher); higher-poverty schools than district average — tighter screening recommended.
- Zoned-school proficiency averages 6% at this address vs 32% district-wide (-26 pts) — the specific schools serving this property underperform the Atlanta Public Schools average; the district grade overstates school quality for this exact location.
- Market conditions: Rents rising (+2.8%/yr); 452 active listings in the ZIP; 14 comparable units currently listed for rent nearby; rentals at typical pace (median 25d on market — plan ~3-4 weeks tenant-placement turnaround); 11,565 units permitted in Fulton County in 2024 (8,159 in 5+ unit buildings).
- At $2,810/mo this rent would consume 64% of the median local household income ($53k/yr) (locally 1676% of renters already pay >50% of income on rent) — very limited rent-growth headroom before tenants either downsize or default.
Forward outlook
- Local home prices are declining (-3.0%/yr); year-one equity from $1k of loan paydown is wiped out by about $5k of value loss. Plan a longer hold.
- Fulton County population projected at +38% by 2050 — long-run rental-demand tailwind backs the buy-and-hold thesis.
- At projected returns (-3.0% appreciation + 2.8% rent growth), your $49k cash investment doubles in ~8 years — after that, you're playing with house money.
Negotiation context
- Only 2 days on market — expect competitive offers; lowballing is unlikely to land.
- 5 sale attempts since 3y ago with the ask held roughly flat each time — persistent listings suggest the price (not the market) is what's stuck; bring a comps-based counter.
Risks & watch-outs
- Watch-outs: property tax is 3.7% of price; built in 1920 — expect roof / HVAC / electrical / plumbing capex.
- Climate carrying-cost: moderate wind risk, 26% chance of damaging wind over 30y; extreme-heat days projected 7→18/yr by 2055 (HVAC capex compounding) — expect insurance premiums to compound above CPI over the hold.
Questions for the listing agent
- Built in 1920 — when were the roof, HVAC, electrical panel, plumbing, and water heater last replaced?
- Property tax is high relative to price — has the assessment been appealed recently, and will the sale trigger a re-assessment?
- Is there a deadline driving the sale (1031 exchange, divorce, estate, relocation)? That informs how much negotiation room exists.
- What's the average days-on-market for RENTAL listings here right now (not sales)? A rising rental-DOM trend means longer vacancies and softer asking-rent achievability than the comps imply.
- What's the recent tenant-quality profile in this submarket — average credit score on applications, eviction rate, late-payment / NSF rate, and stable-employment percentage? A property-management company in the area should have these aggregated.
- How much new for-sale + rental construction is in the pipeline within 1–3 miles? Heavy new supply typically softens prices + rents 12–24 months out; constrained supply supports both.
Investment metrics
- 1% rule
- 1.61% ✓
- Cap rate
- 11.03%
- Cash-on-cash
- 16.94%
- DSCR
- 1.75
- GRM
- 5.2
CMA / ARV
- ARV (on-the-fly)
- $604,534
- Comps found
- 10
Show comp detail 10 sales within ~0.75 mi
| Address | Dist | Beds/Ba | Sqft | Sold | Price | $/sf | Match |
|---|---|---|---|---|---|---|---|
| 1062 Peeples St SW | 0.15mi | 3/2.0 | 2,931 (-2%) | 4mo | $617,000 | $211 | 87 |
| 1089 Avon Ave SW | 0.10mi | 4/3.5 (+1) | 2,859 (-4%) | 6mo | $499,000 | $175 | 73 |
| 1200 Merrill Ave SW | 0.38mi | 4/3.5 (+1) | 2,985 (+0%) | 22mo | $485,000 | $162 | 53 |
| 1318 Bluefield Dr SW | 0.42mi | 4/3.5 (+1) | 2,701 (-9%) | 3mo | $620,000 | $230 | 52 |
| 1357 Lynford Dr SW | 0.49mi | 4/3.0 (+1) | 3,061 (+3%) | 15mo | $535,000 | $175 | 51 |
| 862 Hartford Pl SW | 0.49mi | 4/2.0 (+1) | 2,608 (-12%) | 8mo | $535,000 | $205 | 45 |
| 851 Dill Ave SW | 0.59mi | 4/3.5 (+1) | 2,648 (-11%) | 3mo | $490,000 | $185 | 41 |
| 1386 Kenilworth Dr SW | 0.74mi | 4/3.5 (+1) | 2,949 (-1%) | 23mo | $600,000 | $203 | 34 |
| 1279 Allene Ave SW | 0.68mi | 4/3.0 (+1) | 2,600 (-13%) | 13mo | $380,000 | $146 | 27 |
| 1386 Lorenzo Dr SW | 0.68mi | 4/3.5 (+1) | 2,650 (-11%) | 17mo | $580,000 | $219 | 25 |
Match score weights: distance 35% · size 25% · config 20% · recency 20%. Top-matched comps best support the ARV.
Projected returns pro-forma
-3.0% appreciation · 2.77% rent growth · sell at horizon
- IRR
- 8.0%
- Equity multiple
- 1.31×
- Total profit
- $15,267
- Equity at exit
- $26,078
- IRR
- 17.1%
- Equity multiple
- 2.39×
- Total profit
- $68,297
- Equity at exit
- $15,122
Cash invested: $48,972 (down + closing). Projections, not guarantees.
Landlord ↔ Tenant lean methodology
- Overall (STATE)
- 90 Strongly Landlord-Friendly
- State Georgia
- 90 Strongly Landlord-Friendly · R+3
- County
- — inherits STATE
- City
- — inherits STATE
ZIP-level market 30310
- Home prices YoY
- -32.8%
- Rents YoY
- 2.8%
- Active inventory
- 452
- Price-to-rent
- 5.2×
Monthly cashflow live
- Estimated rent
- $2,810 high interval (Pro) →
- Mortgage (P&I)
- −$917
- Tax from tax record
- −$539 /mo · $6,467/yr
- Insurance
- −$73
- HOA
- −$0
- Vacancy / Maint / Mgmt
- −$590
- Net cashflow
- $691
Break-even live
Sensitivity live
| Price | -10% $790 | -5% $741 | +0% $691 | +5% $642 | +10% $592 |
|---|---|---|---|---|---|
| Rent | -10% $469 | -5% $580 | +0% $691 | +5% $802 | +10% $913 |
| Rate | -1.0pp $779 | -0.5pp $736 | base $691 | +0.5pp $646 | +1.0pp $600 |
UW: 25.0% down · 7.5% · 30yr · 1.5% tax · 5.0% vac · 8.0% maint · 8.0% mgmt
Financing live
Cash to close
- Down payment
- $43,725
- Closing costs
- $5,247
- Reserves months
- —
- Total cash needed
- —
Loan-product check · same deal, 3 products live
Conventional
25% down · 7.5% · 30yr
- Down + closing
- —
- Monthly P&I
- —
- Monthly cashflow
- —
- DSCR
- —
- Eligible?
- —
Personal DTI + credit; lowest rate.
DSCR
20% down · 8.5% · 30yr
- Down + closing
- —
- Monthly P&I
- —
- Monthly cashflow
- —
- DSCR
- —
- Eligible?
- —
No personal income docs; deal must DSCR.
Hard money
10% down · 12.0% · 12mo
- Down + closing
- —
- Monthly P&I
- —
- Monthly cashflow
- —
- DSCR
- —
- Eligible?
- —
Short-term bridge; refi at stabilization.
Rent comps 14 comps
| Address | Beds | Baths | Sqft | Rent | $/sqft | DOM | Units | Dist |
|---|---|---|---|---|---|---|---|---|
| 1017 Sparks St SW Atlanta, GA | 4.0 | 2.5 | 1950 | $2,475 | $1.27 | 24d | 1 | 0.27mi |
| 1010 Dill Ave SW Atlanta, GA | 4.0 | 3.0 | 2236 | $2,850 | $1.27 | 24d | 1 | 0.44mi |
| 1401 Plaza Ave SW Atlanta, GA | 4.0 | 2.5 | 2600 | $2,495 | $0.96 | 24d | 1 | 0.63mi |
| 746 Joseph E Lowery Blvd SW Atlanta, GA | 3.0 | 2.5 | 1940 | $2,550 | $1.31 | 24d | 1 | 0.83mi |
| 1452 Lockwood Dr SW Atlanta, GA | 4.0 | 3.5 | 2910 | $4,950 | $1.70 | 24d | 1 | 1.02mi |
| 875 Beryl St SW Atlanta, GA | 3.0 | 2.5 | 2060 | $2,850 | $1.38 | 14d | 1 | 1.08mi |
| 702 Cascade Ave SW Atlanta, GA | 3.0 | 4.0 | 2220 | $2,850 | $1.28 | 24d | 1 | 1.09mi |
| 1089 Coleman St SW Atlanta, GA | 4.0 | 3.0 | 2500 | $4,500 | $1.80 | 24d | 1 | 1.14mi |
| 798 Bender St SW Unit 1075536P Atlanta, GA | 4.0 | 3.5 | 2292 | $6,989 | $3.05 | 5d | 1 | 1.18mi |
| 1501 Rogers Ave SW Atlanta, GA | 3.0 | 1.0 | 1980 | $2,500 | $1.26 | 24d | 1 | 1.19mi |
| 1530 Rogers Ave SW Atlanta, GA | 4.0 | 3.0 | 2184 | $3,300 | $1.51 | 3d | 1 | 1.20mi |
| 1515 Westwood Ave SW Atlanta, GA | 3.0 | 2.5 | 2278 | $6,000 | $2.63 | 22d | 1 | 1.25mi |
| 1749 S Alvarado Ter SW Atlanta, GA | 4.0 | 2.0 | 2400 | $2,541 | $1.06 | 8d | 1 | 1.30mi |
| 415 Hopkins St SW Atlanta, GA | 3.0 | 1.0 | 2550 | $2,000 | $0.78 | 5d | 1 | 1.42mi |
Listing history 2 events
-
2026-06-18days on market $174,900 Active 2 DOM
-
2026-06-17$174,900 Active 1 DOM
ⓘ Source: listings_history table (triggers on properties + properties_extension) + one-shot
backfill from property_details.listing_events for pre-trigger history.
Tax reassessment forecast GA · Resets to sale price
- Current annual tax
- $6,467 · $539/mo
- Projected year-2 tax
- $6,467 · $539/mo
- Expected delta
- $0/yr ($0/mo · 0.0%)
ⓘ Screening estimate from a state-policy table — verify with the county assessor before closing.
Climate risk First Street
- Flood 1/10 Low FEMA zone X (unshaded) · 0% chance over 30 yrs
- Wildfire 1/10 Low
- Heat 5/10 Major 7 d/yr ≥104°F today · 18 d/yr by 30 yrs out
- Wind 5/10 Major 26% chance of damaging wind over 30 yrs
- Air quality 4/10 Moderate 4 unhealthy d/yr today · 6 by 30 yrs out
Nearby sold comps map
Loading sold comps map…
Walkable amenities ~0.75 mi
Loading nearby amenities…
Taxation est. · year 1
- Rental income
- $33,723
- − Mortgage interest
- −$9,797
- − Property taxes
- −$6,467
- − Insurance
- −$874
- − Repairs & maintenance
- −$2,698
- − Management
- −$2,698
- − Depreciation
- −$5,088
- Taxable income
- $6,101
- Est. tax owed @ 24.0%
- −$1,464
- After-tax cash flow
- $6,829/yr
For passive investors: Depreciation is non-cash, so a rental often shows a tax loss while cash-flowing — sheltering income. Rental losses are passive: they offset passive income freely, and up to $25,000/yr can offset ordinary (W-2) income if you actively participate and your MAGI is under $100k (phasing out to $0 by $150k); unused losses carry forward. On sale, claimed depreciation is recaptured at up to 25%, and gains may owe capital-gains tax (a 1031 exchange can defer both). Figures are a year-1 estimate at your 24.0% rate — not tax advice; consult a CPA.
Schools (NCES district)
- District
- Atlanta Public Schools
- NCES district ID
- 1300120
- Math proficiency
- 28% ▼ -6.00%
- Reading proficiency
- 35% ▼ -2.00%
- Median HH income
- $48,306
- Composite
- 27.27/100
- National rank
- #7006
- State rank
- #80 of 174 in GA
Livability — Atlanta
- Score
- 83/100
- State rank
- #6
- US rank
- #919
Category grades
Schools grade is shown separately in the Schools card above.
Census & demographics
- Census place
- Atlanta, GA
- County
- Fulton County · 1,094,430 people
- City population
- 629,525
- Metro
- Atlanta-Sandy Springs-Alpharetta, GA
- Population (ZIP)
- 27,186
- Household income
- $53,037
- Rent vs Own
- Severe rent burden
- 1676.0
Population outlook (Fulton County) Hauer SSP2
- Today (2025)
- 1,203,707 people
- By 2030
- 1,299,706 · +8.0%
- By 2040
- 1,488,256 · +23.6%
- By 2050
- 1,664,580 · +38.3%
- By 2075
- 2,036,072 · +69.2%
- By 2100
- 2,222,402 · +84.6%
Race, ethnicity, and origin ACS 2023
- Neighborhood character
- Predominantly Black (76%)
- Race & ethnicity
- Black 76% White 14% Two or more races 4% Hispanic / Latino 4% Asian 2%
- Common ancestry
- Lithuanian 1% Slovak 1% Serbian 0%
- Foreign-born
- 5% · Canada, South Korea, Vietnam
- Languages at home
- 92% English-only · Spanish 4% French/Haitian/Cajun 1% Other Indo-European 1%
Political lean MEDSL · Fulton
- 2024 margin
- Solid D (+44.9) · D 71.9% · R 27.0% · Other 1.1%
- 2008→2024 swing
- +9.8pp toward D · 2008: 35.0pp · 2024: 44.9pp
- All cycles
- 2024: D+44.9 2020: D+46.4 2016: D+42.1 2012: D+29.6 2008: D+35.0
Not yet ingested
- Civics
- —
Market trends
- HPI YoY
- ▼ -204.00%
- Current HPI
- 418.7297
- Rent YoY
- ▲ 2.77%
- Metro
- Atlanta-Sandy Springs-Alpharetta, GA
- State GDP YoY
- ▲ 2.66%
- F500 in state
- 28
Industry mix (Fortune 500 HQ in GA)
| Industry | F500 HQs | Revenue |
|---|---|---|
| Paper / Packaging | 2 | $29B |
|
||
| Retail | 1 | $160B |
|
||
| Transportation / Logistics | 1 | $91B |
|
||
| Airlines | 1 | $62B |
|
||
| Consumer Goods | 1 | $47B |
|
||
| Utilities | 1 | $25B |
|
||
Price history
-38.6% since first listed15 events — show timeline
- 2026-06-16 Listed $174,900 GAMLS
- 2026-06-16 Listed $174,900 FMLS
- 2024-09-30 Sold (Public Records) $340,000 Public Records
- 2024-09-26 Sold (MLS) $340,000 GAMLS
- 2024-09-25 Sold (MLS) $340,000 FMLS
- 2024-08-28 Pending — GAMLS
- 2024-08-28 Pending — FMLS
- 2024-08-22 Listed $380,000 FMLS
- 2024-08-22 Listed $380,000 GAMLS
- 2024-02-20 Listing Removed — GAMLS
- 2024-01-29 Price Changed $510,000 GAMLS
- 2024-01-10 Price Changed $515,000 GAMLS
- 2023-12-05 Price Changed $525,000 GAMLS
- 2023-11-01 Listed $535,000 GAMLS
- 2022-07-07 Sold (Public Records) $285,000 Public Records
Property tax history
+16.5%/yrLatest (2025): $6,467 · +71.8% YoY. Source: county tax records.
Cash-flow waterfall
monthlySold comps — $/sqft
last 12 mo · ≤1 miLoading sold comps…