6122 7th Ave W · Bradenton, FL
Flood risk No data
- FEMA flood zone
- —
- Chance of flooding over 30 yrs
- —
- Est. flood insurance / yr
- —
Fire risk No data
- Est. fire insurance / yr
- —
Heat risk No data
- Hot days now (above threshold)
- —
- Hot days in 30 yrs
- —
Wind risk No data
- Chance of severe wind over 30 yrs
- —
Air-quality risk No data
- Unhealthy air days now
- —
- Unhealthy air days in 30 yrs
- —
Risk factors via First Street. Map © Google.
Why this score? — see what drove the C grade
The composite is a weighted blend of 9 inputs, each scored 0–100. Each bar is that input's sub-score; the figure is the points it added to the 100-point composite (weight × sub-score).
- Cash flow +19.4/30.0
- 1% rule +10.0/10.0
- ARV discount +7.5/15.0
- DSCR +6.1/10.0
- Schools +4.4/10.0
- Livability +4.0/5.0
- Condition / age +2.5/5.0
- Rent growth +2.4/5.0
- Appreciation +0.0/10.0
$89,900
🖨 Deal sheet 📄 Offer letter ✓ Due diligence
Listing remarks
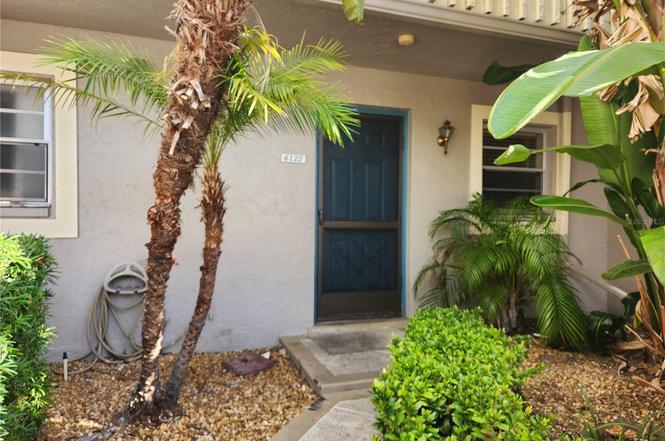
First-floor 1BR/1.5BA condo in the desirable Pebble Springs community in West Bradenton. Ideally located just off Manatee Avenue West and 59th Street, you’re minutes from shopping, restaurants, medical facilities, and the beautiful Gulf beaches of Anna Maria Island. This spacious unit offers a smart layout with the added convenience of a rare half-bath for guests and in-unit private laundry. The screened lanai overlooks a peaceful courtyard and the community pool—perfect for enjoying Florida’s indoor-outdoor lifestyle. The building has new roofs and fresh exterior paint, and Pebble Springs is a low-rise community, meaning no high-rise structural inspection requirements. As
Key facts
- Rare half bath
- Community pool
- New roofs
Tags
Property features AI
Finance
- Other: Unit located on first floor (Floor 1); Unfurnished; Living area reported as 768 sq ft (building area 900 sq ft); Direction faces south; Listing contact available via listing office
- Financial info: Total annual fees: $8,952; Lease restrictions apply
- HOA & community: HOA with monthly condo fee of $746; Association requires approval; Association amenities include clubhouse, pool, cable TV, maintenance; Association fees cover cable TV, common area taxes, pool, reserves, insurance, structure & grounds maintenance, management, recreational facilities, sewer, trash and water; Community features: clubhouse, pool, community mailbox, street lights, deed restrictions, association recreation owned, buyer approval required; Pets allowed (max 20 lb)
Exterior
- Parking: Assigned parking; Covered parking; Ground level parking; Guest parking; 1-car carport
- Utilities: Public water; Public sewer; Cable available; Electricity available; Sewer connected; Water connected; Underground utilities
- Home design: Residential condominium; Attached unit; One story; Entry faces south; Fixer condition
- Construction: Block and stucco construction; Shingle roof; Slab foundation; Building/complex identified as III
- Exterior features: Covered rear porch; Screened porch; Exterior lighting; Sliding doors; Storage structure; Mature landscaping; Landscaped; Near public transit; Paved access/drive
Interior
- Kitchen: Range; Refrigerator
- Bedrooms: 1 bedroom
- Flooring: Laminate; Tile
- Bathrooms: 1 full bath; 1 half bath
- Heating & cooling: Central heating; Central air conditioning
- Interior features: Ceiling fans; Living room / dining room combo; Open floorplan; Walk-in closet(s); Inside utility
- Laundry & utility: Laundry inside in a closet
Neighborhood map
What this means for you Summary
Snapshot
- This is a 1-bed/1.5-bath condo listed at $90k.
Deal economics
- At list price, monthly cash flow is $101 ($1k/yr) — positive.
- The deal already cash-flows at list — no discount required.
- Meets the 1% rule at list price ($2k rent vs $90k).
- Recommended offer: $82k (9.0% below list) — sets the bar for market timing.
- Cap rate 7.6% vs local median 3.6% in Bradenton — top-decile yield for the area; either an underpriced asset or a hidden risk that comps aren't pricing in. Stress-test before assuming the spread holds.
Location & tenants
- Location reads 81/100 on livability (#101 in FL, #1,528 nationally) — a professional / high-income tenant draw. Strengths: commute A+, cost of living A+, housing A+; Watch: employment D+, crime D, amenities F.
- Manatee (suburban): math 54% / reading 50% proficiency, ranked #26 of 73 in FL (top 36%) — acceptable for families but not a draw, mixed tenant base, ~2y average lease.
- Market conditions: Rents soft (-0.3%/yr); 510 active listings in the ZIP; 11 comparable units currently listed for rent nearby; rentals at typical pace (median 16d on market — plan ~3-4 weeks tenant-placement turnaround); solid renter incomes; 7,472 units permitted in Manatee County in 2024 (1,782 in 5+ unit buildings).
Forward outlook
- Local home prices are declining (-3.0%/yr); year-one equity from $622 of loan paydown is wiped out by about $3k of value loss. Plan a longer hold.
- Manatee County population projected at +43% by 2050 — long-run rental-demand tailwind backs the buy-and-hold thesis.
Negotiation context
- It's been on market 100 days — a 9% lower offer ($82k) is reasonable based on typical stale-listing flexibility.
Risks & watch-outs
- Watch-outs: HOA is 39% of rent.
Questions for the listing agent
- It's been on market 100 days. Have you received any prior offers? Is the seller open to a 9% concession, seller financing, or rate buy-down credit?
- Built in 1979 — when were the roof, HVAC, electrical panel, plumbing, and water heater last replaced?
- What does the HOA fee cover, when was the last increase, and are there any pending special assessments or reserve-fund shortfalls?
- Any open or pending special assessments — roof, HVAC, plumbing, elevator, façade? What's the per-unit balance and payoff schedule, and is the seller paying it off at close or rolling it to the buyer?
- Why hasn't it sold? Are there any deal-killer items the seller is aware of (foundation, flood, title, zoning, code violations)?
- Is there a deadline driving the sale (1031 exchange, divorce, estate, relocation)? That informs how much negotiation room exists.
- Crime grade is D in this area — have there been break-ins, vandalism, or insurance claims at this property in the last 3 years? What carrier currently insures it and at what premium?
- What's the average days-on-market for RENTAL listings here right now (not sales)? A rising rental-DOM trend means longer vacancies and softer asking-rent achievability than the comps imply.
- What's the recent tenant-quality profile in this submarket — average credit score on applications, eviction rate, late-payment / NSF rate, and stable-employment percentage? A property-management company in the area should have these aggregated.
- How much new apartment / multifamily construction is in the pipeline within 1–3 miles? Heavy new supply (>2% of stock underway) typically softens rents 12–24 months out; light construction supports rent growth.
Investment metrics
- 1% rule
- 2.12% ✓
- Cap rate
- 7.64%
- Cash-on-cash
- 4.82%
- DSCR
- 1.21
- GRM
- 3.9
CMA / ARV
No comps found within radius.
Projected returns pro-forma
-3.0% appreciation · 0.0% rent growth · sell at horizon
- IRR
- -15.6%
- Equity multiple
- 0.48×
- Total profit
- $-13,201
- Equity at exit
- $13,404
- IRR
- -28.7%
- Equity multiple
- 0.10×
- Total profit
- $-22,696
- Equity at exit
- $7,773
Cash invested: $25,172 (down + closing). Projections, not guarantees.
Landlord ↔ Tenant lean methodology
- Overall (STATE)
- 87 Strongly Landlord-Friendly
- State Florida
- 87 Strongly Landlord-Friendly · R+3
- County
- — inherits STATE
- City
- — inherits STATE
ZIP-level market 34209
- Rents YoY
- -0.3%
- Active inventory
- 510
- Price-to-rent
- 3.9×
Monthly cashflow live
- Estimated rent
- $1,903 high interval (Pro) →
- Mortgage (P&I)
- −$471
- Tax from tax record
- −$147 /mo · $1,770/yr
- Insurance
- −$37
- HOA
- −$746
- Vacancy / Maint / Mgmt
- −$400
- Net cashflow
- $101
Break-even live
UW: 25.0% down · 7.5% · 30yr · 1.5% tax · 5.0% vac · 8.0% maint · 8.0% mgmt
Financing live
Cash to close
- Down payment
- $22,475
- Closing costs
- $2,697
- Reserves months
- —
- Total cash needed
- —
Loan-product check · same deal, 3 products live
Conventional
25% down · 7.5% · 30yr
- Down + closing
- —
- Monthly P&I
- —
- Monthly cashflow
- —
- DSCR
- —
- Eligible?
- —
Personal DTI + credit; lowest rate.
DSCR
20% down · 8.5% · 30yr
- Down + closing
- —
- Monthly P&I
- —
- Monthly cashflow
- —
- DSCR
- —
- Eligible?
- —
No personal income docs; deal must DSCR.
Hard money
10% down · 12.0% · 12mo
- Down + closing
- —
- Monthly P&I
- —
- Monthly cashflow
- —
- DSCR
- —
- Eligible?
- —
Short-term bridge; refi at stabilization.
Rent comps 11 comps
| Address | Beds | Baths | Sqft | Rent | $/sqft | DOM | Units | Dist |
|---|---|---|---|---|---|---|---|---|
| 6102 7th Ave W Unit 6102 Bradenton, FL | 2.0 | 2.0 | 1050 | $2,600 | $2.48 | 23d | 1 | 0.03mi |
| 6318 7th Ave W Unit None Bradenton, FL | 2.0 | 2.0 | 1025 | $2,000 | $1.95 | 23d | 1 | 0.03mi |
| 6318 7th Ave W Bradenton, FL | 2.0 | 2.0 | 1025 | $1,800 | $1.76 | 23d | 1 | 0.03mi |
| 5008 Manatee Ave W Unit 1 Bradenton, FL | 1.0 | 1.0 | 875 | $1,000 | $1.14 | 23d | 1 | 0.59mi |
| 1403 56th St W Bradenton, FL | 1.0 | 1.0 | 812 | $1,445 | $1.78 | 16d | 1 | 0.63mi |
| 1403 56th St W #1403 Bradenton, FL | 1.0 | 1.0 | 812 | $1,595 | $1.96 | 23d | 1 | 0.65mi |
| 6904 Manatee Ave W Bradenton, FL | 1.0–3.0 | 1.0–2.0 | 1068 | $1,305 | $1.22 | 1d | 76 | 0.65mi |
| 202 46th St W Unit 207 Bradenton, FL | 2.0 | 2.0 | 951 | $1,800 | $1.89 | 16d | 1 | 0.87mi |
| 6415 21st Ave W Bradenton, FL | 1.0–2.0 | 1.0–2.0 | 1150 | $1,499 | $1.30 | 3d | 5 | 1.08mi |
| 6304 Pointe West Blvd Unit A309 Bradenton, FL | 2.0 | 2.0 | 1042 | $1,795 | $1.72 | 10d | 1 | 1.13mi |
| 5933 28th Ave W Bradenton, FL | 1.0–2.0 | 1.0–2.0 | 945 | $1,250 | $1.32 | 1d | 6 | 1.34mi |
HOA detail condo
- Monthly dues
- $746 · $8,952/yr
- Likely covers
- pool
- Assessments
- None detected in remarks — confirm with the listing agent.
Listing history 21 events
-
2026-06-18days on market $89,900 Active 100 DOM
-
2026-06-17days on market $89,900 Active 99 DOM
-
2026-06-16days on market $89,900 Active 98 DOM
-
2026-06-15days on market $89,900 Active 97 DOM
-
2026-06-13days on market $89,900 Active 95 DOM
-
2026-06-13days on market $89,900 Active 94 DOM
-
2026-06-10days on market $89,900 Active 92 DOM
-
2026-06-09days on market $89,900 Active 91 DOM
-
2026-06-08days on market $89,900 Active 90 DOM
-
2026-06-08days on market $89,900 Active 89 DOM
-
2026-06-03days on market $89,900 Active 85 DOM
-
2026-06-02days on market $89,900 Active 84 DOM
-
2026-06-01days on market $89,900 Active 83 DOM
-
2026-05-31days on market $89,900 Active 82 DOM
-
2026-05-18price $89,900
-
2026-04-06price $99,900
-
2026-03-10$109,900 Active
-
2021-12-17soldstatus $135,000
-
2005-05-17soldstatus $92,700
-
1996-05-14soldstatus $36,000
-
1979-04-01soldstatus $32,500
ⓘ Source: listings_history table (triggers on properties + properties_extension) + one-shot
backfill from property_details.listing_events for pre-trigger history.
Tax reassessment forecast FL · Resets to sale price
- Current annual tax
- $1,770 · $147/mo
- Projected year-2 tax
- $1,770 · $147/mo
- Expected delta
- $0/yr ($0/mo · -0.0%)
ⓘ Screening estimate from a state-policy table — verify with the county assessor before closing.
Nearby sold comps map
Loading sold comps map…
Walkable amenities ~0.75 mi
Loading nearby amenities…
Taxation est. · year 1
- Rental income
- $22,837
- − Mortgage interest
- −$5,036
- − Property taxes
- −$1,770
- − Insurance
- −$450
- − Repairs & maintenance
- −$1,827
- − Management
- −$1,827
- − HOA
- −$8,952
- − Depreciation
- −$2,615
- Taxable income
- $361
- Est. tax owed @ 24.0%
- −$87
- After-tax cash flow
- $1,126/yr
For passive investors: Depreciation is non-cash, so a rental often shows a tax loss while cash-flowing — sheltering income. Rental losses are passive: they offset passive income freely, and up to $25,000/yr can offset ordinary (W-2) income if you actively participate and your MAGI is under $100k (phasing out to $0 by $150k); unused losses carry forward. On sale, claimed depreciation is recaptured at up to 25%, and gains may owe capital-gains tax (a 1031 exchange can defer both). Figures are a year-1 estimate at your 24.0% rate — not tax advice; consult a CPA.
Schools (NCES district)
- District
- Manatee
- NCES district ID
- 1201230
- Math proficiency
- 54% ▼ -6.00%
- Reading proficiency
- 50% ▼ -2.00%
- Median HH income
- $49,607
- Composite
- 44.43/100
- National rank
- #2806
- State rank
- #26 of 73 in FL
Livability — Bradenton
- Score
- 81/100
- State rank
- #101
- US rank
- #1528
Category grades
Schools grade is shown separately in the Schools card above.
Census & demographics
- County
- Manatee County · 416,364 people
- City population
- 227,091
- Metro
- North Port-Sarasota-Bradenton, FL
- Population (ZIP)
- 33,224
- Household income
- $81,728
- Rent vs Own
- Severe rent burden
- 1126.0
Population outlook (Manatee County) Hauer SSP2
- Today (2025)
- 447,342 people
- By 2030
- 488,911 · +9.3%
- By 2040
- 567,934 · +27.0%
- By 2050
- 637,995 · +42.6%
- By 2075
- 781,970 · +74.8%
- By 2100
- 848,272 · +89.6%
Race, ethnicity, and origin ACS 2023
- Neighborhood character
- Predominantly White (84%)
- Race & ethnicity
- White 84% Hispanic / Latino 11% Two or more races 6% Black 2% Asian 1%
- Hispanic origin (detail)
- Puerto Rican 4% Cuban 3%
- Common ancestry
- Romanian 3% Slovak 3% Lithuanian 3%
- Foreign-born
- 9% · Canada, Jamaica, China
- Languages at home
- 90% English-only · Spanish 6% Russian/Polish/Slavic 1% Other Indo-European 1%
Political lean MEDSL · Manatee
- 2024 margin
- Strong R (+23.5) · D 37.9% · R 61.4%
- 2008→2024 swing
- -16.5pp toward R · 2008: -7.0pp · 2024: -23.5pp
- All cycles
- 2024: R+23.5 2020: R+16.1 2016: R+17.1 2012: R+12.5 2008: R+7.0
Not yet ingested
- Civics
- —
Market trends
- HPI YoY
- ▼ -360.34%
- Current HPI
- 320.0061
- Rent YoY
- ▼ -0.30%
- Metro
- North Port-Sarasota-Bradenton, FL
- State GDP YoY
- ▲ 3.28%
- F500 in state
- 36
Industry mix (Fortune 500 HQ in FL)
| Industry | F500 HQs | Revenue |
|---|---|---|
| Industrial Technology | 2 | $29B |
|
||
| Insurance | 2 | $17B |
|
||
| Retail | 1 | $60B |
|
||
| Technology Distribution | 1 | $58B |
|
||
| Homebuilding | 1 | $35B |
|
||
| Technology Manufacturing | 1 | $35B |
|
||
Price history
+176.6% since first listed7 events — show timeline
- 2026-05-18 Price Changed $89,900 Stellar MLS as Distributed by MLS Grid
- 2026-04-06 Price Changed $99,900 Stellar MLS as Distributed by MLS Grid
- 2026-03-10 Listed $109,900 Stellar MLS as Distributed by MLS Grid
- 2021-12-17 Sold (Public Records) $135,000 Public Records
- 2005-05-17 Sold (Public Records) $92,700 Public Records
- 1996-05-14 Sold (Public Records) $36,000 Public Records
- 1979-04-01 Sold (Public Records) $32,500 Public Records
Property tax history
+19.7%/yrLatest (2025): $1,770 · -6.4% YoY. Source: county tax records.
Cash-flow waterfall
monthlySold comps — $/sqft
last 12 mo · ≤1 miLoading sold comps…