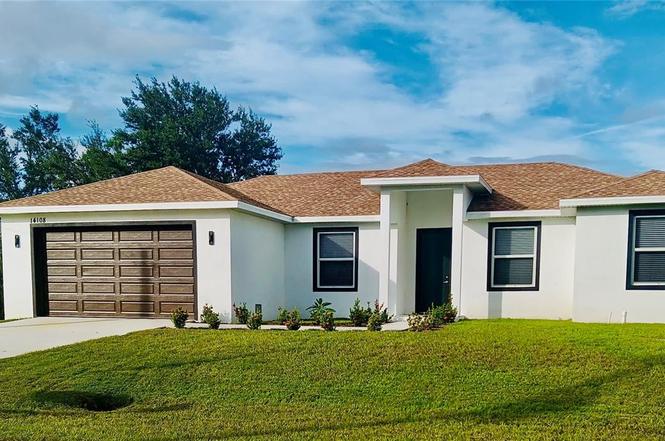
14108 Chesswood Ln · Rotonda, FL
Flood risk 9/10 · Severe
- FEMA flood zone
- AE
- Chance of flooding over 30 yrs
- 0.99%
- Est. flood insurance / yr
- $1,737 – $8,500
Fire risk 1/10 · Minimal
- Est. fire insurance / yr
- $947 – $1,759
Heat risk 10/10 · Severe
- Hot days now (above 107°F)
- 7 days/yr
- Hot days in 30 yrs
- 28 days/yr
Wind risk 10/10 · Severe
- Chance of severe wind over 30 yrs
- 99.0%
Air-quality risk 2/10 · Minimal
- Unhealthy air days now
- 1 days/yr
- Unhealthy air days in 30 yrs
- 1 days/yr
Risk factors via First Street. Map © Google.
Why this score? — see what drove the F grade
The composite is a weighted blend of 9 inputs, each scored 0–100. Each bar is that input's sub-score; the figure is the points it added to the 100-point composite (weight × sub-score).
- Cash flow +8.2/30.0
- ARV discount +7.5/15.0
- Schools +4.6/10.0
- Rent growth +3.8/5.0
- Livability +3.4/5.0
- 1% rule +2.6/10.0
- Condition / age +2.5/5.0
- DSCR +2.2/10.0
- Appreciation +0.0/10.0
$329,900
🖨 Deal sheet 📄 Offer letter ✓ Due diligence
Listing remarks MLS
Great building lot in South Gulf Cove. New large homes on street. Good lot for investment or home site.
Key facts
- Gardening space
- Creek views
- Waterfront living
Tags
Property features AI
Finance
- Other: Zoned RSF3.5; Lot is approximately 0.23 acres with asphalt road access; Water view: creek; Unfurnished
- HOA & community: Pets allowed
Exterior
- Parking: Attached 2-car garage
- Utilities: Public water; Public sewer; Electricity connected; Cable available; Broadband/high-speed internet available; Water connected; Sewer connected
- Home design: Single-family residence; New construction (completed); One-story; Southwest facing
- Construction: Block construction; Shingle roof; Stem wall foundation; Built as new construction
- Exterior features: Dog run; Sliding doors; Private mailbox; Additional exterior features noted
Interior
- Kitchen: Dishwasher; Disposal; Microwave; Range; Refrigerator; Electric water heater
- Bedrooms: 4 bedrooms
- Bathrooms: 2 full bathrooms
- Heating & cooling: Central heating; Central air conditioning
- Interior features: Ceiling fans; High ceilings; Open floor plan; Aluminum-frame windows with blinds
- Laundry & utility: Dedicated laundry room; Washer/dryer accessibility (accessible washer/dryer noted)
Neighborhood map
What this means for you Summary
Snapshot
- This is a 4-bed/2.0-bath land listed at $330k.
Deal economics
- At list price, monthly cash flow is $-732 ($-9k/yr) — negative.
- To cash-flow at today's rent, offer at most $201k (39.2% below list).
- To meet the 1% rule (rent ≥ 1% of price), the offer needs to be $250k (24.4% below list).
- Recommended offer: $201k (39.2% below list) — sets the bar for cash-flow.
- Cap rate 5.2% vs local median 3.1% in Rotonda — top-decile yield for the area; either an underpriced asset or a hidden risk that comps aren't pricing in. Stress-test before assuming the spread holds.
Location & tenants
- Location reads 67/100 on livability (#548 in FL) — a middle-class / working-renter tenant base. Strengths: crime A+, housing A-, cost of living B+; Watch: schools D, amenities F, commute F.
- Charlotte (suburban): math 54% / reading 54% proficiency, ranked #22 of 73 in FL (top 30%) — acceptable for families but not a draw, mixed tenant base, ~2y average lease.
- Market conditions: Rents rising fast (+5.3%/yr); 2188 active listings in the ZIP; 26 comparable units currently listed for rent nearby; rentals at typical pace (median 21d on market — plan ~3-4 weeks tenant-placement turnaround); solid renter incomes; 4,585 units permitted in Charlotte County in 2024 (703 in 5+ unit buildings).
- This rent runs 36% of the median local income ($84k/yr) — at the standard rent-burdened threshold; future hikes will face affordability resistance.
Forward outlook
- Local home prices are declining (-3.0%/yr); year-one equity from $2k of loan paydown is wiped out by about $10k of value loss. Plan a longer hold.
- Charlotte County population projected at +24% by 2050 — long-run rental-demand tailwind backs the buy-and-hold thesis.
Negotiation context
- It's been on market 204 days — a 12% lower offer ($290k) is reasonable based on typical stale-listing flexibility.
- 8 sale attempts since 20y ago; this cycle's ask is 14250% above the opening price — seller raised mid-cycle; expect resistance to lowballs.
- Current owner paid $17k; list at $330k implies a 1841% gain — meaningful room to come down on a strong offer.
Risks & watch-outs
- Watch-outs: flood insurance adds $427/mo.
- Climate carrying-cost: in FEMA flood zone AE (mandatory federal flood insurance); severe wind risk, 99% chance of damaging wind over 30y; extreme-heat days projected 7→28/yr by 2055 (HVAC capex compounding) — expect insurance premiums to compound above CPI over the hold.
Questions for the listing agent
- What do current leases actually rent for vs. the listed asking? Can we see a recent rent roll and the last 12 months of T-12 income?
- It's been on market 204 days. Have you received any prior offers? Is the seller open to a 39% concession, seller financing, or rate buy-down credit?
- What's the actual annual flood-insurance premium (NFIP or private), and is the property in a SFHA with mandatory coverage?
- Why hasn't it sold? Are there any deal-killer items the seller is aware of (foundation, flood, title, zoning, code violations)?
- Is there a deadline driving the sale (1031 exchange, divorce, estate, relocation)? That informs how much negotiation room exists.
- Schools are D-rated, which usually means shorter tenancies and higher turnover. Who's the typical renter profile here, and what's been the actual vacancy rate?
- The area grade is low — what's the realistic commute time and amenity access for the typical tenant pool here? Any planned neighborhood developments (good or bad) we should know about?
- What's the average days-on-market for RENTAL listings here right now (not sales)? A rising rental-DOM trend means longer vacancies and softer asking-rent achievability than the comps imply.
- What's the recent tenant-quality profile in this submarket — average credit score on applications, eviction rate, late-payment / NSF rate, and stable-employment percentage? A property-management company in the area should have these aggregated.
- How much new for-sale + rental construction is in the pipeline within 1–3 miles? Heavy new supply typically softens prices + rents 12–24 months out; constrained supply supports both.
Investment metrics
- 1% rule
- 0.76% ✗
- Cap rate
- 5.18%
- Cash-on-cash
- -3.97%
- DSCR
- 0.82
- GRM
- 11.0
CMA / ARV
No comps found within radius.
Projected returns pro-forma
-3.0% appreciation · 5.29% rent growth · sell at horizon
- IRR
- -30.0%
- Equity multiple
- -0.02×
- Total profit
- $-93,893
- Equity at exit
- $49,189
- IRR
- -21.6%
- Equity multiple
- -0.25×
- Total profit
- $-115,284
- Equity at exit
- $28,524
Cash invested: $92,372 (down + closing). Projections, not guarantees.
Landlord ↔ Tenant lean methodology
- Overall (STATE)
- 87 Strongly Landlord-Friendly
- State Florida
- 87 Strongly Landlord-Friendly · R+3
- County
- — inherits STATE
- City
- — inherits STATE
ZIP-level market 33981
- Home prices YoY
- -7.5%
- Rents YoY
- 5.3%
- Active inventory
- 2188
- Price-to-rent
- 11.0×
Monthly cashflow live
- Estimated rent
- $2,495 high interval (Pro) →
- Mortgage (P&I)
- −$1,730
- Tax from tax record
- −$409 /mo · $4,909/yr
- Insurance
- −$137
- Flood insurance flood zone
- −$427 /mo · $5,118/yr
- HOA
- −$0
- Vacancy / Maint / Mgmt
- −$524
- Net cashflow
- $-732
Break-even live
UW: 25.0% down · 7.5% · 30yr · 1.5% tax · 5.0% vac · 8.0% maint · 8.0% mgmt
Financing live
Cash to close
- Down payment
- $82,475
- Closing costs
- $9,897
- Reserves months
- —
- Total cash needed
- —
Loan-product check · same deal, 3 products live
Conventional
25% down · 7.5% · 30yr
- Down + closing
- —
- Monthly P&I
- —
- Monthly cashflow
- —
- DSCR
- —
- Eligible?
- —
Personal DTI + credit; lowest rate.
DSCR
20% down · 8.5% · 30yr
- Down + closing
- —
- Monthly P&I
- —
- Monthly cashflow
- —
- DSCR
- —
- Eligible?
- —
No personal income docs; deal must DSCR.
Hard money
10% down · 12.0% · 12mo
- Down + closing
- —
- Monthly P&I
- —
- Monthly cashflow
- —
- DSCR
- —
- Eligible?
- —
Short-term bridge; refi at stabilization.
Rent comps 26 comps
| Address | Beds | Baths | Sqft | Rent | $/sqft | DOM | Units | Dist |
|---|---|---|---|---|---|---|---|---|
| 8362 Santa Cruz Dr Port Charlotte, FL | 3.0 | 2.5 | 2016 | $3,500 | $1.74 | 21d | 1 | 0.21mi |
| 14295 Overlook Ave Port Charlotte, FL | 3.0 | 2.0 | 1450 | $1,700 | $1.17 | 21d | 1 | 0.36mi |
| 14073 Naylor Ave Port Charlotte, FL | 3.0 | 2.0 | 1818 | $2,250 | $1.24 | 21d | 1 | 0.47mi |
| 8373 Agate St Unit 8375 Port Charlotte, FL | 3.0 | 2.0 | 1379 | $1,747 | $1.27 | 21d | 1 | 0.50mi |
| 8249 Dimstead St Port Charlotte, FL | 3.0 | 2.0 | 1202 | $1,675 | $1.39 | 21d | 1 | 0.52mi |
| 9108 Santa Lucia Dr Port Charlotte, FL | 4.0 | 2.0 | 1917 | $3,100 | $1.62 | 13d | 1 | 0.52mi |
| 13376 Yager Ln Port Charlotte, FL | 3.0 | 2.0 | 2002 | $3,500 | $1.75 | 13d | 1 | 0.54mi |
| 8479 Agate St Port Charlotte, FL | 3.0 | 2.0 | 1379 | $2,495 | $1.81 | 21d | 1 | 0.62mi |
| 8519 Agate St Unit 8521 Port Charlotte, FL | 3.0 | 2.0 | 1379 | $1,697 | $1.23 | 21d | 1 | 0.67mi |
| 9116 Agate St #9118 Port Charlotte, FL | 3.0 | 2.0 | 1429 | $1,750 | $1.22 | 21d | 1 | 0.94mi |
| 7415 Beckley St Port Charlotte, FL | 3.0 | 2.0 | 1405 | $1,400 | $1.00 | 21d | 1 | 0.97mi |
| 9156 Agate St Unit 9156 Port Charlotte, FL | 3.0 | 2.0 | 1379 | $1,747 | $1.27 | 21d | 1 | 1.02mi |
| 15077 Acorn Cir Port Charlotte, FL | 3.0 | 2.0 | 2044 | $2,000 | $0.98 | 13d | 1 | 1.02mi |
| 9163 Agate St Unit 9165 Port Charlotte, FL | 3.0 | 2.0 | 1379 | $1,697 | $1.23 | 21d | 1 | 1.05mi |
| 9163 Agate St Unit 9163 Port Charlotte, FL | 3.0 | 2.0 | 1379 | $1,747 | $1.27 | 21d | 1 | 1.05mi |
| 9379 Snapper Cir Port Charlotte, FL | 4.0 | 2.0 | 2013 | $2,690 | $1.34 | 13d | 1 | 1.07mi |
| 9195 Agate St Port Charlotte, FL | 3.0 | 2.0 | 1200 | $1,650 | $1.38 | 13d | 1 | 1.10mi |
| 203 Wright Dr Rotonda West, FL | 4.0 | 3.0 | 2092 | $2,400 | $1.15 | 21d | 1 | 1.11mi |
| 9251 Agate St Port Charlotte, FL | 3.0 | 2.0 | 1237 | $1,565 | $1.27 | 21d | 1 | 1.19mi |
| 15153 Spanish Point Dr Port Charlotte, FL | 4.0 | 3.0 | 2006 | $3,575 | $1.78 | 21d | 1 | 1.25mi |
| 9317 Agate St Unit 9317 Port Charlotte, FL | 3.0 | 2.0 | 1379 | $1,747 | $1.27 | 21d | 1 | 1.29mi |
| 13180 Amaryllis Cir Port Charlotte, FL | 3.0 | 2.0 | 1704 | $2,950 | $1.73 | 13d | 1 | 1.32mi |
| 9458 Modesto Cir Port Charlotte, FL | 3.0 | 2.0 | 2153 | $2,750 | $1.28 | 21d | 1 | 1.35mi |
| 9400 Agate St Pt Charlotte, FL | 3.0 | 2.0 | 1429 | $1,795 | $1.26 | 21d | 1 | 1.39mi |
| 9425 Agate St Unit 9425 Port Charlotte, FL | 3.0 | 2.0 | 1379 | $1,700 | $1.23 | 21d | 1 | 1.44mi |
| 10047 Greetings St Port Charlotte, FL | 4.0 | 2.0 | 2238 | $3,200 | $1.43 | 21d | 1 | 1.47mi |
Listing history 50 events
-
2026-06-18days on market $329,900 Active 204 DOM
-
2026-06-17days on market $329,900 Active 203 DOM
-
2026-06-16days on market $329,900 Active 202 DOM
-
2026-06-15days on market $329,900 Active 201 DOM
-
2026-06-14days on market $329,900 Active 199 DOM
-
2026-06-13days on market $329,900 Active 198 DOM
-
2026-06-10days on market $329,900 Active 196 DOM
-
2026-06-09days on market $329,900 Active 195 DOM
-
2026-06-08days on market $329,900 Active 194 DOM
-
2026-06-05days on market $329,900 Active 190 DOM
-
2026-06-03price $329,900 Active 188 DOM
-
2026-06-02days on market $332,900 Active 188 DOM
-
2026-06-01days on market $332,900 Active 187 DOM
-
2026-06-01price $332,900 Active 186 DOM
-
2026-05-31days on market $329,900 Active 186 DOM
-
2026-05-30days on market $329,900 Active 185 DOM
-
2026-05-15price $299,900
-
2026-03-24status Active
-
2026-03-24price $305,000
-
2026-03-02historical $2,200
-
2026-02-17price $310,000
-
2026-02-15status Active
-
2026-02-03price $315,000
-
2026-01-25price $349,900
-
2026-01-21price $310,000
-
2026-01-14price $2,200
-
2026-01-13price $315,000
-
2026-01-13status Active
-
2026-01-06$2,299
-
2026-01-05historical
-
2025-12-24status Active
-
2025-11-20status Pending
-
2025-11-18price $320,000
-
2025-11-15price $314,900
-
2025-10-30price $319,900
-
2025-10-27price $325,000
-
2025-10-22price $336,800
-
2025-10-22price $338,900
-
2025-10-21price $349,900
-
2025-10-21price $358,000
-
2025-10-19price $338,000
-
2025-09-05$348,000 Active
-
2025-09-05historical $1,995
-
2025-08-09price $1,995
-
2025-08-09price $2,195
-
2025-08-07price $1,995
-
2025-07-10price $2,195
-
2025-06-21$2,349
-
2021-08-09soldstatus $17,000
-
2007-06-06soldstatus $20,000
ⓘ Source: listings_history table (triggers on properties + properties_extension) + one-shot
backfill from property_details.listing_events for pre-trigger history.
Tax reassessment forecast FL · Resets to sale price
- Current annual tax
- $4,909 · $409/mo
- Projected year-2 tax
- $4,909 · $409/mo
- Expected delta
- $0/yr ($0/mo · 0.0%)
ⓘ Screening estimate from a state-policy table — verify with the county assessor before closing.
Climate risk First Street
- Flood 9/10 Extreme FEMA zone AE · 99% chance over 30 yrs
- Wildfire 1/10 Low
- Heat 10/10 Extreme 7 d/yr ≥107°F today · 28 d/yr by 30 yrs out
- Wind 10/10 Extreme 99% chance of damaging wind over 30 yrs
- Air quality 2/10 Low 1 unhealthy d/yr today · 1 by 30 yrs out
Nearby sold comps map
Loading sold comps map…
Walkable amenities ~0.75 mi
Loading nearby amenities…
Taxation est. · year 1
- Rental income
- $29,943
- − Mortgage interest
- −$18,480
- − Property taxes
- −$4,909
- − Insurance
- −$6,768
- − Repairs & maintenance
- −$2,395
- − Management
- −$2,395
- − Depreciation
- −$9,597
- Taxable loss
- −$14,602
- Est. tax savings @ 24.0%
- +$3,504
- After-tax cash flow
- $-5,278/yr
For passive investors: Depreciation is non-cash, so a rental often shows a tax loss while cash-flowing — sheltering income. Rental losses are passive: they offset passive income freely, and up to $25,000/yr can offset ordinary (W-2) income if you actively participate and your MAGI is under $100k (phasing out to $0 by $150k); unused losses carry forward. On sale, claimed depreciation is recaptured at up to 25%, and gains may owe capital-gains tax (a 1031 exchange can defer both). Figures are a year-1 estimate at your 24.0% rate — not tax advice; consult a CPA.
Schools (NCES district)
- District
- Charlotte
- NCES district ID
- 1200240
- Math proficiency
- 54% ▼ -6.00%
- Reading proficiency
- 54% ▼ -1.00%
- Median HH income
- $44,864
- Composite
- 45.62/100
- National rank
- #2586
- State rank
- #22 of 73 in FL
Livability — Rotonda
- Score
- 67/100
- State rank
- #548
- US rank
- #10359
Category grades
Schools grade is shown separately in the Schools card above.
Census & demographics
- County
- Charlotte County · 196,994 people
- City population
- 10,490
- Metro
- Punta Gorda, FL
- Population (ZIP)
- 15,622
- Household income
- $84,098
- Rent vs Own
- Severe rent burden
- 105.0
Population outlook (Charlotte County) Hauer SSP2
- Today (2025)
- 198,646 people
- By 2030
- 210,507 · +6.0%
- By 2040
- 230,857 · +16.2%
- By 2050
- 247,148 · +24.4%
- By 2075
- 281,777 · +41.8%
- By 2100
- 293,609 · +47.8%
Race, ethnicity, and origin ACS 2023
- Neighborhood character
- Predominantly White (89%)
- Race & ethnicity
- White 89% Two or more races 4% Hispanic / Latino 4% Black 2% Asian 1%
- Common ancestry
- Romanian 4% Lithuanian 3% Italian 2%
- Foreign-born
- 6% · Canada
- Languages at home
- 96% English-only · Spanish 1% German/W. Germanic 1% Tagalog/Filipino 1%
Political lean MEDSL · Charlotte
- 2024 margin
- Solid R (+34.0) · D 32.7% · R 66.7%
- 2008→2024 swing
- -26.7pp toward R · 2008: -7.2pp · 2024: -34.0pp
- All cycles
- 2024: R+34.0 2020: R+26.6 2016: R+27.8 2012: R+14.3 2008: R+7.2
Not yet ingested
- Civics
- —
Market trends
- HPI YoY
- ▼ -28.09%
- Current HPI
- 346.5247
- Rent YoY
- ▲ 5.29%
- Metro
- Punta Gorda, FL
- State GDP YoY
- ▲ 3.28%
- F500 in state
- 36
Industry mix (Fortune 500 HQ in FL)
| Industry | F500 HQs | Revenue |
|---|---|---|
| Industrial Technology | 2 | $29B |
|
||
| Insurance | 2 | $17B |
|
||
| Retail | 1 | $60B |
|
||
| Technology Distribution | 1 | $58B |
|
||
| Homebuilding | 1 | $35B |
|
||
| Technology Manufacturing | 1 | $35B |
|
||
Price history
+21321.4% since first listed37 events — show timeline
- 2026-05-15 Price Changed $299,900 Stellar MLS as Distributed by MLS Grid
- 2026-03-24 Relisted — Stellar MLS as Distributed by MLS Grid
- 2026-03-24 Price Changed $305,000 Stellar MLS as Distributed by MLS Grid
- 2026-03-02 Rental Removed $2,200 STELLARMLS
- 2026-02-17 Price Changed $310,000 Stellar MLS as Distributed by MLS Grid
- 2026-02-15 Relisted — Stellar MLS as Distributed by MLS Grid
- 2026-02-03 Price Changed $315,000 Stellar MLS as Distributed by MLS Grid
- 2026-01-25 Price Changed $349,900 Stellar MLS as Distributed by MLS Grid
- 2026-01-21 Price Changed $310,000 Stellar MLS as Distributed by MLS Grid
- 2026-01-14 Price Changed $2,200 STELLARMLS
- 2026-01-13 Price Changed $315,000 Stellar MLS as Distributed by MLS Grid
- 2026-01-13 Relisted — Stellar MLS as Distributed by MLS Grid
- 2026-01-06 Listed for Rent $2,299 STELLARMLS
- 2026-01-05 Listing Removed — Stellar MLS as Distributed by MLS Grid
- 2025-12-24 Relisted — Stellar MLS as Distributed by MLS Grid
- 2025-11-20 Pending — Stellar MLS as Distributed by MLS Grid
- 2025-11-18 Price Changed $320,000 Stellar MLS as Distributed by MLS Grid
- 2025-11-15 Price Changed $314,900 Stellar MLS as Distributed by MLS Grid
- 2025-10-30 Price Changed $319,900 Stellar MLS as Distributed by MLS Grid
- 2025-10-27 Price Changed $325,000 Stellar MLS as Distributed by MLS Grid
- 2025-10-22 Price Changed $336,800 Stellar MLS as Distributed by MLS Grid
- 2025-10-22 Price Changed $338,900 Stellar MLS as Distributed by MLS Grid
- 2025-10-21 Price Changed $349,900 Stellar MLS as Distributed by MLS Grid
- 2025-10-21 Price Changed $358,000 Stellar MLS as Distributed by MLS Grid
- 2025-10-19 Price Changed $338,000 Stellar MLS as Distributed by MLS Grid
- 2025-09-05 Listed $348,000 Stellar MLS as Distributed by MLS Grid
- 2025-09-05 Rental Removed $1,995 TENANTTURNER2
- 2025-08-09 Price Changed $1,995 TENANTTURNER2
- 2025-08-09 Price Changed $2,195 TENANTTURNER2
- 2025-08-07 Price Changed $1,995 TENANTTURNER2
- 2025-07-10 Price Changed $2,195 TENANTTURNER2
- 2025-06-21 Listed for Rent $2,349 TENANTTURNER2
- 2021-08-09 Sold (Public Records) $17,000 Public Records
- 2007-06-06 Sold (Public Records) $20,000 Public Records
- 2007-06-01 Sold (MLS) $20,000 Stellar MLS as Distributed by MLS Grid
- 2006-11-14 Listed $29,900 Stellar MLS as Distributed by MLS Grid
- 2001-06-25 Sold (Public Records) $1,400 Public Records
Property tax history
+23.2%/yrLatest (2025): $4,909 · +691.1% YoY. Source: county tax records.
Cash-flow waterfall
monthlySold comps — $/sqft
last 12 mo · ≤1 miLoading sold comps…