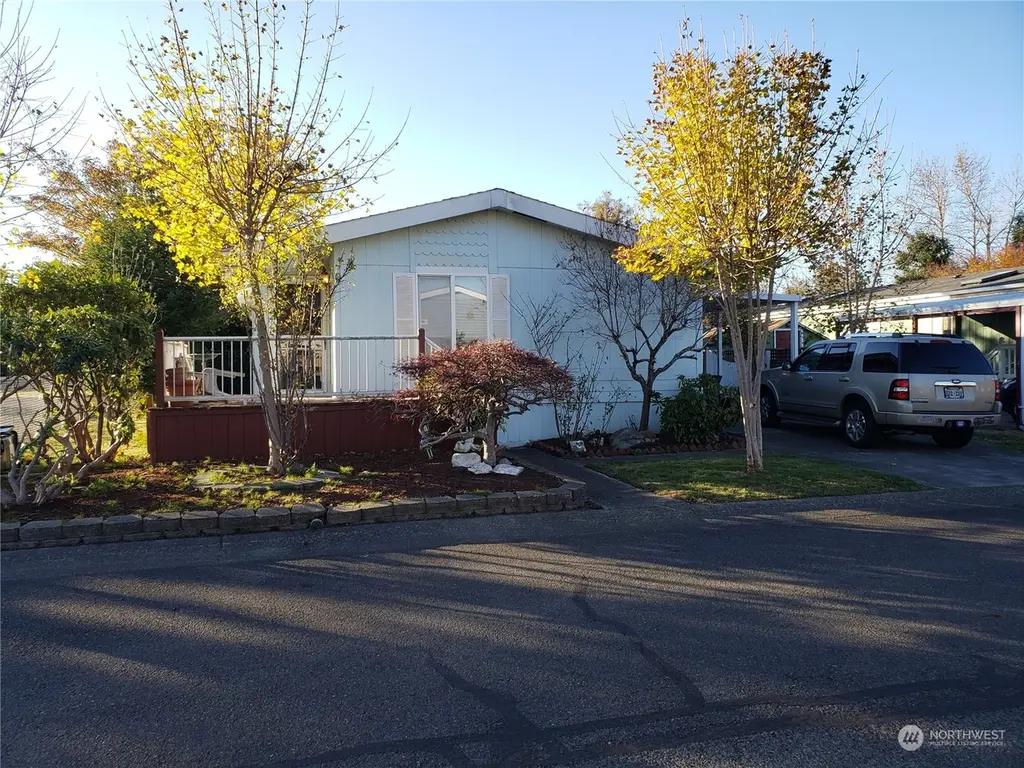
520 Willow Dr #111 · Enumclaw, WA
Flood risk 8/10 · Major
- FEMA flood zone
- X (unshaded)
- Chance of flooding over 30 yrs
- 0.99%
- Est. flood insurance / yr
- $507 – $1,088
Fire risk 3/10 · Minor
- Est. fire insurance / yr
- $604 – $1,122
Heat risk 2/10 · Minimal
- Hot days now (above 87°F)
- 7 days/yr
- Hot days in 30 yrs
- 16 days/yr
Wind risk 1/10 · Minimal
- Chance of severe wind over 30 yrs
- —
Air-quality risk 6/10 · Moderate
- Unhealthy air days now
- 10 days/yr
- Unhealthy air days in 30 yrs
- 12 days/yr
Risk factors via First Street. Map © Google.
Why this score? — see what drove the B- grade
The composite is a weighted blend of 9 inputs, each scored 0–100. Each bar is that input's sub-score; the figure is the points it added to the 100-point composite (weight × sub-score).
- Cash flow +30.0/30.0
- DSCR +10.0/10.0
- 1% rule +9.5/10.0
- Schools +5.5/10.0
- Livability +4.4/5.0
- ARV discount +4.1/15.0
- Rent growth +3.6/5.0
- Condition / age +2.2/5.0
- Appreciation +0.0/10.0
$145,000
🖨 Deal sheet 📄 Offer letter ✓ Due diligence
Listing remarks
Spacious 3 Bedroom or 3 Bedroom 2 Bath Home in an All Age Community in Enumclaw. Sit on the Large front porch and Enjoy the Mountain View. Open Bright Kitchen With Light Wood Cabinets, and All Appliances will Stay. Huge Living Room and Dining Room With Cathedral Ceilings and a Free Standing Wood Burning Stove that heats the Whole House. Large Master Bedroom With Double Wall Closets. Master Bathroom with Shower. Second and Third Bedrooms are good Sized and One Could be used as an Office as well. Separate Utility room with Storage Cabinets. Nice Dry Storage Shed. Private Pet Friendly Fenced Back Yard with apple trees. Good size Full Length 3 Vehicle Driveway and Car Carport. Priced to Sell. T
Key facts
- Built 1994
- Listed 1269 days
Property features AI
Finance
- Other: Taxes and specific assessed values excluded
- Financial info: Land lease: $1,075; Listing terms: Cash, Conventional
- HOA & community: Located in Mountain Meadows Community LLC (approx. 190 homes); Park amenities include clubhouse, common area, playground, trails, high-speed internet availability
Exterior
- Parking: Carport; RV parking available in community
- Utilities: Public water (City of Enumclaw); City of Enumclaw sewer; PSE power; Cable connected (Xfinity); Internet connected (Xfinity)
- Home design: Manufactured double-wide home (Fuqua); One story; Very good condition; Mobile home remains; Style: Manufactured - Double Wide
- Construction: Wood construction; Composition roof; Skirted with wood; Pillar/post/pier foundation with tie downs; Manufactured after 6/15/1976
- Exterior features: Wood exterior/wood products; Paved lot; Has view
Interior
- Kitchen: Stove/Range
- Bedrooms: 3 bedrooms
- Flooring: Laminate; Vinyl plank; Carpet
- Bathrooms: 2 full bathrooms
- Heating & cooling: Wood heating (see remarks); Electric energy source (see remarks)
- Interior features: Water heater (electric, located in closet); Skylights; Vaulted ceilings; Ceiling fan(s); Walk-in closet(s); Awnings; Double pane windows
- Laundry & utility: Utility room
Neighborhood map
What this means for you Summary
Snapshot
- This is a 3-bed/2.0-bath manufactured listed at $145k. Condition is rated fair.
Deal economics
- At list price, monthly cash flow is $597 ($7k/yr) — positive.
- The deal already cash-flows at list — no discount required.
- Meets the 1% rule at list price ($2k rent vs $145k).
- Recommended offer: $128k (12.0% below list) — sets the bar for market timing.
- Cap rate 11.8% vs local median 2.4% in Enumclaw — top-decile yield for the area; either an underpriced asset or a hidden risk that comps aren't pricing in. Stress-test before assuming the spread holds.
Location & tenants
- Location reads 88/100 on livability (#12 in WA, #222 nationally) — a professional / high-income tenant draw. Strengths: crime A+, amenities A+, housing A+; Watch: cost of living D-.
- Enumclaw School District (suburban): math 54% / reading 68% proficiency, ranked #46 of 291 in WA (top 16%) — acceptable for families but not a draw, mixed tenant base, ~2y average lease.
- Zoned schools: Southwood Elementary School (345 students, 38% FRL); Enumclaw Sr High School (1,339 students, 28% FRL).
- Market conditions: Rents rising fast (+4.3%/yr); 223 active listings in the ZIP; 13 comparable units currently listed for rent nearby; rentals leasing fast (median 10d on market — plan ~1-2 weeks tenant-placement turnaround); high-income renter base; 10,555 units permitted in King County in 2024 (7,119 in 5+ unit buildings).
Forward outlook
- Local home prices are declining (-3.0%/yr); year-one equity from $1k of loan paydown is wiped out by about $4k of value loss. Plan a longer hold.
- King County population projected at +44% by 2050 — long-run rental-demand tailwind backs the buy-and-hold thesis.
- At projected returns (-3.0% appreciation + 4.3% rent growth), your $41k cash investment doubles in ~7 years — after that, you're playing with house money.
Negotiation context
- It's been on market 1269 days — a 12% lower offer ($128k) is reasonable based on typical stale-listing flexibility.
- 7 sale attempts since 26y ago; this cycle's ask has dropped $24k (14%) from the opening price — seller is motivated, your offer sets the floor, not the list.
- Current owner paid $62k; list at $145k implies a 132% gain — meaningful room to come down on a strong offer.
Risks & watch-outs
- Watch-outs: flood insurance adds $66/mo.
- Climate carrying-cost: severe flood risk — expect insurance premiums to compound above CPI over the hold.
Questions for the listing agent
- It's been on market 1269 days. Have you received any prior offers? Is the seller open to a 12% concession, seller financing, or rate buy-down credit?
- Have any recent inspections been done? Can we get a copy of the seller's disclosures and any deferred-maintenance estimates?
- What's the actual annual flood-insurance premium (NFIP or private), and is the property in a SFHA with mandatory coverage?
- Why hasn't it sold? Are there any deal-killer items the seller is aware of (foundation, flood, title, zoning, code violations)?
- Is there a deadline driving the sale (1031 exchange, divorce, estate, relocation)? That informs how much negotiation room exists.
- What's the average days-on-market for RENTAL listings here right now (not sales)? A rising rental-DOM trend means longer vacancies and softer asking-rent achievability than the comps imply.
- What's the recent tenant-quality profile in this submarket — average credit score on applications, eviction rate, late-payment / NSF rate, and stable-employment percentage? A property-management company in the area should have these aggregated.
- How much new for-sale + rental construction is in the pipeline within 1–3 miles? Heavy new supply typically softens prices + rents 12–24 months out; constrained supply supports both.
Investment metrics
- 1% rule
- 1.45% ✓
- Cap rate
- 11.78%
- Cash-on-cash
- 19.60%
- DSCR
- 1.87
- GRM
- 5.7
CMA / ARV
- ARV (median comp)
- $134,893
- List price
- $145,000
- Delta
- 7.49%
- Verdict
- FAIR
- Comps
- 20 within 1.0 mi
Show comp detail 12 sales within ~0.75 mi
| Address | Dist | Beds/Ba | Sqft | Sold | Price | $/sf | Match |
|---|---|---|---|---|---|---|---|
| 1106 Mountian Villa Loop | 0.21mi | 2/2.0 (-1) | 1,248 (0%) | 10mo | $90,000 | $72 | 78 |
| 206 Noble Fir Cir | 0.21mi | 2/2.0 (-1) | 1,248 (0%) | 11mo | $70,000 | $56 | 76 |
| 209 Noble Fir Cir #60 | 0.18mi | 3/2.0 | 1,344 (+8%) | 3mo | $150,000 | $112 | 76 |
| 1144 Douglas Fir | 0.10mi | 3/2.0 | 1,344 (+8%) | 11mo | $180,000 | $134 | 74 |
| 926 Pine Dr | 0.30mi | 2/2.0 (-1) | 1,248 (0%) | 9mo | $119,500 | $96 | 74 |
| 201 Grand Fir Dr | 0.17mi | 3/2.0 | 1,188 (-5%) | 14mo | $144,000 | $121 | 73 |
| 943 Pine Dr | 0.30mi | 3/2.0 | 1,244 (-0%) | 16mo | $210,000 | $169 | 72 |
| 207 Noble Fir Cir | 0.20mi | 2/2.0 (-1) | 1,344 (+8%) | 3mo | $140,000 | $104 | 71 |
| 252 Grand Fir Dr #25 | 0.19mi | 3/2.0 | 1,352 (+8%) | 12mo | $185,000 | $137 | 67 |
| 1321 Spruce Dr | 0.13mi | 2/2.0 (-1) | 1,200 (-4%) | 20mo | $124,900 | $104 | 66 |
| 300 Grand Fir Dr | 0.12mi | 3/2.0 | 1,120 (-10%) | 20mo | $189,999 | $170 | 61 |
| 2150 Oak Ave | 0.23mi | 3/2.0 | 1,064 (-15%) | 9mo | $150,000 | $141 | 57 |
Match score weights: distance 35% · size 25% · config 20% · recency 20%. Top-matched comps best support the ARV.
Projected returns pro-forma
-3.0% appreciation · 4.32% rent growth · sell at horizon
- IRR
- 10.7%
- Equity multiple
- 1.43×
- Total profit
- $17,426
- Equity at exit
- $21,620
- IRR
- 20.8%
- Equity multiple
- 2.88×
- Total profit
- $76,374
- Equity at exit
- $12,537
Cash invested: $40,600 (down + closing). Projections, not guarantees.
Landlord ↔ Tenant lean methodology
- Overall (STATE)
- 28 Tenant-Leaning
- State Washington
- 28 Tenant-Leaning · D+8
- County
- — inherits STATE
- City
- — inherits STATE
ZIP-level market 98022
- Rents YoY
- 4.3%
- Active inventory
- 223
- Price-to-rent
- 5.7×
Monthly cashflow live
- Estimated rent
- $2,108 high interval (Pro) →
- Mortgage (P&I)
- −$760
- Tax est. 1.5%
- −$181 /mo · $2,175/yr
- Insurance
- −$60
- Flood insurance flood zone
- −$66 /mo · $798/yr
- HOA
- −$0
- Vacancy / Maint / Mgmt
- −$443
- Net cashflow
- $597
Break-even live
UW: 25.0% down · 7.5% · 30yr · 1.5% tax · 5.0% vac · 8.0% maint · 8.0% mgmt
Financing live
Cash to close
- Down payment
- $36,250
- Closing costs
- $4,350
- Reserves months
- —
- Total cash needed
- —
Loan-product check · same deal, 3 products live
Conventional
25% down · 7.5% · 30yr
- Down + closing
- —
- Monthly P&I
- —
- Monthly cashflow
- —
- DSCR
- —
- Eligible?
- —
Personal DTI + credit; lowest rate.
DSCR
20% down · 8.5% · 30yr
- Down + closing
- —
- Monthly P&I
- —
- Monthly cashflow
- —
- DSCR
- —
- Eligible?
- —
No personal income docs; deal must DSCR.
Hard money
10% down · 12.0% · 12mo
- Down + closing
- —
- Monthly P&I
- —
- Monthly cashflow
- —
- DSCR
- —
- Eligible?
- —
Short-term bridge; refi at stabilization.
Rent comps 13 comps
| Address | Beds | Baths | Sqft | Rent | $/sqft | DOM | Units | Dist |
|---|---|---|---|---|---|---|---|---|
| 141 Leos Pl Enumclaw, WA | 2.0 | 1.0 | 850 | $1,850 | $2.18 | 43d | 1 | 0.08mi |
| 141 Leos Pl Enumclaw, WA | 2.0 | 1.0 | 850 | $1,825 | $2.15 | 24d | 1 | 0.08mi |
| 653 Myrtine St Unit A Enumclaw, WA | 2.0 | 1.0 | 850 | $1,895 | $2.23 | 22d | 1 | 0.15mi |
| 312 Charwila Ln Enumclaw, WA | 2.0 | 1.0 | 894 | $1,750 | $1.96 | 12d | 1 | 0.41mi |
| 250 Charwila Ln Enumclaw, WA | 2.0 | 1.0 | 894 | $1,750 | $1.96 | 2d | 1 | 0.41mi |
| 2630 Warner Ave Enumclaw, WA | 1.0–2.0 | 1.0 | 762 | $2,000 | $2.62 | 1d | 1 | 0.49mi |
| 847 Blake St Enumclaw, WA | 3.0 | 1.0 | 1064 | $2,000 | $1.88 | 1d | 1 | 0.52mi |
| 750 Watson St N Enumclaw, WA | 1.0–2.0 | 1.0 | 771 | $1,842 | $2.39 | 1d | 6 | 0.66mi |
| 615 Watson St N Unit 617B Enumclaw, WA | 2.0 | 1.0 | 960 | $1,999 | $2.08 | 1d | 1 | 0.73mi |
| 556 Bondgard Ave E Enumclaw, WA | 3.0 | 2.0 | 1480 | $2,995 | $2.02 | 10d | 1 | 1.01mi |
| 1571 Kibler Ave Enumclaw, WA | 3.0 | 2.0 | 1200 | $2,600 | $2.17 | 20d | 1 | 1.09mi |
| 1571 Kibler Ave Enumclaw, WA | 3.0 | 2.0 | 1200 | $2,600 | $2.17 | 15d | 1 | 1.09mi |
| 320 Chinook Ave Enumclaw, WA | 2.0–3.0 | 1.0–2.0 | 923 | $2,283 | $2.47 | 1d | 7 | 1.21mi |
Listing history 27 events
-
2026-06-18days on market $145,000 Active 1269 DOM
-
2026-06-17days on market $145,000 Active 1268 DOM
-
2026-06-16days on market $145,000 Active 1267 DOM
-
2026-06-15days on market $145,000 Active 1266 DOM
-
2026-06-13days on market $145,000 Active 1264 DOM
-
2026-06-09days on market $145,000 Active 1260 DOM
-
2026-06-08days on market $145,000 Active 1259 DOM
-
2026-06-07days on market $145,000 Active 1258 DOM
-
2026-06-04days on market $145,000 Active 1255 DOM
-
2026-06-03days on market $145,000 Active 1254 DOM
-
2026-06-02days on market $145,000 Active 1253 DOM
-
2026-06-01days on market $145,000 Active 1252 DOM
-
2026-05-31days on market $145,000 Active 1251 DOM
-
2024-10-02status Active
-
2024-04-02status Active
-
2024-02-04status Active
-
2024-02-01historical
-
2023-12-06price $149,950
-
2023-11-25status Active
-
2023-11-15status Pending - Backup Offer Requested
-
2023-10-30price $154,950
-
2023-07-26status Active
-
2023-07-04status Pending
-
2022-12-15price $159,950
-
2022-11-18$169,000 Active
-
2000-06-01soldstatus $62,500
-
2000-04-06$65,000
ⓘ Source: listings_history table (triggers on properties + properties_extension) + one-shot
backfill from property_details.listing_events for pre-trigger history.
Climate risk First Street
- Flood 8/10 Severe FEMA zone X (unshaded) · 99% chance over 30 yrs
- Wildfire 3/10 Moderate
- Heat 2/10 Low 7 d/yr ≥87°F today · 16 d/yr by 30 yrs out
- Wind 1/10 Low
- Air quality 6/10 Major 10 unhealthy d/yr today · 12 by 30 yrs out
Nearby sold comps map
Loading sold comps map…
Walkable amenities ~0.75 mi
Loading nearby amenities…
Taxation est. · year 1
- Rental income
- $25,297
- − Mortgage interest
- −$8,122
- − Property taxes
- −$2,175
- − Insurance
- −$1,522
- − Repairs & maintenance
- −$2,024
- − Management
- −$2,024
- − Depreciation
- −$4,218
- Taxable income
- $5,211
- Est. tax owed @ 24.0%
- −$1,251
- After-tax cash flow
- $5,911/yr
For passive investors: Depreciation is non-cash, so a rental often shows a tax loss while cash-flowing — sheltering income. Rental losses are passive: they offset passive income freely, and up to $25,000/yr can offset ordinary (W-2) income if you actively participate and your MAGI is under $100k (phasing out to $0 by $150k); unused losses carry forward. On sale, claimed depreciation is recaptured at up to 25%, and gains may owe capital-gains tax (a 1031 exchange can defer both). Figures are a year-1 estimate at your 24.0% rate — not tax advice; consult a CPA.
Condition & rehab AI · 11 photos
The property is in fair condition with moderate rehabilitation needed. The kitchen and bathroom require updates, and the exterior siding shows minor wear. Landscaping and curb appeal improvements would significantly enhance its value.
Repairs flagged
- Minor kitchen cabinets — Light wear on the wood
- Major bathroom tiles — Outdated and cluttered with items
- Minor exterior siding — Visible wear
Value-add opportunities
- Both Paint and update kitchen cabinets — Enhances curb appeal and interior aesthetics
- Both Replace bathroom tiles — Improves functionality and aesthetics
- Both Landscaping and curb appeal improvements — Enhances overall property value and appeal
Renovation cost estimate screening
| Repair item | Severity | Est. cost |
|---|---|---|
| kitchen cabinets · Light wear on the wood | Minor | $500–3,000 |
| bathroom tiles · Outdated and cluttered with items | Major | $15,000–50,000 |
| exterior siding · Visible wear | Minor | $500–3,000 |
| Total estimated repair cost · 3 items | $16,000–56,000 |
Value-add ROI direction
- Both Paint and update kitchen cabinets — Enhances curb appeal and interior aesthetics ↑
- Both Replace bathroom tiles — Improves functionality and aesthetics ↑
- Both Landscaping and curb appeal improvements — Enhances overall property value and appeal ↑
ⓘ Cost ranges are severity-bucket heuristics (US national rule-of-thumb). Get contractor quotes + a written scope before underwriting a rehab budget.
Schools (NCES district)
- District
- Enumclaw School District
- NCES district ID
- 5300001
- Math proficiency
- 54% ▼ -1.00%
- Reading proficiency
- 68% ▬ 0.00%
- Median HH income
- $68,441
- Composite
- 55.21/100
- National rank
- #2736
- State rank
- #46 of 291 in WA
Livability — Enumclaw
- Score
- 88/100
- State rank
- #12
- US rank
- #222
Category grades
Schools grade is shown separately in the Schools card above.
Census & demographics
- Census place
- Enumclaw, WA
- County
- King County · 2,251,916 people
- City population
- 22,418
- Metro
- Seattle-Tacoma-Bellevue, WA
- Population (ZIP)
- 22,418
- Household income
- $120,406
- Rent vs Own
- Severe rent burden
- 382.0
Population outlook (King County) Hauer SSP2
- Today (2025)
- 2,576,485 people
- By 2030
- 2,803,316 · +8.8%
- By 2040
- 3,255,921 · +26.4%
- By 2050
- 3,706,444 · +43.9%
- By 2075
- 4,746,063 · +84.2%
- By 2100
- 5,407,730 · +109.9%
Race, ethnicity, and origin ACS 2023
- Neighborhood character
- Predominantly White (78%)
- Race & ethnicity
- White 78% Hispanic / Latino 10% Two or more races 9% Asian 2% Native American 2%
- Hispanic origin (detail)
- Mexican 8%
- Common ancestry
- Portuguese 7% Italian 4% Slovak 3%
- Foreign-born
- 6% · Canada
- Languages at home
- 91% English-only · Spanish 6% Other Indo-European 1% German/W. Germanic 1%
Political lean MEDSL · King
- 2024 margin
- Solid D (+51.7) · D 74.2% · R 22.5% · Other 3.4%
- 2008→2024 swing
- +9.6pp toward D · 2008: 42.1pp · 2024: 51.7pp
- All cycles
- 2024: D+51.7 2020: D+52.7 2016: D+50.4 2012: D+39.9 2008: D+42.1
Not yet ingested
- Civics
- —
Market trends
- HPI YoY
- ▼ -605.16%
- Current HPI
- 297.9161
- Rent YoY
- ▲ 4.32%
- Metro
- Seattle-Tacoma-Bellevue, WA
- State GDP YoY
- ▲ 4.65%
- F500 in state
- 22
Industry mix (Fortune 500 HQ in WA)
| Industry | F500 HQs | Revenue |
|---|---|---|
| Retail | 2 | $269B |
|
||
| Technology / Retail | 1 | $638B |
|
||
| Technology | 1 | $245B |
|
||
| Telecommunications | 1 | $38B |
|
||
| Food / Beverage | 1 | $36B |
|
||
| Automotive / Trucks | 1 | $34B |
|
||
Price history
+123.1% since first listed15 events — show timeline
- 2026-05-29 Price Changed $145,000 NWMLS as Distributed by MLS Grid
- 2024-10-02 Relisted — NWMLS as Distributed by MLS Grid
- 2024-04-02 Relisted — NWMLS as Distributed by MLS Grid
- 2024-02-04 Relisted — NWMLS as Distributed by MLS Grid
- 2024-02-01 Delisted — NWMLS as Distributed by MLS Grid
- 2023-12-06 Price Changed $149,950 NWMLS as Distributed by MLS Grid
- 2023-11-25 Relisted — NWMLS as Distributed by MLS Grid
- 2023-11-15 Pending — NWMLS as Distributed by MLS Grid
- 2023-10-30 Price Changed $154,950 NWMLS as Distributed by MLS Grid
- 2023-07-26 Relisted — NWMLS as Distributed by MLS Grid
- 2023-07-04 Pending — NWMLS as Distributed by MLS Grid
- 2022-12-15 Price Changed $159,950 NWMLS as Distributed by MLS Grid
- 2022-11-18 Listed $169,000 NWMLS as Distributed by MLS Grid
- 2000-06-01 Sold (MLS) $62,500 NWMLS as Distributed by MLS Grid
- 2000-04-06 Listed $65,000 NWMLS as Distributed by MLS Grid
Cash-flow waterfall
monthlySold comps — $/sqft
last 12 mo · ≤1 miLoading sold comps…