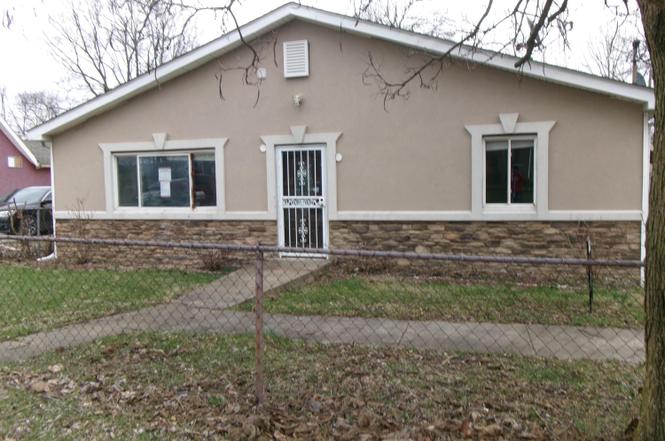
546 Emmit Ave · Lincoln Village, OH
Flood risk 1/10 · Minimal
- FEMA flood zone
- X (unshaded)
- Chance of flooding over 30 yrs
- 0.0%
- Est. flood insurance / yr
- $507 – $1,088
Fire risk 1/10 · Minimal
- Est. fire insurance / yr
- $713 – $1,323
Heat risk 3/10 · Minor
- Hot days now (above 100°F)
- 6 days/yr
- Hot days in 30 yrs
- 16 days/yr
Wind risk 2/10 · Minimal
- Chance of severe wind over 30 yrs
- 1.0%
Air-quality risk 2/10 · Minimal
- Unhealthy air days now
- 1 days/yr
- Unhealthy air days in 30 yrs
- 2 days/yr
Risk factors via First Street. Map © Google.
Why this score? — see what drove the C+ grade
The composite is a weighted blend of 9 inputs, each scored 0–100. Each bar is that input's sub-score; the figure is the points it added to the 100-point composite (weight × sub-score).
- Cash flow +22.1/30.0
- ARV discount +15.0/15.0
- DSCR +7.1/10.0
- 1% rule +5.1/10.0
- Livability +4.2/5.0
- Schools +3.8/10.0
- Condition / age +2.5/5.0
- Rent growth +2.3/5.0
- Appreciation +0.0/10.0
$189,000
🖨 Deal sheet 📄 Offer letter ✓ Due diligence
Listing remarks MLS
Large 4 bedroom, 2 full bath ranch home. updates through out the home, floors, paint, bathrooms and large updated kitchen. Kitchen was remodeled in 2018 New AC was 2016 and new roof and siding Electrical box and cable new in 2015
Key facts
- Utility room
- Kitchen
- Living room
Tags
Property features AI
Finance
- Financial info: HUD owned
Exterior
- Utilities: Public water; Public sewer
- Home design: Single-family residence; One story; Built in 1939; No common walls
- Construction: Slab foundation
- Exterior features: Shed on property; Additional parcel included (240-001595)
Interior
- Bedrooms: Four main-level bedrooms
- Bathrooms: Two full bathrooms
- Heating & cooling: Central air conditioning
- Interior features: Approximately 1,764 living area
Neighborhood map
What this means for you Summary
Snapshot
- This is a 4-bed/2.0-bath single-family listed at $189k.
Deal economics
- At list price, monthly cash flow is $304 ($4k/yr) — positive.
- The deal already cash-flows at list — no discount required.
- Meets the 1% rule at list price ($2k rent vs $189k).
- Recommended offer: $178k (6.0% below list) — sets the bar for market timing.
- Cap rate 8.2% vs local median 4.0% in Lincoln Village — top-decile yield for the area; either an underpriced asset or a hidden risk that comps aren't pricing in. Stress-test before assuming the spread holds.
Location & tenants
- Location reads 85/100 on livability (#42 in OH, #549 nationally) — a professional / high-income tenant draw. Strengths: commute A+, cost of living A+, housing A+; Watch: employment C-.
- South-Western City (suburban): math 40% / reading 48% proficiency, ranked #500 of 656 in OH (top 76%) — families likely to look elsewhere, expect single-tenant / working-renter base with shorter leases.
- Market conditions: Rents soft (-0.6%/yr); 192 active listings in the ZIP; 9 comparable units currently listed for rent nearby; rentals at typical pace (median 22d on market — plan ~3-4 weeks tenant-placement turnaround); 8,139 units permitted in Franklin County in 2024 (5,940 in 5+ unit buildings).
- This rent runs 37% of the median local income ($62k/yr) — at the standard rent-burdened threshold; future hikes will face affordability resistance.
Forward outlook
- Local home prices are declining (-3.0%/yr); year-one equity from $1k of loan paydown is wiped out by about $6k of value loss. Plan a longer hold.
- Franklin County population projected at +34% by 2050 — long-run rental-demand tailwind backs the buy-and-hold thesis.
Negotiation context
- It's been on market 75 days — a 6% lower offer ($178k) is reasonable based on typical stale-listing flexibility.
- 8 sale attempts since 29y ago; this cycle's ask has dropped $21k (10%) from the opening price — seller is motivated, your offer sets the floor, not the list.
Risks & watch-outs
- Watch-outs: built in 1939 — expect roof / HVAC / electrical / plumbing capex.
Questions for the listing agent
- It's been on market 75 days. Have you received any prior offers? Is the seller open to a 6% concession, seller financing, or rate buy-down credit?
- Built in 1939 — when were the roof, HVAC, electrical panel, plumbing, and water heater last replaced?
- Why hasn't it sold? Are there any deal-killer items the seller is aware of (foundation, flood, title, zoning, code violations)?
- Is there a deadline driving the sale (1031 exchange, divorce, estate, relocation)? That informs how much negotiation room exists.
- What's the average days-on-market for RENTAL listings here right now (not sales)? A rising rental-DOM trend means longer vacancies and softer asking-rent achievability than the comps imply.
- What's the recent tenant-quality profile in this submarket — average credit score on applications, eviction rate, late-payment / NSF rate, and stable-employment percentage? A property-management company in the area should have these aggregated.
- How much new for-sale + rental construction is in the pipeline within 1–3 miles? Heavy new supply typically softens prices + rents 12–24 months out; constrained supply supports both.
Investment metrics
- 1% rule
- 1.01% ✓
- Cap rate
- 8.22%
- Cash-on-cash
- 6.90%
- DSCR
- 1.31
- GRM
- 8.2
CMA / ARV
- ARV (on-the-fly)
- $333,396
- Comps found
- 12
Show comp detail 12 sales within ~0.75 mi
| Address | Dist | Beds/Ba | Sqft | Sold | Price | $/sf | Match |
|---|---|---|---|---|---|---|---|
| 546 Emmit Ave | 0.00mi | 4/2.0 | 1,764 (0%) | 1mo | $175,000 | $99 | 99 |
| 4763 Hafey Ave | 0.19mi | 3/1.0 (-1) | 1,868 (+6%) | 7mo | $220,920 | $118 | 67 |
| 580 Evergreen Ter | 0.56mi | 3/1.5 (-1) | 1,780 (+1%) | 1mo | $183,000 | $103 | 64 |
| 299 Lombard Rd | 0.38mi | 3/1.5 (-1) | 1,872 (+6%) | 2mo | $312,000 | $167 | 64 |
| 4824 Gilhem Ct | 0.23mi | 3/2.5 (-1) | 1,545 (-12%) | 2mo | $292,000 | $189 | 60 |
| 470 Woodlawn Ave | 0.47mi | 3/2.0 (-1) | 1,622 (-8%) | 1mo | $350,000 | $216 | 59 |
| 4778 Hafey Ave | 0.22mi | 3/2.0 (-1) | 1,511 (-14%) | 6mo | $249,900 | $165 | 56 |
| 4833 Gilhem Ct | 0.26mi | 3/2.5 (-1) | 1,558 (-12%) | 8mo | $280,000 | $180 | 55 |
| 352 Postle Blvd | 0.70mi | 3/2.5 (-1) | 1,674 (-5%) | 2mo | $350,000 | $209 | 50 |
| 429 Postle Blvd | 0.73mi | 4/2.5 | 1,906 (+8%) | 3mo | $369,900 | $194 | 48 |
| 324 Postle Blvd | 0.71mi | 4/2.5 | 1,994 (+13%) | 1mo | $382,300 | $192 | 43 |
| 1028 Rowland Ave | 0.70mi | 3/2.5 (-1) | 1,930 (+9%) | 9mo | $365,000 | $189 | 38 |
Match score weights: distance 35% · size 25% · config 20% · recency 20%. Top-matched comps best support the ARV.
Projected returns pro-forma
-3.0% appreciation · 0.0% rent growth · sell at horizon
- IRR
- -9.0%
- Equity multiple
- 0.68×
- Total profit
- $-16,892
- Equity at exit
- $28,181
- IRR
- -3.8%
- Equity multiple
- 0.78×
- Total profit
- $-11,574
- Equity at exit
- $16,341
Cash invested: $52,920 (down + closing). Projections, not guarantees.
Landlord ↔ Tenant lean methodology
- Overall (STATE)
- 73 Landlord-Friendly
- State Ohio
- 73 Landlord-Friendly · R+6
- County
- — inherits STATE
- City
- — inherits STATE
ZIP-level market 43228
- Rents YoY
- -0.6%
- Active inventory
- 192
- Price-to-rent
- 8.2×
Monthly cashflow live
- Estimated rent
- $1,915 high interval (Pro) →
- Mortgage (P&I)
- −$991
- Tax from tax record
- −$139 /mo · $1,666/yr
- Insurance
- −$79
- HOA
- −$0
- Vacancy / Maint / Mgmt
- −$402
- Net cashflow
- $304
Break-even live
UW: 25.0% down · 7.5% · 30yr · 1.5% tax · 5.0% vac · 8.0% maint · 8.0% mgmt
Financing live
Cash to close
- Down payment
- $47,250
- Closing costs
- $5,670
- Reserves months
- —
- Total cash needed
- —
Loan-product check · same deal, 3 products live
Conventional
25% down · 7.5% · 30yr
- Down + closing
- —
- Monthly P&I
- —
- Monthly cashflow
- —
- DSCR
- —
- Eligible?
- —
Personal DTI + credit; lowest rate.
DSCR
20% down · 8.5% · 30yr
- Down + closing
- —
- Monthly P&I
- —
- Monthly cashflow
- —
- DSCR
- —
- Eligible?
- —
No personal income docs; deal must DSCR.
Hard money
10% down · 12.0% · 12mo
- Down + closing
- —
- Monthly P&I
- —
- Monthly cashflow
- —
- DSCR
- —
- Eligible?
- —
Short-term bridge; refi at stabilization.
Rent comps 9 comps
| Address | Beds | Baths | Sqft | Rent | $/sqft | DOM | Units | Dist |
|---|---|---|---|---|---|---|---|---|
| 4573 Westport Rd Unit 4507-303 Columbus, OH | 4.0 | 2.0 | 1558 | $1,897 | $1.22 | 44d | 1 | 0.20mi |
| 4312 Westport Rd Columbus, OH | 2.0–3.0 | 1.5–2.5 | 1476 | $1,499 | $1.02 | 2d | 21 | 0.52mi |
| 859 Eliots Oak Rd Columbus, OH | 3.0 | 1.0 | 1232 | $1,950 | $1.58 | 15d | 1 | 0.56mi |
| 4510 Switchback Trl Columbus, OH | 3.0 | 2.0 | 1244 | $2,170 | $1.74 | 4d | 1 | 0.72mi |
| 5335 Cherry Bud Ct Columbus, OH | 3.0 | 2.0 | 1456 | $2,298 | $1.58 | 44d | 1 | 0.93mi |
| 5095 Maple Valley Dr Columbus, OH | 3.0 | 2.5 | 1709 | $2,300 | $1.35 | 21d | 1 | 0.95mi |
| 5591 Rustling Way LN Galloway, OH | 1.0–3.0 | 1.0–2.5 | 962 | $1,649 | $1.71 | 2d | 8 | 1.36mi |
| 794 Wallinger Dr Galloway, OH | 3.0 | 2.5 | 1428 | $2,125 | $1.49 | 23d | 1 | 1.48mi |
| 560 Corral Gate Ct Galloway, OH | 3.0 | 2.0 | 1658 | $2,286 | $1.38 | 21d | 1 | 1.49mi |
Listing history 26 events
-
2026-05-12status Pending
-
2026-04-15historical Contingent
-
2026-04-15status Active
-
2026-04-09historical
-
2026-04-07status Active
-
2026-04-06price $189,000
-
2026-04-06historical
-
2026-03-04status Active
-
2026-03-02historical
-
2026-02-19$210,000 Active
-
2025-12-19soldstatus $214,500
-
2022-02-07soldstatus $400,000
-
2022-01-31soldstatus $200,000 Closed 233-char remark
Show marketing remark (233 chars)
Large 4 bedroom, 2 full bath ranch home. updates through out the home, floors, paint, bathrooms and large updated kitchen. Kitchen was remodeled in 2018 New AC was 2016 and new roof and siding Electrical box and cable new in 2015
-
2022-01-01historical Contingent Finance and Inspection 233-char remark
Show marketing remark (233 chars)
Large 4 bedroom, 2 full bath ranch home. updates through out the home, floors, paint, bathrooms and large updated kitchen. Kitchen was remodeled in 2018 New AC was 2016 and new roof and siding Electrical box and cable new in 2015
-
2021-12-27status Active 233-char remark
Show marketing remark (233 chars)
Large 4 bedroom, 2 full bath ranch home. updates through out the home, floors, paint, bathrooms and large updated kitchen. Kitchen was remodeled in 2018 New AC was 2016 and new roof and siding Electrical box and cable new in 2015
-
2021-12-13historical Contingent Finance and Inspection 233-char remark
Show marketing remark (233 chars)
Large 4 bedroom, 2 full bath ranch home. updates through out the home, floors, paint, bathrooms and large updated kitchen. Kitchen was remodeled in 2018 New AC was 2016 and new roof and siding Electrical box and cable new in 2015
-
2021-12-06$199,700 Active 233-char remark
Show marketing remark (233 chars)
Large 4 bedroom, 2 full bath ranch home. updates through out the home, floors, paint, bathrooms and large updated kitchen. Kitchen was remodeled in 2018 New AC was 2016 and new roof and siding Electrical box and cable new in 2015
-
2014-04-08soldstatus $27,000
-
2014-03-27soldstatus $27,000 130-char remark
Show marketing remark (130 chars)
The subject is a single story, single family residence. The property has four bedrooms and two full bathrooms. Property needs work
-
2014-03-11historical 130-char remark
Show marketing remark (130 chars)
The subject is a single story, single family residence. The property has four bedrooms and two full bathrooms. Property needs work
-
2014-02-24$32,500 130-char remark
Show marketing remark (130 chars)
The subject is a single story, single family residence. The property has four bedrooms and two full bathrooms. Property needs work
-
2014-01-27soldstatus $28,000
-
1997-04-16soldstatus $65,000
-
1997-04-11soldstatus $67,500
-
1997-03-10historical
-
1997-02-11$72,900
ⓘ Source: listings_history table (triggers on properties + properties_extension) + one-shot
backfill from property_details.listing_events for pre-trigger history.
Tax reassessment forecast OH · Partial reset (capped growth)
- Current annual tax
- $1,666 · $139/mo
- Projected year-2 tax
- $2,307 · $192/mo
- Expected delta
- +$641/yr (+$53/mo · 38.5%)
ⓘ Screening estimate from a state-policy table — verify with the county assessor before closing.
Climate risk First Street
- Flood 1/10 Low FEMA zone X (unshaded) · 0% chance over 30 yrs
- Wildfire 1/10 Low
- Heat 3/10 Moderate 6 d/yr ≥100°F today · 16 d/yr by 30 yrs out
- Wind 2/10 Low 100% chance of damaging wind over 30 yrs
- Air quality 2/10 Low 1 unhealthy d/yr today · 2 by 30 yrs out
Nearby sold comps map
Loading sold comps map…
Walkable amenities ~0.75 mi
Loading nearby amenities…
Taxation est. · year 1
- Rental income
- $22,982
- − Mortgage interest
- −$10,587
- − Property taxes
- −$1,666
- − Insurance
- −$945
- − Repairs & maintenance
- −$1,839
- − Management
- −$1,839
- − Depreciation
- −$5,498
- Taxable income
- $609
- Est. tax owed @ 24.0%
- −$146
- After-tax cash flow
- $3,505/yr
For passive investors: Depreciation is non-cash, so a rental often shows a tax loss while cash-flowing — sheltering income. Rental losses are passive: they offset passive income freely, and up to $25,000/yr can offset ordinary (W-2) income if you actively participate and your MAGI is under $100k (phasing out to $0 by $150k); unused losses carry forward. On sale, claimed depreciation is recaptured at up to 25%, and gains may owe capital-gains tax (a 1031 exchange can defer both). Figures are a year-1 estimate at your 24.0% rate — not tax advice; consult a CPA.
Schools (NCES district)
- District
- South-Western City
- NCES district ID
- 3904480
- Math proficiency
- 40% ▼ -18.00%
- Reading proficiency
- 48% ▼ -10.00%
- Median HH income
- $51,689
- Composite
- 37.95/100
- National rank
- #4305
- State rank
- #500 of 656 in OH
Livability — Lincoln Village
- Score
- 85/100
- State rank
- #42
- US rank
- #549
Category grades
Schools grade is shown separately in the Schools card above.
Census & demographics
- Census place
- Lincoln Village, OH
- County
- Franklin County · 1,351,780 people
- City population
- 59,077
- Metro
- Columbus, OH
- Population (ZIP)
- 59,077
- Household income
- $61,713
- Rent vs Own
- Severe rent burden
- 3284.0
Population outlook (Franklin County) Hauer SSP2
- Today (2025)
- 1,456,139 people
- By 2030
- 1,556,890 · +6.9%
- By 2040
- 1,757,349 · +20.7%
- By 2050
- 1,950,539 · +34.0%
- By 2075
- 2,376,171 · +63.2%
- By 2100
- 2,636,796 · +81.1%
Race, ethnicity, and origin ACS 2023
- Neighborhood character
- Diverse neighborhood (Simpson 0.64)
- Race & ethnicity
- White 54% Black 23% Hispanic / Latino 14% Two or more races 11% Asian 3%
- Hispanic origin (detail)
- Mexican 8% Dominican 1%
- Common ancestry
- Slovak 2% Italian 1% Romanian 1%
- Foreign-born
- 19% · Canada, Jamaica
- Languages at home
- 74% English-only · Spanish 12% Other Indo-European 1% Other Asian/Pacific 1%
Political lean MEDSL · Franklin
- 2024 margin
- Strong D (+28.4) · D 63.7% · R 35.3% · Other 1.0%
- 2008→2024 swing
- +7.7pp toward D · 2008: 20.7pp · 2024: 28.4pp
- All cycles
- 2024: D+28.4 2020: D+31.4 2016: D+25.9 2012: D+21.7 2008: D+20.7
Not yet ingested
- Civics
- —
Market trends
- HPI YoY
- ▼ -245.97%
- Current HPI
- 234.1992
- Rent YoY
- ▼ -0.63%
- Metro
- Columbus, OH
- State GDP YoY
- ▲ 1.98%
- F500 in state
- 48
Industry mix (Fortune 500 HQ in OH)
| Industry | F500 HQs | Revenue |
|---|---|---|
| Insurance | 3 | $145B |
|
||
| Industrial Machinery | 3 | $49B |
|
||
| Financial Services | 3 | $24B |
|
||
| Consumer Goods | 2 | $93B |
|
||
| Aerospace / Defense | 2 | $47B |
|
||
| Utilities | 2 | $33B |
|
||
Price history
+159.3% since first listed26 events — show timeline
- 2026-05-12 Pending — CBRMLS
- 2026-04-15 Contingent — CBRMLS
- 2026-04-15 Relisted — CBRMLS
- 2026-04-09 Listing Removed — CBRMLS
- 2026-04-07 Relisted — CBRMLS
- 2026-04-06 Price Changed $189,000 CBRMLS
- 2026-04-06 Listing Removed — CBRMLS
- 2026-03-04 Relisted — CBRMLS
- 2026-03-02 Listing Removed — CBRMLS
- 2026-02-19 Listed $210,000 CBRMLS
- 2025-12-19 Sold (Public Records) $214,500 Public Records
- 2022-02-07 Sold (Public Records) $400,000 Public Records
- 2022-01-31 Sold (MLS) $200,000 CBRMLS
- 2022-01-01 Contingent — CBRMLS
- 2021-12-27 Relisted — CBRMLS
- 2021-12-13 Contingent — CBRMLS
- 2021-12-06 Listed $199,700 CBRMLS
- 2014-04-08 Sold (Public Records) $27,000 Public Records
- 2014-03-27 Sold (MLS) $27,000 CBRMLS
- 2014-03-11 Listing Removed — CBRMLS
- 2014-02-24 Listed $32,500 CBRMLS
- 2014-01-27 Sold (Public Records) $28,000 Public Records
- 1997-04-16 Sold (Public Records) $65,000 Public Records
- 1997-04-11 Sold (MLS) $67,500 CBRMLS
- 1997-03-10 Listing Removed — CBRMLS
- 1997-02-11 Listed $72,900 CBRMLS
Property tax history
+2.5%/yrLatest (2024): $1,666 · +4.8% YoY. Source: county tax records.
Cash-flow waterfall
monthlySold comps — $/sqft
last 12 mo · ≤1 miLoading sold comps…