 🏷️ Likely Rental
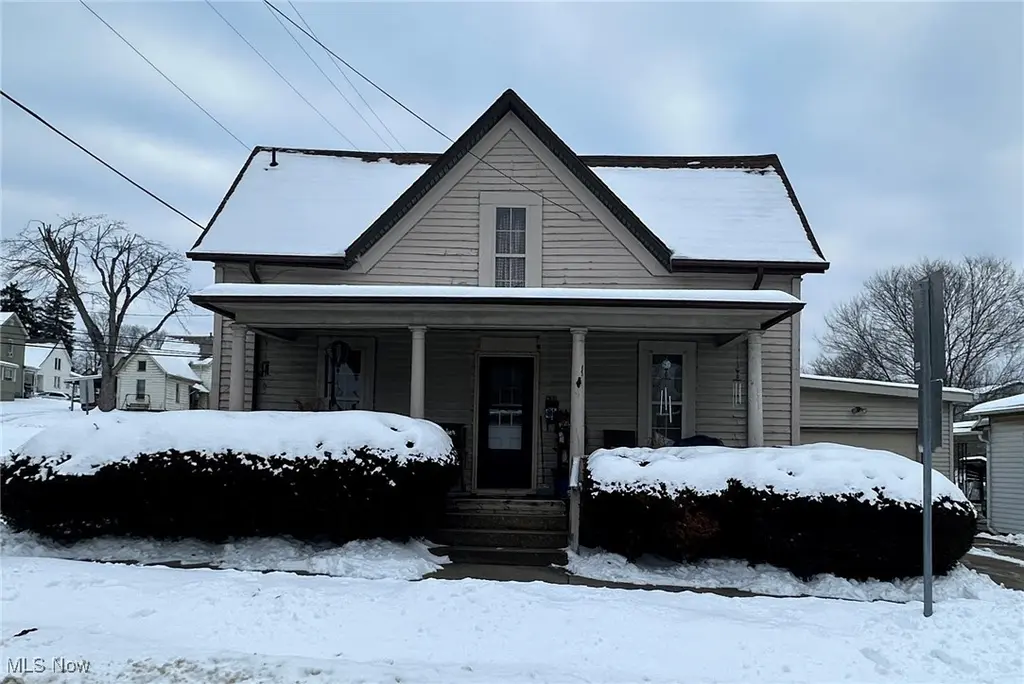
834 North St · Caldwell, OH
Flood risk 1/10 · Minimal
- FEMA flood zone
- X (unshaded)
- Chance of flooding over 30 yrs
- 0.0%
- Est. flood insurance / yr
- $473 – $860
Fire risk 3/10 · Minor
- Est. fire insurance / yr
- $713 – $1,323
Heat risk 4/10 · Minor
- Hot days now (above 100°F)
- 7 days/yr
- Hot days in 30 yrs
- 19 days/yr
Wind risk 2/10 · Minimal
- Chance of severe wind over 30 yrs
- 1.0%
Air-quality risk 1/10 · Minimal
- Unhealthy air days now
- 0 days/yr
- Unhealthy air days in 30 yrs
- 0 days/yr
Risk factors via First Street. Map © Google.
Why this score? — see what drove the A- grade
The composite is a weighted blend of 9 inputs, each scored 0–100. Each bar is that input's sub-score; the figure is the points it added to the 100-point composite (weight × sub-score).
- Cash flow +30.0/30.0
- ARV discount +15.0/15.0
- DSCR +10.0/10.0
- 1% rule +8.8/10.0
- Appreciation +7.2/10.0
- Livability +3.8/5.0
- Schools +3.5/10.0
- Rent growth +2.5/5.0
- Condition / age +2.5/5.0
$83,000
🖨 Deal sheet 📄 Offer letter ✓ Due diligence
Listing remarks MLS
This cozy 3-bedroom, 1.5-story home has been a reliable long-term rental and is currently occupied by a long-term HUD tenant who has resided in the home for 12 years. The main floor features one bedroom and a full bath along with comfortable living space, while two additional bedrooms are located upstairs. Enjoy outdoor living with a covered front porch and a covered back deck. The narrow 1-car garage offers extended depth, making it ideal for storage, a workshop, or tandem parking. With stable occupancy already in place, this property presents a solid opportunity for investors.
Key facts
- Covered front porch
- Covered back deck
- Narrow 1-car garage
Tags
Neighborhood map
What this means for you Summary
Snapshot
- This is a 2-bed/1.0-bath single-family listed at $83k.
Deal economics
- At list price, monthly cash flow is $389 ($5k/yr) — positive.
- The deal already cash-flows at list — no discount required.
- Meets the 1% rule at list price ($1k rent vs $83k).
- Recommended offer: $73k (12.0% below list) — sets the bar for market timing.
Location & tenants
- Location reads 76/100 on livability (#215 in OH, #3,322 nationally) — a middle-class / working-renter tenant base. Strengths: crime A+, cost of living A+, housing A+; Watch: schools C-, employment D, amenities F.
- Caldwell Exempted Village (town): math 36% / reading 49% proficiency, ranked #529 of 656 in OH (top 81%) — families likely to look elsewhere, expect single-tenant / working-renter base with shorter leases.
- Market conditions: 21 active listings in the ZIP; 19 units permitted in Noble County in 2024 (0 in 5+ unit buildings).
Forward outlook
- In year one you build about $4k of equity ($574 loan paydown + $4k appreciation (4.3% local appreciation)).
- Noble County population projected at -16% by 2050 — secular population decline; favor cash flow + early exit over multi-decade hold.
- At projected returns (4.3% appreciation + 3.0% rent growth), your $23k cash investment doubles in ~3 years — after that, you're playing with house money.
- By year 8, paydown + projected appreciation supports a ~$31k cash-out refi (75% LTV) — recoverable capital for the next deal without selling this one.
Negotiation context
- It's been on market 140 days — a 12% lower offer ($73k) is reasonable based on typical stale-listing flexibility.
- 3 sale attempts since 34y ago with the ask held roughly flat each time — persistent listings suggest the price (not the market) is what's stuck; bring a comps-based counter.
Risks & watch-outs
- Watch-outs: built in 1892 — expect roof / HVAC / electrical / plumbing capex.
Questions for the listing agent
- It's been on market 140 days. Have you received any prior offers? Is the seller open to a 12% concession, seller financing, or rate buy-down credit?
- Built in 1892 — when were the roof, HVAC, electrical panel, plumbing, and water heater last replaced?
- Why hasn't it sold? Are there any deal-killer items the seller is aware of (foundation, flood, title, zoning, code violations)?
- Is there a deadline driving the sale (1031 exchange, divorce, estate, relocation)? That informs how much negotiation room exists.
- What's the average days-on-market for RENTAL listings here right now (not sales)? A rising rental-DOM trend means longer vacancies and softer asking-rent achievability than the comps imply.
- What's the recent tenant-quality profile in this submarket — average credit score on applications, eviction rate, late-payment / NSF rate, and stable-employment percentage? A property-management company in the area should have these aggregated.
- How much new for-sale + rental construction is in the pipeline within 1–3 miles? Heavy new supply typically softens prices + rents 12–24 months out; constrained supply supports both.
Investment metrics
- 1% rule
- 1.38% ✓
- Cap rate
- 11.92%
- Cash-on-cash
- 20.09%
- DSCR
- 1.89
- GRM
- 6.0
CMA / ARV
- ARV (median comp)
- $149,200
- List price
- $83,000
- Delta
- -44.37%
- Verdict
- UNDERPRICED
- Comps
- 20 within 1.0 mi
Show comp detail 10 sales within ~0.75 mi
| Address | Dist | Beds/Ba | Sqft | Sold | Price | $/sf | Match |
|---|---|---|---|---|---|---|---|
| 1029 Fowler Dr | 0.17mi | 2/1.5 | 1,232 (+2%) | 11mo | $185,000 | $150 | 78 |
| 45151 Planning Mill St | 0.26mi | 3/1.0 (+1) | 1,248 (+3%) | 12mo | $122,400 | $98 | 68 |
| 1016 Main St | 0.15mi | 3/1.0 (+1) | 1,262 (+4%) | 19mo | $95,000 | $75 | 65 |
| 610 Belford St | 0.20mi | 2/1.5 | 1,352 (+12%) | 5mo | $176,000 | $130 | 64 |
| 301 East St | 0.44mi | 2/1.0 | 1,284 (+6%) | 6mo | $145,000 | $113 | 64 |
| 609 Lewis St | 0.21mi | 3/1.0 (+1) | 1,288 (+7%) | 18mo | $159,900 | $124 | 59 |
| 807 Young St | 0.22mi | 3/1.0 (+1) | 1,344 (+11%) | 9mo | $161,000 | $120 | 59 |
| 16878 Bronze Heights Ln | 0.45mi | 3/1.0 (+1) | 1,092 (-10%) | 8mo | $174,900 | $160 | 52 |
| 16707 Terrace Ave | 0.61mi | 2/1.0 | 1,106 (-8%) | 9mo | $123,000 | $111 | 50 |
| 519 Fairground St | 0.29mi | 3/2.0 (+1) | 1,104 (-9%) | 18mo | $153,000 | $139 | 48 |
Match score weights: distance 35% · size 25% · config 20% · recency 20%. Top-matched comps best support the ARV.
Projected returns pro-forma
4.32% appreciation · 3.0% rent growth · sell at horizon
- IRR
- 29.0%
- Equity multiple
- 2.75×
- Total profit
- $40,702
- Equity at exit
- $43,635
- IRR
- 28.3%
- Equity multiple
- 5.44×
- Total profit
- $103,229
- Equity at exit
- $72,637
Cash invested: $23,240 (down + closing). Projections, not guarantees.
Landlord ↔ Tenant lean methodology
- Overall (STATE)
- 73 Landlord-Friendly
- State Ohio
- 73 Landlord-Friendly · R+6
- County
- — inherits STATE
- City
- — inherits STATE
ZIP-level market 43724
- Home prices YoY
- 2.7%
- Active inventory
- 21
- Price-to-rent
- 6.0×
Monthly cashflow live
- Estimated rent
- $1,145 medium interval (Pro) →
- Mortgage (P&I)
- −$435
- Tax from tax record
- −$46 /mo · $548/yr
- Insurance
- −$35
- HOA
- −$0
- Vacancy / Maint / Mgmt
- −$240
- Net cashflow
- $389
Break-even live
UW: 25.0% down · 7.5% · 30yr · 1.5% tax · 5.0% vac · 8.0% maint · 8.0% mgmt
Financing live
Cash to close
- Down payment
- $20,750
- Closing costs
- $2,490
- Reserves months
- —
- Total cash needed
- —
Loan-product check · same deal, 3 products live
Conventional
25% down · 7.5% · 30yr
- Down + closing
- —
- Monthly P&I
- —
- Monthly cashflow
- —
- DSCR
- —
- Eligible?
- —
Personal DTI + credit; lowest rate.
DSCR
20% down · 8.5% · 30yr
- Down + closing
- —
- Monthly P&I
- —
- Monthly cashflow
- —
- DSCR
- —
- Eligible?
- —
No personal income docs; deal must DSCR.
Hard money
10% down · 12.0% · 12mo
- Down + closing
- —
- Monthly P&I
- —
- Monthly cashflow
- —
- DSCR
- —
- Eligible?
- —
Short-term bridge; refi at stabilization.
Listing history 21 events
-
2026-06-18days on market $83,000 Active 140 DOM
-
2026-06-17days on market $83,000 Active 139 DOM
-
2026-06-16days on market $83,000 Active 138 DOM
-
2026-06-15days on market $83,000 Active 137 DOM
-
2026-06-13days on market $83,000 Active 135 DOM
-
2026-06-12days on market $83,000 Active 134 DOM
-
2026-06-09days on market $83,000 Active 131 DOM
-
2026-06-08days on market $83,000 Active 130 DOM
-
2026-06-07days on market $83,000 Active 129 DOM
-
2026-06-05days on market $83,000 Active 127 DOM
-
2026-06-04days on market $83,000 Active 125 DOM
-
2026-06-02days on market $83,000 Active 124 DOM
-
2026-06-01days on market $83,000 Active 123 DOM
-
2026-05-31days on market $83,000 Active 122 DOM
-
2026-01-28$83,000 Active 585-char remark
Show marketing remark (585 chars)
This cozy 3-bedroom, 1.5-story home has been a reliable long-term rental and is currently occupied by a long-term HUD tenant who has resided in the home for 12 years. The main floor features one bedroom and a full bath along with comfortable living space, while two additional bedrooms are located upstairs. Enjoy outdoor living with a covered front porch and a covered back deck. The narrow 1-car garage offers extended depth, making it ideal for storage, a workshop, or tandem parking. With stable occupancy already in place, this property presents a solid opportunity for investors.
-
2020-10-28price $30,000
-
2020-08-26price $30,000
-
2003-04-16$30,000
-
1993-09-15price $199,500
-
1993-09-15historical
-
1992-09-15$199,500
ⓘ Source: listings_history table (triggers on properties + properties_extension) + one-shot
backfill from property_details.listing_events for pre-trigger history.
Tax reassessment forecast OH · Partial reset (capped growth)
- Current annual tax
- $548 · $46/mo
- Projected year-2 tax
- $922 · $77/mo
- Expected delta
- +$373/yr (+$31/mo · 68.1%)
ⓘ Screening estimate from a state-policy table — verify with the county assessor before closing.
Climate risk First Street
- Flood 1/10 Low FEMA zone X (unshaded) · 0% chance over 30 yrs
- Wildfire 3/10 Moderate
- Heat 4/10 Moderate 7 d/yr ≥100°F today · 19 d/yr by 30 yrs out
- Wind 2/10 Low 100% chance of damaging wind over 30 yrs
- Air quality 1/10 Low 0 unhealthy d/yr today · 0 by 30 yrs out
Nearby sold comps map
Loading sold comps map…
Walkable amenities ~0.75 mi
Loading nearby amenities…
Taxation est. · year 1
- Rental income
- $13,742
- − Mortgage interest
- −$4,649
- − Property taxes
- −$548
- − Insurance
- −$415
- − Repairs & maintenance
- −$1,099
- − Management
- −$1,099
- − Depreciation
- −$2,415
- Taxable income
- $3,516
- Est. tax owed @ 24.0%
- −$844
- After-tax cash flow
- $3,826/yr
For passive investors: Depreciation is non-cash, so a rental often shows a tax loss while cash-flowing — sheltering income. Rental losses are passive: they offset passive income freely, and up to $25,000/yr can offset ordinary (W-2) income if you actively participate and your MAGI is under $100k (phasing out to $0 by $150k); unused losses carry forward. On sale, claimed depreciation is recaptured at up to 25%, and gains may owe capital-gains tax (a 1031 exchange can defer both). Figures are a year-1 estimate at your 24.0% rate — not tax advice; consult a CPA.
Schools (NCES district)
- District
- Caldwell Exempted Village
- NCES district ID
- 3904525
- Math proficiency
- 36% ▼ -5.00%
- Reading proficiency
- 49% ▼ -5.00%
- Median HH income
- $37,221
- Composite
- 35.3/100
- National rank
- #4967
- State rank
- #529 of 656 in OH
Livability — Caldwell
- Score
- 76/100
- State rank
- #215
- US rank
- #3322
Category grades
Schools grade is shown separately in the Schools card above.
Census & demographics
- Census place
- Caldwell, OH
- County
- Noble · 16,074 people
- Population (ZIP)
- 9,007
- Household income
- $54,005
- Rent vs Own
- Severe rent burden
- 2.5
Population outlook (Noble County) Hauer SSP2
- Today (2025)
- 13,837 people
- By 2030
- 13,584 · -1.8%
- By 2040
- 12,674 · -8.4%
- By 2050
- 11,551 · -16.5%
- By 2075
- 8,951 · -35.3%
- By 2100
- 6,807 · -50.8%
Race, ethnicity, and origin ACS 2023
- Neighborhood character
- Predominantly White (90%)
- Race & ethnicity
- White 90% Black 6% Hispanic / Latino 2% Two or more races 1%
- Common ancestry
- Subsaharan African 3% Lithuanian 2% Serbian 2%
- Foreign-born
- 1% · Canada
- Languages at home
- 98% English-only · Spanish 1% Russian/Polish/Slavic 1%
Political lean MEDSL · Noble
- 2024 margin
- Solid R (+64.6) · D 17.4% · R 82.0%
- 2008→2024 swing
- -48.8pp toward R · 2008: -15.8pp · 2024: -64.6pp
- All cycles
- 2024: R+64.6 2020: R+62.5 2016: R+55.1 2012: R+24.6 2008: R+15.8
Not yet ingested
- Civics
- —
Market trends
- HPI YoY
- ▲ 4.32%
- Current HPI
- 166.7357
- Rent YoY
- —
- Metro
- —
- State GDP YoY
- ▲ 1.98%
- F500 in state
- 48
Industry mix (Fortune 500 HQ in OH)
| Industry | F500 HQs | Revenue |
|---|---|---|
| Insurance | 3 | $145B |
|
||
| Industrial Machinery | 3 | $49B |
|
||
| Financial Services | 3 | $24B |
|
||
| Consumer Goods | 2 | $93B |
|
||
| Aerospace / Defense | 2 | $47B |
|
||
| Utilities | 2 | $33B |
|
||
Price history
-58.4% since first listed7 events — show timeline
- 2026-01-28 Listed $83,000 MLSNOW
- 2020-10-28 Price Changed $30,000 MLSNOW
- 2020-08-26 Price Changed $30,000 MLSNOW
- 2003-04-16 Listed $30,000 MLSNOW
- 1993-09-15 Listing Removed — MLSNOW
- 1993-09-15 Price Changed $199,500 MLSNOW
- 1992-09-15 Listed $199,500 MLSNOW
Property tax history
+1.3%/yrLatest (2025): $548 · -0.4% YoY. Source: county tax records.
Cash-flow waterfall
monthlySold comps — $/sqft
last 12 mo · ≤1 miLoading sold comps…