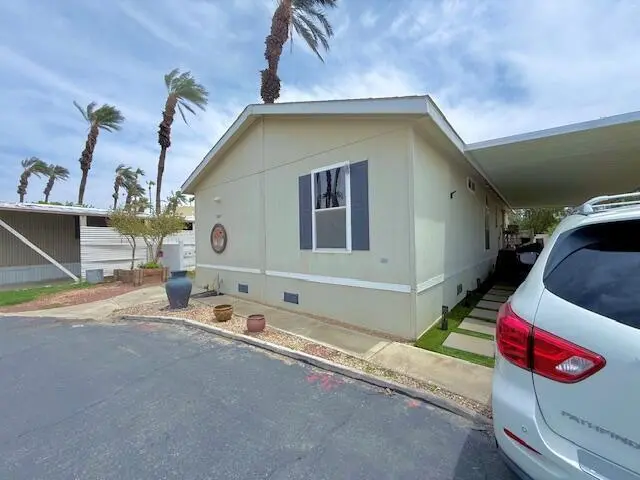
80870 Us Hwy 111 Spc 207 · Indio, CA
Flood risk 1/10 · Minimal
- FEMA flood zone
- X
- Chance of flooding over 30 yrs
- 0.0%
- Est. flood insurance / yr
- $507 – $1,088
Fire risk 1/10 · Minimal
- Est. fire insurance / yr
- $659 – $1,223
Heat risk 10/10 · Severe
- Hot days now (above 114°F)
- 6 days/yr
- Hot days in 30 yrs
- 17 days/yr
Wind risk 1/10 · Minimal
- Chance of severe wind over 30 yrs
- —
Air-quality risk 4/10 · Minor
- Unhealthy air days now
- 4 days/yr
- Unhealthy air days in 30 yrs
- 5 days/yr
Risk factors via First Street. Map © Google.
Why this score? — see what drove the B grade
The composite is a weighted blend of 9 inputs, each scored 0–100. Each bar is that input's sub-score; the figure is the points it added to the 100-point composite (weight × sub-score).
- Cash flow +30.0/30.0
- 1% rule +10.0/10.0
- DSCR +10.0/10.0
- ARV discount +8.1/15.0
- Schools +3.8/10.0
- Condition / age +3.8/5.0
- Rent growth +3.3/5.0
- Livability +2.7/5.0
- Appreciation +0.0/10.0
$140,000
🖨 Deal sheet (PDF) 📄 Offer letter ✓ Due diligence
Listing remarks MLS
Just REDUCED lowest price ! Seller will carry with 100k down, low interest 7 year max term, I also have a great manufacture home lender with 5% down. Newer Manufactured Home built in 2005. This is a 4 bedroom 2 bath home with a nice side yard, one of a kind in a great location with mountain views from your kitchen window and carport. Privately located at the end of a small culdesac, inside Riverdale Estates 55+ gated community in Indio. Community clubhouse, pool, spa. Must be park approved. Space rent $725.00 base rent. Call for a showing appointment today!
Key facts
- Gated community
- Community clubhouse
- Spa
Tags
Neighborhood map
What this means for you Summary
Snapshot
- This is a 4-bed/2.0-bath manufactured listed at $140k. Condition is rated good.
Deal economics
- At list price, monthly cash flow is $2k ($23k/yr) — positive.
- The deal already cash-flows at list — no discount required.
- Meets the 1% rule at list price ($4k rent vs $140k).
- Recommended offer: $123k (12.0% below list) — sets the bar for market timing.
- Cap rate 22.5% vs local median 4.3% in Indio — top-decile yield for the area; either an underpriced asset or a hidden risk that comps aren't pricing in. Stress-test before assuming the spread holds.
Location & tenants
- Location reads 53/100 on livability (#927 in CA) — a working-class tenant base; expect higher turnover. Strengths: housing B+; Watch: employment D, schools F, crime F.
- Desert Sands Unified (suburban): math 31% / reading 56% proficiency, ranked #199 of 517 in CA (top 38%) — families likely to look elsewhere, expect single-tenant / working-renter base with shorter leases.
- Market conditions: Rents rising (+3.3%/yr); 514 active listings in the ZIP; 24 comparable units currently listed for rent nearby; rentals lingering (median 45d on market — plan ~5-8 weeks vacancy on turnover, expect pricing pressure); 62% of comp listings sitting > 30 days — soft ceiling on asking rent; 9,195 units permitted in Riverside County in 2024 (1,512 in 5+ unit buildings).
- At $3,618/mo this rent would consume 65% of the median local household income ($67k/yr) (locally 2036% of renters already pay >50% of income on rent) — very limited rent-growth headroom before tenants either downsize or default.
Forward outlook
- Local home prices are declining (-3.0%/yr); year-one equity from $968 of loan paydown is wiped out by about $4k of value loss. Plan a longer hold.
- Riverside County population projected at +22% by 2050 — long-run rental-demand tailwind backs the buy-and-hold thesis.
- At projected returns (-3.0% appreciation + 3.3% rent growth), your $39k cash investment doubles in ~2 years — after that, you're playing with house money.
Negotiation context
- It's been on market 121 days — a 12% lower offer ($123k) is reasonable based on typical stale-listing flexibility.
- 3 sale attempts; this cycle's ask has dropped $29k (17%) from the opening price — seller is motivated, your offer sets the floor, not the list.
Risks & watch-outs
- Climate carrying-cost: extreme-heat days projected 6→17/yr by 2055 (HVAC capex compounding) — expect insurance premiums to compound above CPI over the hold.
Questions for the listing agent
- It's been on market 121 days. Have you received any prior offers? Is the seller open to a 12% concession, seller financing, or rate buy-down credit?
- Why hasn't it sold? Are there any deal-killer items the seller is aware of (foundation, flood, title, zoning, code violations)?
- Is there a deadline driving the sale (1031 exchange, divorce, estate, relocation)? That informs how much negotiation room exists.
- Schools are F-rated, which usually means shorter tenancies and higher turnover. Who's the typical renter profile here, and what's been the actual vacancy rate?
- Crime grade is F in this area — have there been break-ins, vandalism, or insurance claims at this property in the last 3 years? What carrier currently insures it and at what premium?
- What's the average days-on-market for RENTAL listings here right now (not sales)? A rising rental-DOM trend means longer vacancies and softer asking-rent achievability than the comps imply.
- What's the recent tenant-quality profile in this submarket — average credit score on applications, eviction rate, late-payment / NSF rate, and stable-employment percentage? A property-management company in the area should have these aggregated.
- How much new for-sale + rental construction is in the pipeline within 1–3 miles? Heavy new supply typically softens prices + rents 12–24 months out; constrained supply supports both.
Investment metrics
- 1% rule
- 2.58% ✓
- Cap rate
- 22.50%
- Cash-on-cash
- 57.89%
- DSCR
- 3.58
- GRM
- 3.2
CMA / ARV
- ARV (median comp)
- $142,000
- List price
- $140,000
- Delta
- -1.41%
- Verdict
- FAIR
- Comps
- 11 within 1.0 mi
Show comp detail 5 sales within ~0.75 mi
| Address | Dist | Beds/Ba | Sqft | Sold | Price | $/sf | Match |
|---|---|---|---|---|---|---|---|
| 80870 Us Highway 111 #213 | 0.12mi | 3/2.0 (-1) | 1,344 (0%) | 22mo | $95,000 | $71 | 71 |
| 46618 Madison St #84 | 0.32mi | 3/2.0 (-1) | 1,344 (0%) | 14mo | $179,000 | $133 | 68 |
| 46618 Madison St #74 | 0.36mi | 3/2.0 (-1) | 1,344 (0%) | 15mo | $215,000 | $160 | 66 |
| 46618 Madison St #131 | 0.42mi | 3/2.0 (-1) | 1,344 (0%) | 19mo | $209,900 | $156 | 59 |
| 46618 Madison St #6 | 0.31mi | 3/2.0 (-1) | 1,440 (+7%) | 23mo | $140,000 | $97 | 49 |
Match score weights: distance 35% · size 25% · config 20% · recency 20%. Top-matched comps best support the ARV.
Projected returns pro-forma
-3.0% appreciation · 3.34% rent growth · sell at horizon
- IRR
- 56.8%
- Equity multiple
- 3.53×
- Total profit
- $99,049
- Equity at exit
- $20,874
- IRR
- 61.9%
- Equity multiple
- 7.29×
- Total profit
- $246,687
- Equity at exit
- $12,105
Cash invested: $39,200 (down + closing). Projections, not guarantees.
Landlord ↔ Tenant lean methodology
- Overall (STATE)
- 18 Strongly Tenant-Friendly
- State California
- 18 Strongly Tenant-Friendly · D+13
- County
- — inherits STATE
- City
- — inherits STATE
ZIP-level market 92201
- Home prices YoY
- -28.4%
- Rents YoY
- 3.3%
- Active inventory
- 514
- Price-to-rent
- 3.2×
Monthly cashflow live
- Estimated rent
- $3,618 high interval (Pro) →
- Mortgage (P&I)
- −$734
- Tax est. 1.5%
- −$175 /mo · $2,100/yr
- Insurance
- −$58
- HOA
- −$0
- Vacancy / Maint / Mgmt
- −$760
- Net cashflow
- $1,891
Break-even live
Sensitivity live
| Price | -10% $1,988 | -5% $1,939 | +0% $1,891 | +5% $1,843 | +10% $1,794 |
|---|---|---|---|---|---|
| Rent | -10% $1,605 | -5% $1,748 | +0% $1,891 | +5% $2,034 | +10% $2,177 |
| Rate | -1.0pp $1,961 | -0.5pp $1,927 | base $1,891 | +0.5pp $1,855 | +1.0pp $1,818 |
UW: 25.0% down · 7.5% · 30yr · 1.5% tax · 5.0% vac · 8.0% maint · 8.0% mgmt
Financing live
Cash to close
- Down payment
- $35,000
- Closing costs
- $4,200
- Reserves months
- —
- Total cash needed
- —
Loan-product check · same deal, 3 products live
Conventional
25% down · 7.5% · 30yr
- Down + closing
- —
- Monthly P&I
- —
- Monthly cashflow
- —
- DSCR
- —
- Eligible?
- —
Personal DTI + credit; lowest rate.
DSCR
20% down · 8.5% · 30yr
- Down + closing
- —
- Monthly P&I
- —
- Monthly cashflow
- —
- DSCR
- —
- Eligible?
- —
No personal income docs; deal must DSCR.
Hard money
10% down · 12.0% · 12mo
- Down + closing
- —
- Monthly P&I
- —
- Monthly cashflow
- —
- DSCR
- —
- Eligible?
- —
Short-term bridge; refi at stabilization.
Rent comps 24 comps
| Address | Beds | Baths | Sqft | Rent | $/sqft | DOM | Units | Dist |
|---|---|---|---|---|---|---|---|---|
| 47412 Harbour Lights Ln Indio, CA | 3.0 | 2.0 | 1650 | $4,000 | $2.42 | 13d | 1 | 0.30mi |
| 80472 Suncastle Rd Indio, CA | 4.0 | 2.0 | 1569 | $3,100 | $1.98 | 44d | 1 | 0.42mi |
| 80675 Harvard Ct Indio, CA | 3.0 | 2.0 | 1248 | $2,495 | $2.00 | 11d | 1 | 0.55mi |
| 47800 Madison St Indio, CA | 3.0 | 2.0 | 1456 | $2,850 | $1.96 | 44d | 1 | 0.56mi |
| 80071 Palm Circle Dr La Quinta, CA | 3.0 | 2.0 | 1650 | $2,850 | $1.73 | 25d | 1 | 0.73mi |
| 81272 Palmwood Dr Indio, CA | 3.0 | 2.0 | 1104 | $3,200 | $2.90 | 44d | 1 | 0.82mi |
| 47537 Calle Diamante Indio, CA | 3.0 | 2.0 | 1772 | $3,200 | $1.81 | 44d | 1 | 0.82mi |
| 79930 Fiesta Dr La Quinta, CA | 3.0 | 2.0 | 1828 | $5,500 | $3.01 | 44d | 1 | 0.84mi |
| 47870 Sumac St La Quinta, CA | 3.0 | 2.0 | 1760 | $4,175 | $2.37 | 44d | 1 | 0.99mi |
| 47884 Coronado Dr Indio, CA | 3.0 | 2.0 | 1808 | $2,995 | $1.66 | 25d | 1 | 1.02mi |
| 81153 Francis Ave Indio, CA | 3.0 | 2.0 | 1288 | $2,800 | $2.17 | 6d | 1 | 1.03mi |
| 45385 Big Canyon St Indio, CA | 3.0 | 2.0 | 1529 | $3,200 | $2.09 | 44d | 1 | 1.06mi |
| 81683 De Plata Ave Indio, CA | 3.0 | 2.0 | 1216 | $3,100 | $2.55 | 19d | 1 | 1.10mi |
| 45233 Big Canyon St Indio, CA | 3.0 | 2.0 | 1529 | $6,000 | $3.92 | 44d | 1 | 1.11mi |
| 79679 Carmel Valley Ave Indio, CA | 3.0 | 2.0 | 1529 | $2,900 | $1.90 | 22d | 1 | 1.13mi |
| 47395 Monroe St #264 Indio, CA | 3.0 | 2.0 | 1257 | $3,200 | $2.55 | 44d | 1 | 1.16mi |
| 79948 Bethpage Ave Indio, CA | 3.0 | 2.0 | 1529 | $4,500 | $2.94 | 44d | 1 | 1.17mi |
| 81871 Victoria St Indio, CA | 4.0 | 2.0 | 1826 | $3,400 | $1.86 | 44d | 1 | 1.24mi |
| 45809 Crosswater St Indio, CA | 3.0 | 2.0 | 1529 | $6,000 | $3.92 | 44d | 1 | 1.30mi |
| 49084 Violet St Indio, CA | 4.0 | 2.5 | 1731 | $2,700 | $1.56 | 44d | 1 | 1.32mi |
| 81291 Begonia Ct Indio, CA | 4.0 | 2.0 | 1731 | $7,500 | $4.33 | 44d | 1 | 1.36mi |
| 81867 Lancer Way Indio, CA | 3.0 | 2.5 | 1798 | $2,450 | $1.36 | 25d | 1 | 1.47mi |
| 45930 Las Colinas La Quinta, CA | 3.0 | 2.0 | 1500 | $2,850 | $1.90 | 25d | 1 | 1.47mi |
| 45420 Desert Fox Dr La Quinta, CA | 3.0 | 3.0 | 1830 | $6,000 | $3.28 | 44d | 1 | 1.47mi |
Listing history 12 events
-
2026-06-03days on market $140,000 Active 121 DOM
-
2026-06-02days on market $140,000 Active 120 DOM
-
2026-06-01days on market $140,000 Active 119 DOM
-
2026-05-31days on market $140,000 Active 118 DOM
-
2026-03-25price $140,000 563-char remark
Show marketing remark (563 chars)
Just REDUCED lowest price ! Seller will carry with 100k down, low interest 7 year max term, I also have a great manufacture home lender with 5% down. Newer Manufactured Home built in 2005. This is a 4 bedroom 2 bath home with a nice side yard, one of a kind in a great location with mountain views from your kitchen window and carport. Privately located at the end of a small culdesac, inside Riverdale Estates 55+ gated community in Indio. Community clubhouse, pool, spa. Must be park approved. Space rent $725.00 base rent. Call for a showing appointment today!
-
2026-03-14price $159,000 563-char remark
Show marketing remark (563 chars)
Just REDUCED lowest price ! Seller will carry with 100k down, low interest 7 year max term, I also have a great manufacture home lender with 5% down. Newer Manufactured Home built in 2005. This is a 4 bedroom 2 bath home with a nice side yard, one of a kind in a great location with mountain views from your kitchen window and carport. Privately located at the end of a small culdesac, inside Riverdale Estates 55+ gated community in Indio. Community clubhouse, pool, spa. Must be park approved. Space rent $725.00 base rent. Call for a showing appointment today!
-
2026-02-02$169,000 Active 563-char remark
Show marketing remark (563 chars)
Just REDUCED lowest price ! Seller will carry with 100k down, low interest 7 year max term, I also have a great manufacture home lender with 5% down. Newer Manufactured Home built in 2005. This is a 4 bedroom 2 bath home with a nice side yard, one of a kind in a great location with mountain views from your kitchen window and carport. Privately located at the end of a small culdesac, inside Riverdale Estates 55+ gated community in Indio. Community clubhouse, pool, spa. Must be park approved. Space rent $725.00 base rent. Call for a showing appointment today!
-
2025-11-30historical
-
2025-11-04price $169,000
-
2025-09-02status Active
-
2025-07-29price $179,000
-
2025-06-24$159,500 Active
ⓘ Source: listings_history table (triggers on properties + properties_extension) + one-shot
backfill from property_details.listing_events for pre-trigger history.
Climate risk First Street
- Flood 1/10 Low FEMA zone X · 0% chance over 30 yrs
- Wildfire 1/10 Low
- Heat 10/10 Extreme 6 d/yr ≥114°F today · 17 d/yr by 30 yrs out
- Wind 1/10 Low
- Air quality 4/10 Moderate 4 unhealthy d/yr today · 5 by 30 yrs out
Nearby sold comps map
Loading sold comps map…
Walkable amenities ~0.75 mi
Loading nearby amenities…
Taxation est. · year 1
- Rental income
- $43,420
- − Mortgage interest
- −$7,842
- − Property taxes
- −$2,100
- − Insurance
- −$700
- − Repairs & maintenance
- −$3,474
- − Management
- −$3,474
- − Depreciation
- −$4,073
- Taxable income
- $21,758
- Est. tax owed @ 24.0%
- −$5,222
- After-tax cash flow
- $17,470/yr
For passive investors: Depreciation is non-cash, so a rental often shows a tax loss while cash-flowing — sheltering income. Rental losses are passive: they offset passive income freely, and up to $25,000/yr can offset ordinary (W-2) income if you actively participate and your MAGI is under $100k (phasing out to $0 by $150k); unused losses carry forward. On sale, claimed depreciation is recaptured at up to 25%, and gains may owe capital-gains tax (a 1031 exchange can defer both). Figures are a year-1 estimate at your 24.0% rate — not tax advice; consult a CPA.
Condition & rehab AI · 13 photos
This 2005 manufactured home in a gated community offers a good condition with minimal repairs needed. The home's location and amenities make it a solid investment.
Value-add opportunities
- Both Paint the exterior siding — Enhances curb appeal and can increase both resale and rental value.
- Both Replace the ceiling fan in the living room — Improves the aesthetic and functionality of the living space, which can increase both resale and rental value.
Renovation cost estimate screening
Value-add ROI direction
- Both Paint the exterior siding — Enhances curb appeal and can increase both resale and rental value. ↑
- Both Replace the ceiling fan in the living room — Improves the aesthetic and functionality of the living space, which can increase both resale and rental value. ↑
ⓘ Cost ranges are severity-bucket heuristics (US national rule-of-thumb). Get contractor quotes + a written scope before underwriting a rehab budget.
Schools (NCES district)
- District
- Desert Sands Unified
- NCES district ID
- 0611110
- Math proficiency
- 31% ▼ -4.00%
- Reading proficiency
- 56% ▲ 7.00%
- Median HH income
- $54,957
- Composite
- 37.77/100
- National rank
- #4346
- State rank
- #199 of 517 in CA
Livability — Indio
- Score
- 53/100
- State rank
- #927
- US rank
- #24244
Category grades
Schools grade is shown separately in the Schools card above.
Census & demographics
- Census place
- Indio, CA
- County
- Riverside County · 2,287,001 people
- City population
- 100,560
- Metro
- Riverside-San Bernardino-Ontario, CA
- Population (ZIP)
- 65,825
- Household income
- $66,758
- Rent vs Own
- Severe rent burden
- 2036.0
Population outlook (Riverside County) Hauer SSP2
- Today (2025)
- 2,664,475 people
- By 2030
- 2,802,692 · +5.2%
- By 2040
- 3,050,904 · +14.5%
- By 2050
- 3,256,783 · +22.2%
- By 2075
- 3,655,058 · +37.2%
- By 2100
- 3,766,594 · +41.4%
Race, ethnicity, and origin ACS 2023
- Neighborhood character
- Predominantly Hispanic (74%)
- Race & ethnicity
- Hispanic / Latino 74% Two or more races 39% White 19% Black 3% Asian 3% Native American 1%
- Hispanic origin (detail)
- Mexican 69%
- Common ancestry
- Romanian 1% Iranian 1%
- Foreign-born
- 29% · Canada, Vietnam, Jamaica
- Languages at home
- 41% English-only · Spanish 55% Arabic 1% Tagalog/Filipino 1%
Political lean MEDSL · Riverside
- 2024 margin
- Toss-up / Even · D 48.0% · R 49.3% · Other 2.6%
- 2008→2024 swing
- -3.6pp toward R · 2008: 2.3pp · 2024: -1.3pp
- All cycles
- 2024: R+1.3 2020: D+8.0 2016: D+4.3 2012: R+0.4 2008: D+2.3
Not yet ingested
- Civics
- —
Market trends
- HPI YoY
- ▼ -138.46%
- Current HPI
- 348.6605
- Rent YoY
- ▲ 3.34%
- Metro
- Riverside-San Bernardino-Ontario, CA
- State GDP YoY
- ▲ 3.21%
- F500 in state
- 116
Industry mix (Fortune 500 HQ in CA)
| Industry | F500 HQs | Revenue |
|---|---|---|
| Technology | 27 | $1,492B |
|
||
| Financial Services | 3 | $174B |
|
||
| Retail | 3 | $44B |
|
||
| Insurance | 3 | $26B |
|
||
| Media / Entertainment | 2 | $115B |
|
||
| Pharmaceuticals / Biotech | 2 | $62B |
|
||
Price history
-12.2% since first listed8 events — show timeline
- 2026-03-25 Price Changed $140,000 GPSMLS
- 2026-03-14 Price Changed $159,000 GPSMLS
- 2026-02-02 Listed $169,000 GPSMLS
- 2025-11-30 Listing Removed — GPSMLS
- 2025-11-04 Price Changed $169,000 GPSMLS
- 2025-09-02 Relisted — GPSMLS
- 2025-07-29 Price Changed $179,000 GPSMLS
- 2025-06-24 Listed $159,500 GPSMLS
Cash-flow waterfall
monthlySold comps — $/sqft
last 12 mo · ≤1 miLoading sold comps…